

In your own words, give a simplified explanation of the CMF indicator with an example of how to calculate its value?

The CMF indicator was created to monitor the distribution and accumulation of an asset in 1980 by Marc Chaikin. The indicator took its name after the creator, and its purpose was to identify potential alerts by using the CMF indicator line to cross the centerline. The center line is marked 0, and the reading range is between +1 and -1 with a default period of 21 days.
The CMF lines fluctuate above and below the center line just like an oscillator, which has been used to identify changes in the money flow. Moving above 0 is a buying pressure which leads to a positive(+) reading, and sustained selling leads to a negative(-) reading as the indicator moves below 0. Another situation is when the CMF line oscillates just around the center line, which will indicate some kind of equal buying and selling pressure. During such moments, no clear trend is being detected in the market. The CMF indicator is a good tool for traders to follow up on the market trend of an asset to trade.
- Calculating Chaikin Money Flow
To have the value of Chaikin Money Flow, let follow the three steps :
- 1). Money Flow Multiplier
We determined the MFM of each period

- 2). Money flow volume
We determined the MFV is by multiplying the volume for the period by the MFM obtained from step one above. MFV is calculated daily

- 3). Chaikin Money Flow (CMF)
To have the value of the CMF, divide the daily Money Flow over a particular period (20 or 21) by the sum of the volume for the same period. Remember, the default is 21 days which represents the trading days in a month.

The Chaikin Money Flow indicator is represented on a chart as a histogram and is an oscillator similar to MACD.
What to check out when trading with CMF
when trading with CMF, traders can their attention to some signals like Trends, Crosse and divergences.
- Trends
A trader can pick out possible trend lines on the indicator to anticipate possible breakout points on the chart and to be able to identify trends that will like to continue in the current trend.
As CMF value is sustained above zero because of the continued buying period, the market stays in a continuing bullish trend showing that the price will continue to rise with the trend. So when the CMF moves below zero, that is selling pressure. As it stays below the continued bearish trend, and prices continue to fall as well.
What to take back, the higher the reading indicator the stronger the trend be it in the negative (below zero) or positive (above zero).
- Crosses
It is seen on the chart when the CMF indicator oscillates on the zero line moving above and below, which can be a signal for possible trend reversal. The CMF crosses can be bullish or bearish, as the bullish signal is when the CMF is above the zero line and bearish when it is below the zero line. whatever signal determining the trend direction of the price, bullish is an upward price trend, and bearish is a downward price trend
Another scenario can be a false signal as the CMF cross is temporal which will be necessary for the trader to wait for the indicator to move above +0.1 and below -0.1 to minimize such signals.
- Divergence
It is a situation where the price direction is different from the CMF indicator direction. Like I mentioned above, the CMF indicator above the zero line means the price asset is in a bullish direction. In the case where we have the price of the asset picking a new high and the CMF indicator is not going high, we are in a Bearish divergence which is a strong signal for a possible trend reversal to the downside. Same as when the price of the asset falls to a new low and the CMF indicator is not moving in the same direction, and we are in a bullish divergence and possible trend reversal to the upward side.
The stronger the momentum of the trend, a new CMF reading, and a possible new price high.
- Example
Let us now assume, for asset X Low Price is $256, High Price is $365, with a Closing Price at $280. The volume for the period is 1,450,124 and a 21-period sum of volume 2,548,125
Step 1

Step 2

Step 3

Note, the figures used in the example above are assumptions. The CMF is a negative value and indicates selling pressure in the market.

Demonstrate how to add the indicator to the chart on a platform other than the tradingview, highlighting how to modify the settings of the period(best setting).

I will be demonstrating how to add a CMF indicator on the BTC/USDT char on the Bittrex web platform. https://global.bittrex.com/
- Login to my account, Click Market and select my pairs below on the market page.
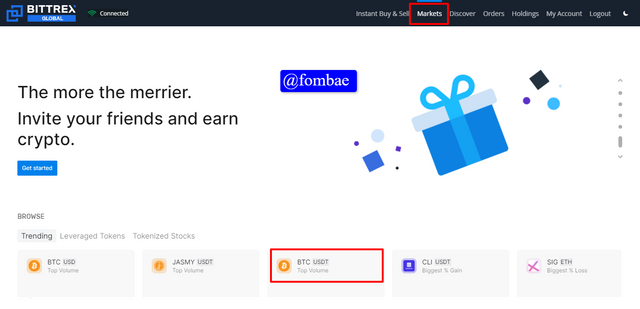 screenshot bittrex
We have the charge for the pair, click on the fx indicator to search the desired indicator.
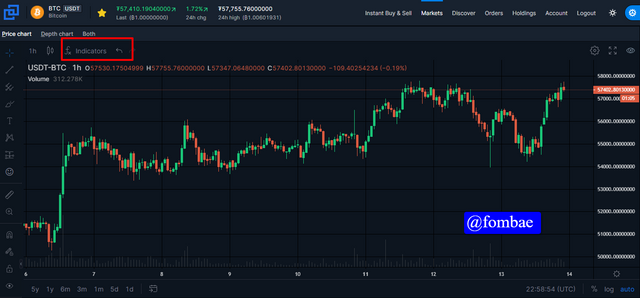 screenshot bittrex
type CMF in the search input, Click Chaikin Money Flow
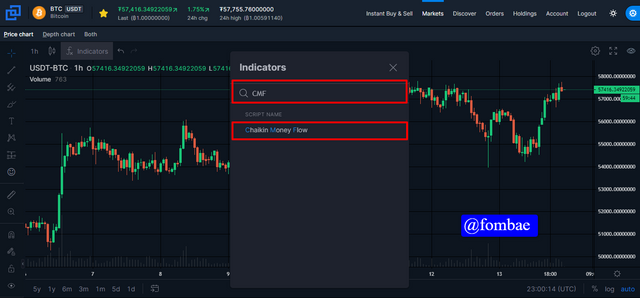 screenshot bittrex
Click the (x) to close the indicator search window. Now we have the CMF below the volume chart.
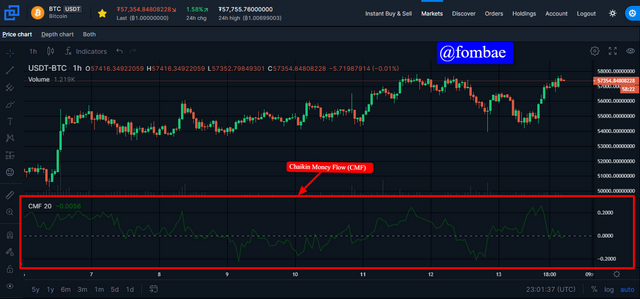 screenshot bittrex
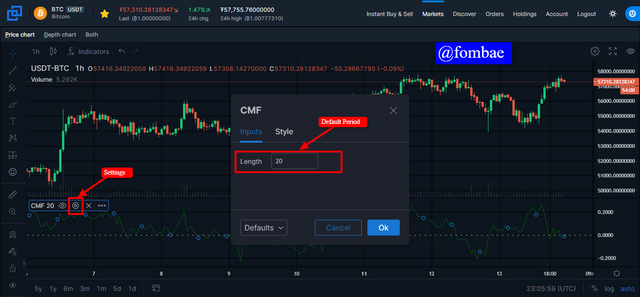
To make changes to the default settings, click settings (you will find the icons as soon as you over the CMF abbreviations)
 screenshot bittrex
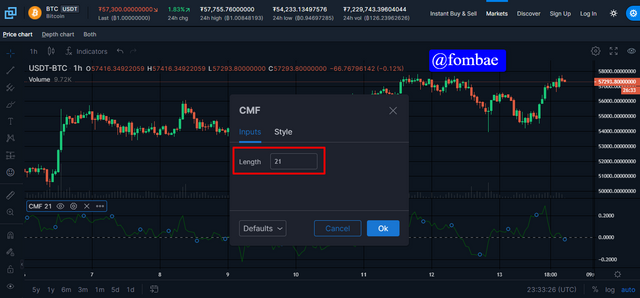
The default period for Bittrex is 20, it is all left to the trader to make the changes to your desired period. I will change what we have here to 21
 Screenshot bittrex
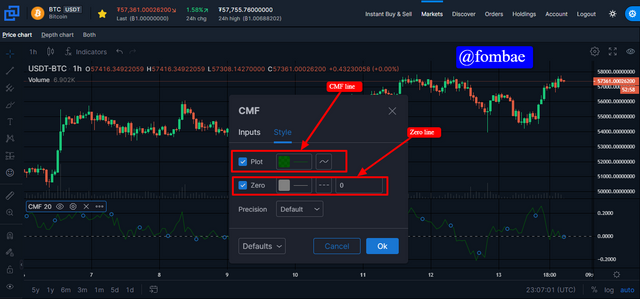
Another option is the style, here we can change the color of the CMF line and zero line.
 Screenshot bittrex
By clicking Ok, we are applying the changes made to the settings.
The best setting will be the default period of 21 days mentioned during the creation of this indicator by Marc Chaikin. In a higher setting, more than 21 days will show a slow nature in trading signals, and below will show a rapid nature in trading signals. When the signal is slow, traders will be able to pick out a few valuable signals and miss out on others while when signals fastly change, traders might not even succeed in picking out a vali=uable signal. 21 days is more stable giving the trader the possible position to pick valuable and strong signals making it the best so far.
Other settings might work well for advanced traders depending on the strategy they plan to implement.

What is the indicator’s role in confirming the direction of trend and determining entry and exit points (buy/sell)؟

To confirm the direction of the trend is about monitoring the movement and direction of the CMG indicator line as if it crosses the Zero line.
- Entry Point
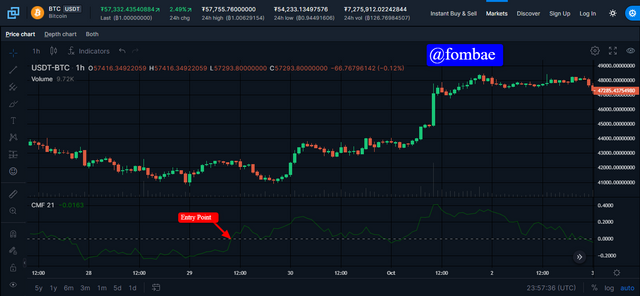
The best Entry point can be confirmed when the CMF indicator line crosses over the zero line in the positive direction. During the sure moment, it means the buying pressure for the asset is high. To avoid falling into a false signal, it will be advisable to set the entry point when the CMF indicator is slightly above the zero line.
 Screenshot bittrex
From the image above, the entry point is indicated above the zero line as the CMF indicator line moves above. From that point, we can see the price of the asset in an upward trend.
- Exit Point
The best Exit point can be confirmed when the CMF indicator line crosses below the zero line which is the negative direction. During sure moments, it means the selling pressure for the asset is high. To avoid falling into a false signal, it will be advisable to set the exit point when the CMF indicator is slightly below the zero line.
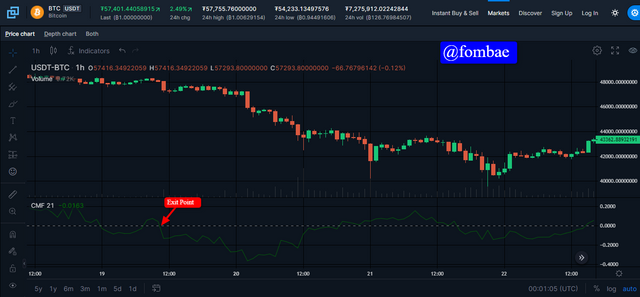 Screenshot bittrex
From the image above, the Exit point is indicated below the zero line as the CMF indicator line moves below. From that point, we can see the price of the asset in a downward trend(falling).

Trade with a crossover signal between the CMF and wider lines such as +/- 0.1 or +/- 0.15 or it can also be +/- 0.2, identify the most important signals that can be extracted using several examples.

Note I mentioned crosses as one of the aspects to look after when treading with CMF, CMF indicator line oscillates on the zero line moving above and below. As I highlighted above, when the CMF indicator moves above, it is the right signal to buy and sell when it moves below zero.
I will be using a +/- 0.1 wide line to identify the most important signals.
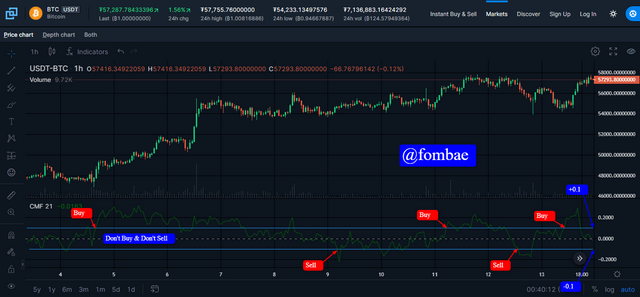 Screenshot bittrex
As indicated in the image, when the CMF indicator line oscillates on the zero line and moves above +0.1. It is the right moment to buy and the perfect time to sell when the CMF indicator crosses and moves below -0.1. Like I mentioned above, this cross can signal bullish or bearish, applying the wide line is to reduce the chance of falling into false signals.
Another scenario is when the CMF is between the chosen wide lines, as it continues to oscillate on the zero line without moving out of the wide line ranges. Making buying and selling decisions can lead to picking a false signal as a cross signal will not necessarily be a sell-or-buy signal.

How to trade with divergence between the CMF and the price line? Does this trading strategy produce false signals?

As I mentioned above, divergences are about reading the movements of the CMF indicator line and the price line on a chart as both lines are in different directions during a particular period. I will be looking at the bullish and bearish divergence.
- Bullish divergence
In the case of a Bullish divergence, the price line is in a downward movement while the CMF indicator line is in an upward movement. During such movement in the market, is an indication of a change in the current price trend. Given that the market was in a bearish trend, strong anticipation of divergence is expected, and in this case, will be a bullish divergence as the buying pressure is initiated.
We can see a clear example on the chart below, the price in a downward trend and the CMF indicator line in an upward trend. As the price is falling, the CMF indicator line is moving further closer to the zero line reducing the negative value reading. Like I mentioned above, moving above the zero line is a possible bullish trend that diverges from the current market price from bearish to bullish.
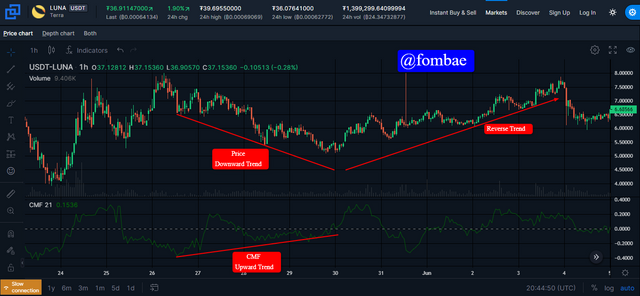 Screenshot bittrex
- Bearish Divergence.
In the case of a Bearish divergence, the price line is in an upward movement while the CMF indicator line is in a downward movement. during such movement in the market, is an indication of a change in the current price trend. Given that the market was in a bullish trend, strong anticipation of divergence is expected, and in this case, will be a Bearish divergence as the selling pressure is initiated.
We can see a clear example on the chart below, the price in an upward trend and the CMF indicator line in a downward trend. As the price moves up, the CMF indicator line is moving further closer to the zero line reducing the positive value reading. Like I mentioned above, moving below the zero line is a possible Bearish trend which is divergence to the current market price from Bullish to Bearish.
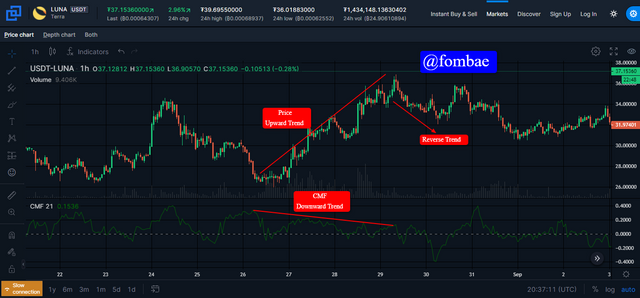 Screenshot bittrex
- Does this trading strategy produce false signals?
Yes, apart from the set high and low light, which can produce false signals as I mentioned above. The divergence trading strategy can also produce false signals, especially when applied alone.
While divergence trading indicates a possible reversal trend, it is also possible to pop up a false signal and continue in the current market trend.
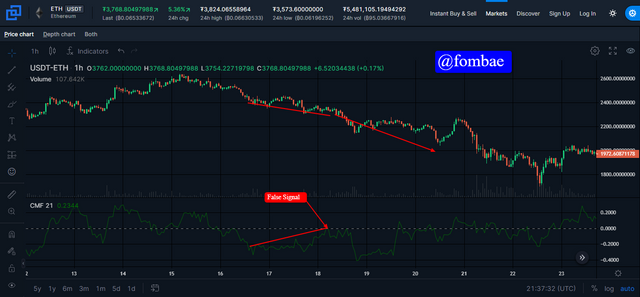 Screenshot bittrex
As mentioned above, using a wide line will help a trader in order not to buy too early, For the CMF to move toward zero, and slightly above is not guaranteed that the indicator will continue. If the traders (HODL) turn to sell an asset with less buying pressure from other traders, the indicator will move back below the zero line. At this point, a false signal as the prices will continue to fall, and the treaders who bought will lose.

Conclusion

If you are looking at a stand-alone indicator, CMF is not an option as it is difficult for traders to implement the stop loss and take profit points. It is a great indicator during trending markets to confirm trend directions as it indicates exit points during a trend reversal. Divergent is the perfect identifier of potential trend reversal making it easy for traders to make buying and selling decisions.
CMF relies on the buying and selling pressure of traders in the market for a particular asset over a set period. When the CMF is positive it indicates a Bulls, and negative indicates a Bear.
Thanks, Prof @kouba01
I wish to have you discord id Prof to get in touch.
Hi @fombae
Thanks for participating in the Steemit Crypto Academy
Feedback
Total| 8/10
This is good content. Thanks for demonstrating your understanding of Trading using the Chaikin Money Flow Indicator.
Downvoting a post can decrease pending rewards and make it less visible. Common reasons:
Submit
Thanks Prof @yohan2on for reviewing my homework for this week.
Downvoting a post can decrease pending rewards and make it less visible. Common reasons:
Submit