Every trader needs a tool to use for picking out moments to buy and sell in the market. For every trader to profit, you need to understand when you observe a bullish trend and bearish trend to know when to enter or exit in a market. Today my homework is about one of the indicators used by traders to enter and exit a market. I'm not an advanced trader, hope my explanation does help. Let look at Ichimoku-Kinko-Hyo Indicator. To activate this indicator, go to your indicator, and search Ichimoku Cloud.

1. Discuss your understanding of Kumo, as well as its two lines. (Screenshot required)

The cloud space between senkou span A and senkou span B in the Ichimoku Kinko Hyo indicator used to determine the trend on a market chart is called Kumo Cloud. It's a tool to determine future trends in the market. Most traders use the Kumo cloud to determine the resistance and support level in the market.
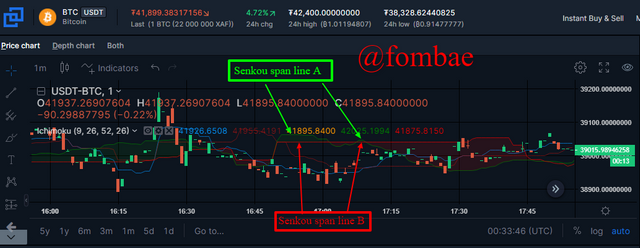
The Kumo can always create an upward trend or bullish when the senkou span A is above the senkou span B and a downward trend or bearish when senkou span B is above senkou span A in the market. Why most traders will always look critically at the upward and downward trend, some will look at the third scenario, which is the straight-line trend. It is difficult to find such a trend in the market, this happens when both senkou span A and senkou span B are moving side by side with an almost flat nature.
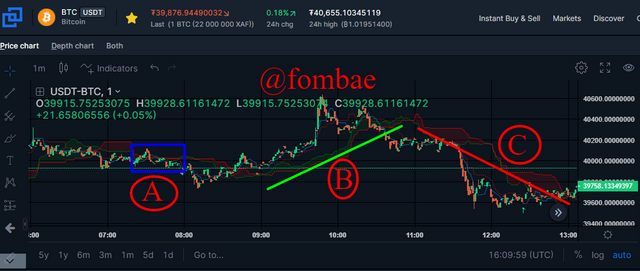
A => Neutral(straight-line) Trend
B => Upward Trend
C => Downward Trend
Like I mentioned above, it is made up of two lines that create the cloud. These two lines are senkou span A, also known as leading span A and senkou span B, known as leading span B.
- Senkou span A
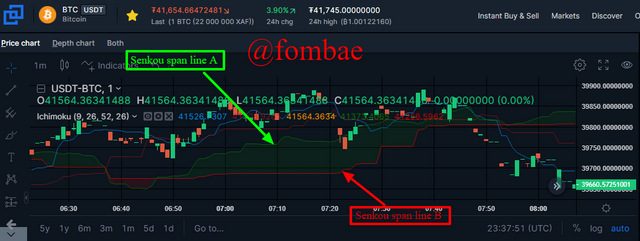
It indicates the price movement on the market chart and gives more information on the resistance and support levels on the chart. Senkou span A(green line) is visible when the market is in a bullish trend, and as I mentioned, it becomes the upper border of the Komu cloud.
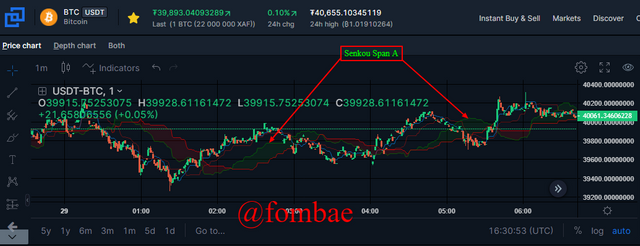 Greenline presently above the Kumo cloud
- Senkou span B
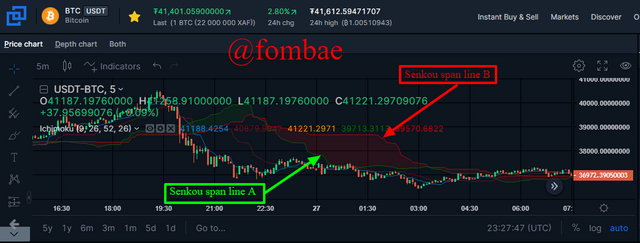
It is the opposite direction and movements of Senkou Span A. Senkou Span B is visible when the market is in a bearish trend, and this happens when Senkou Span B, which is the red line indicator crosses over the Senkou Span A. Now Senkou Span B has become the top border of the Komu cloud.
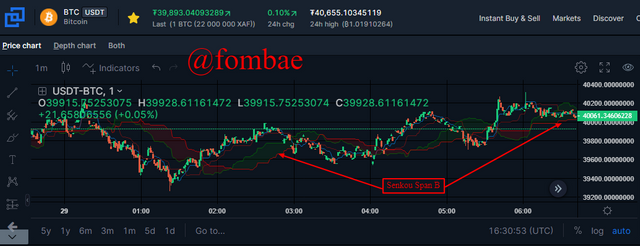 Redline presently above the Kumo cloud
Both Senkou Span A and Senkou Span B are calculated using historical data to come out with a 26-period value. The Ichimoku Cloud indicator is a sensitive indicator when it comes to understanding market trends in both bullish and bearish directions.

2. What is the relationship between this cloud and the price movement? And how do you determine resistance and support levels using Kumo? (Screenshot required)

The Kumo cloud moves along while affecting the price, either costs the price to move up or down. Very interesting to note in relationships between the cloud and the price is the crossing movement of leading lines and the thickness of the cloud.
- Crossing movement of leading lines
When the leading line A (Senkou Span A) crosses over leading line B, we will start observing a bullish trend and as well a raisin in the price to moving up. The same works when the leading line B crosses over leading line A, we start noticing a bearish trend and as well a fall in price.
- The thickness of the cloud
I mention this section between the two leading lines, the thickness can be used to determine the strength of the resistance and support levels. The thicker the cloud the stronger the resistance and support level. so that will mean, the thinner the cloud the weaker the resistance and support levels.
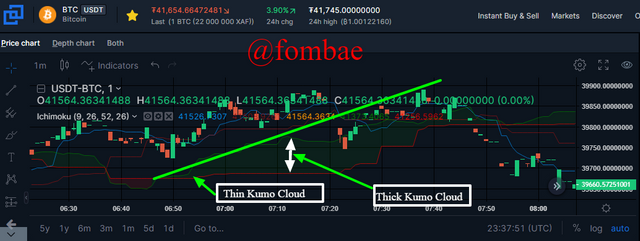 Upward Trend
To relate with the price, when we have a thicker cloud, that will mean a strong resistance level and support level, the prices will be affected either in an uptrend or downward trend. From our chart, you notice when the two leading lines cross each other toward a twist. The cloud becomes thin and as the trend moves it becomes thicker. When it is about to cross, it starts going thin toward another twist. The bottom line is that the cloud thickness will affect the price in the market.
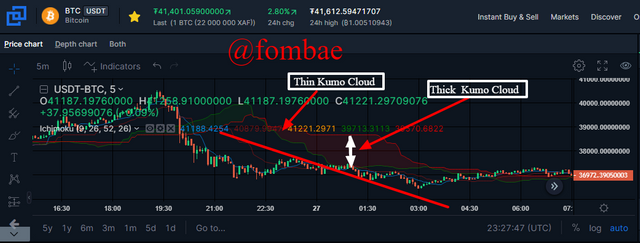 Downward trend
As I mentioned, we observe a bullish(uptrend) when leading line A is above leading line B. So during this position, and we have a thick cloud we are experiencing a strong resistance level, and prices will move up. At times, if the cloud starts going thin, that is moving towards a cross-over (twist) point, we experience a weak resistance level, and the price will start moving down. The twist is the thinnest area in the cloud.
On the other hand, we observe a bearish when leading line B moves over leading line A. The thicker the space between this line, the stronger the support level, and a continued fall in price. As the cloud starts going thin toward a twist, the support level becomes weaker and the price starts a possible upward movement.
How do you determine resistance and support levels using Kumo?
The resistance and support level are created immediately as the two leading lines cross each other creating the Kumo cloud. This twisting movement between the two leading lines is influenced by the market trend. Since the market trend creates many twists, both lines determine the resistance and support level.
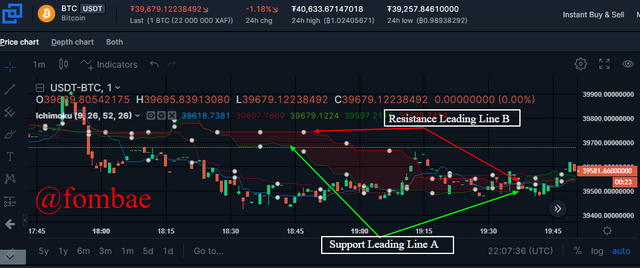
The Ichimoku indicator is visible, reading the strength of resistance level and when to get into a trade or back out. During a downward trend or upward trend in a Kumo cloud. A trader can find more than one break which can be tempted to get into a trade, and which is a wrong decision if the market is in a downward trend. So the best strategy will be to observe both leading lines on the Kumo cloud.
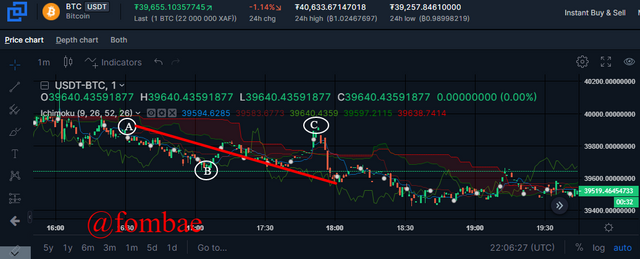
It is easy to get into a loss if you are using a traditional line to determine your resistance and support level. Traditional users will accept and use downtrend at point A when they get to point B, where the trend breaks. The user buys knowing that the price will rise, but it eventually breaks and continues the downtrend. Same with position C, traditional users will quickly get into a trade and buy.

3. How and why is the twist formed? And once we've "seen" the twist, how do we use it in our trading? (Screenshot required)

Whenever the Senkou span line A crosses Senkou span line B, the point of the cross is called the twist in the Ichimoku cloud. This twist can be created toward an uptrend, downtrend, and neutral in a market. So on a market chart, we can pick out three types of twist and the trend.
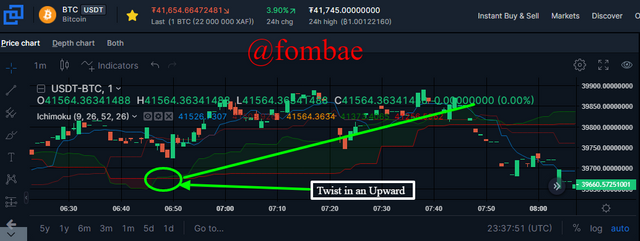
- Twist in an Upward trend
It is the point where Senkou span line A crosses over Senkou span line B creating a bullish trend in the market. At this point, we will be observing an upward trend in the market.
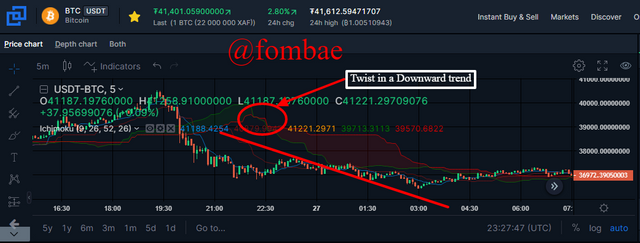
- Twist in a Downward trend
Here the Senkou span line B crosses over Senkou span line A creating a bearish trend in the market. At this point, the tread can see a possible downward trend in the market.
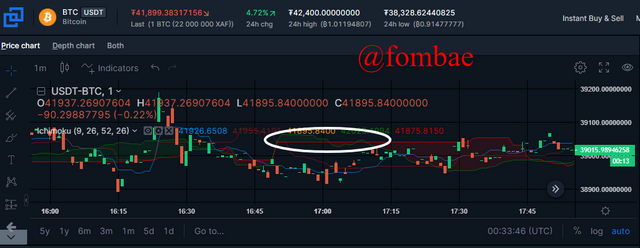
- Twist in a Neutral Trend
This is the case where both Senkou span lines cross each other several times within a duration(period) in the market. At this point, we are observing a neutral signal in the market.
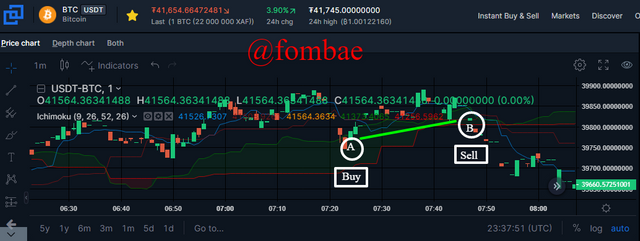
How to use Twist in trending.
For a twist to create in a Kumo cloud, the cloud starts going thinner. Remember I mentioned that a twist is created when Senkou span lines cross each other. When it comes to trading, we need to know if we are in a bullish or bearish trend in the market. If the Kumo cloud is in a bearish trend, meaning we have Senkou span line B over Senkou span line A, we have to start observing when the price will create a strong resistance and support level. At this point, we can decide to sell to avoid losses or wait when the cloud starts going thinner, toward creating a twist to enter a bullish trend. We can buy at this point and make some profit by putting into consideration the moments when the price candle penetrates the Kumo cloud.

4. What is the Ichimoku trend confirmation strategy with the cloud (Kumo)? And what are the signals that detect a trend reversal? (Screenshot required)

The Ichimoku trend confirmation strategy is the use of the Ichimoku cloud indicator to confirm the three trends in a market. Like we are talking all through, we have the Bullish (upward) trend, Bearish(downward) trend, and the Neutral trend in the market.
- Bullish trend
A bullish trend is created when Senkou span line A crosses over Senkou span line B. If our cloud is moving upward, we can categorically confirm we are observing a bullish trend.
- Bearish trend
A bearish trend is formed when Senkou span line B crosses over Senkou span line A this time. If this is moving downward, we can confirm we are observing a downward trend.
- Neutral Trend
It is the reason I used it in the case of bullish and bearish cloud movement. Here, it could be any of the Senkou span lines above the other. Our concern is the cloud movement, Neutral trend is when the two lines are moving almost at a flat level. This trend always has the possibility of several twists within the trend and is difficult to create strong resistance and support levels. in our chart below Senkou span line B is on a straight line.
What are the signals that detect a trend reversal?
- Price Movement
As the Senkou span lines form a twist in the market and the price penetrates our cloud, the trader should wait and observe. After the penetration, the price will either break above or below creating a new trend reversal.
- Cloud direction
The direction of the cloud is a visible tool used to detect a trend reversal. If we have our Senkou span lines A above the Senkou span lines B, we observe a possible uptrend, and the opposite will possibly create a downward trend.
- Twist
At the point of twist, be it an uptrend or downtrend twist, we will be creating a possible trend reversal giving that the market trend is moving up or down respectively. Note that with a Neutral twist, we will not be able to easily detect a trend reversal.

5. Explain the trading strategy using the cloud and the Chikou span together. (Screenshot required)

Chikou span lines are used to observe trend reversal, and help in making buying and selling decisions on a market both long term and short term trade. Both Chikou span and Kumo cloud work on a 26-period trend. While the Kumo cloud shows 26 periods in the future, the Chikou span moves 26 periods backward from the present closing price. In trading, we have to look at the Chikou span uptrend and Chikou span downtrend.
- Chikou span in an uptrend
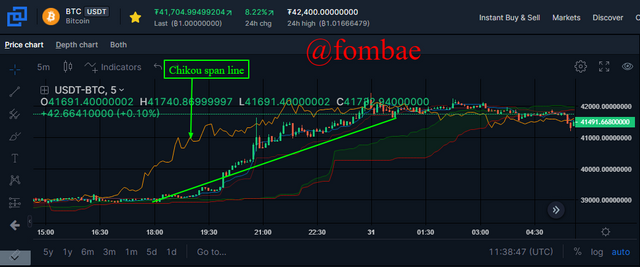
It is when the Chikou span line crosses above both the price and Kumo cloud in a market. At this point, we will be observing an uptrend(bullish) market.
- Chikou span in a downtrend
It is when the Chikou span line moves below or is found below the price and Kumo cloud. This downward movement is known as a downtrend(bearish trend) market.
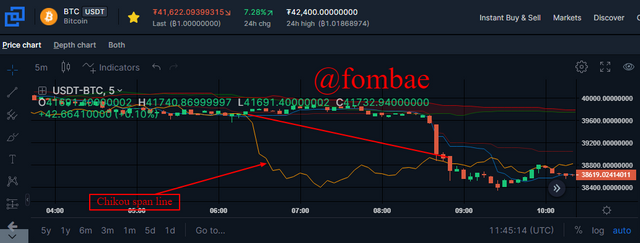
Traders always have different positions to take in a market to make profits or minimize losses. The Chikou span line is a tool to put into consideration when using the Ichimoku-Kinko-Hyo Indicator.
- Long term position
If looking at getting into a long-term position in trading, you have to pay attention to the Chikou span line and Kumo cloud with the current price. While the Chikou span line and the 26 candle period move upward above the Kumo cloud. At this moment our chart will indicate a possible strong bullish trend in the market. When the Chikou span line moves upward above the Kumo cloud, the price will take a long position and perfect time to go in for a long position trade.
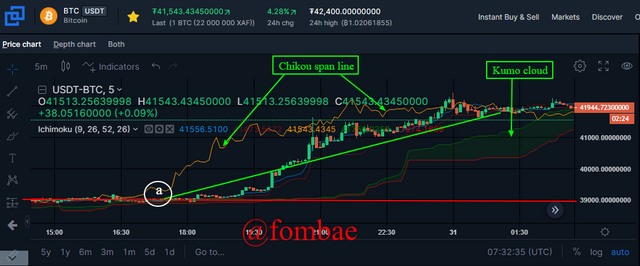
From the chart above, point a is a position to take a long-term position in the market.
- Short term position
This is the case where the Chikou span line and the 26 candles break the price to move below the Kumo cloud. At this moment we will be observing a possible strong bearish market in the trend. No, the price will take a short position and the best moment to sell and rebuy at a lower price.
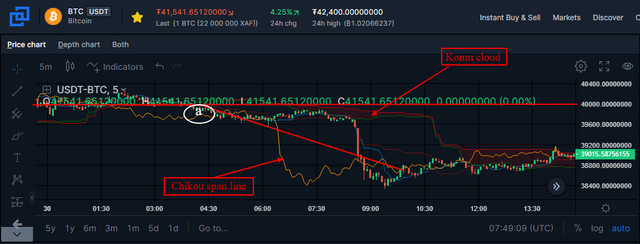

6. Explain the use of the Ichimoku indicator for the scalping trading strategy. (Screenshot required)

Scalping trading is the use of a short time (5,10,15 mins) to make a small profit in a market. Most of the time this strategy is used to minimize huge losses in the market. Ichimoku indicator is a very useful tool for scalping trading as its time frame is small. This trading strategy can be used in an upward, downward, and neutral trend using a small time frame in the market. I will use 5 mins time to explain the different trends
- Ichimoku uptrend
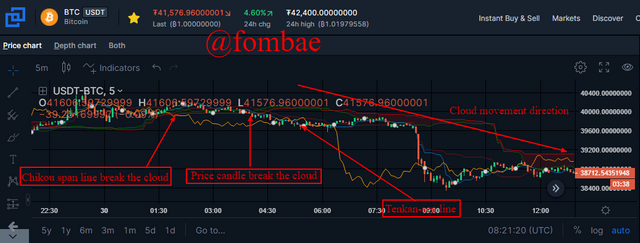
When the price candle breaks and moves over the Kumo cloud in the same direction, that will mean our price will move in the upward direction. Looking at the Chikou span line too, when it moves upward breaking the Kumo cloud. Our price will also move upward as the Kumo cloud moves in that same direction creating the upward price trend. Visibly here, we have our Tenkan-sen line above the Kijun-sen line.
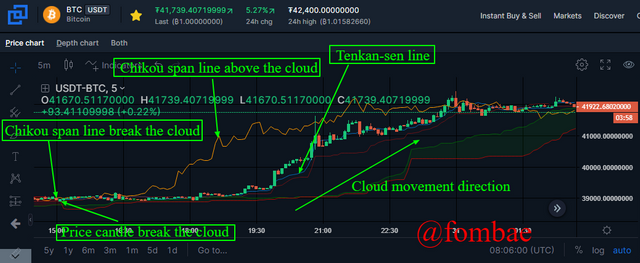
- Ichimoku downtrend
Here is when the Chikou span line and price candle break the Kumo cloud and move downward as the Kumo cloud. Now when our price moves in the same direction as the Kumo cloud. We have a strong indication of a downward(bearish) trend. A cool signal is when the Tenkan-sen line is below the Kijun-sen line.
- Ichimoku Neutral
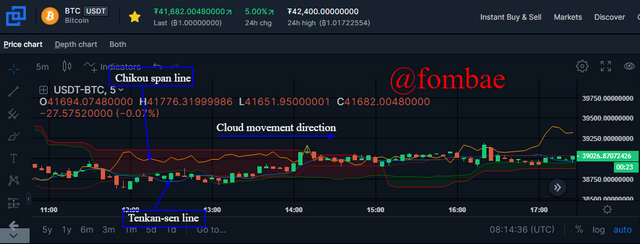
It is when all indicators Chikou span lines, price candles, and Kumo clouds are moving on a flat level with the price. During such a market range, we will have several twists. It looks difficult to apply scalp trading, but critically you can still find some buying and selling points. Using Ichimoku cloud indicators will be of great help at this moment for a trade that will be willing to get into the market.

Conclusion

The Ichimoku Kinko Hyo Indicator is a great tool so far as I went through this course. The easy reading of the Senkou span A and Senkou span B movements to create Kumo clouds makes it very easy to identify the different trends in the market. Every trade wants to make a profit and needs to be able to detect strong resistance and support levels. To help in when to get into the market and when to exit. I never knew about this indicator, and this course has enlightened me to understand the different trend reversals created by the Chikou span lines. Lastly was the scalping strategy, which can be very profitable in a long-term position. Thanks, @kouba01, and welcome back and happy you are strong again.

Hello @fombae,
Thank you for participating in the 5th Week Crypto Course in its third season and for your efforts to complete the suggested tasks, you deserve a 8.5/10 rating, according to the following scale:
My review :
An article with good content in which you have provided a set of useful information to answer the questions posed, and I will take some notes for you:
Thanks again for your effort, and we look forward to reading your next work.
Sincerely,@kouba01
Downvoting a post can decrease pending rewards and make it less visible. Common reasons:
Submit
Respected Professor: please verify my post I shall be very thankful to you
https://steemit.com/hive-108451/@naveed15125/crypto-academy-season-3-beginners-course-homework-post-for-task-4-blockchain-consensus-mechanism
Downvoting a post can decrease pending rewards and make it less visible. Common reasons:
Submit