

What is a HODL wave, how do you calculate the age of a coin(BTC, LTC) in a UTXO accounting structure? How do you interpret a HODL wave in Bull cycles?

HOLD, known in crypto known as HODL. HODL is the ability to buy and sell a particular asset. Now HOLD wave is an on-chain metrics presentation(indicator) on a chart using the age distribution information of a coin to display changes due to the age distribution. It comes about as a result of the behavior of holding and spending of the coin. The coin supply is grouped in categories depending on age, using the intensity nature of the color bands on the chart. So the age distribution of the exciting supply of a coin and the changes made as the coin matures can be determined by the HODL wave. HODL wave band intensity (thickness) represents the changes in coin maturity in holding and spending. HODL wave is not just about the intensity of HOLD wave band colors. We can look at Accumulation and HODLing behavior, and the Increased proportion of an Old coin in the market.
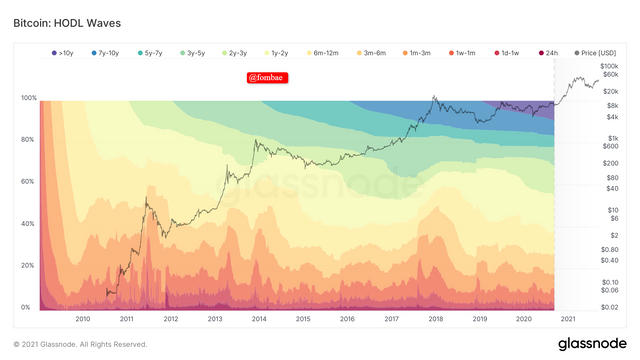 Screenshot Glassnodestudio.com
HODL wave is calculated by getting the number of coins transacted in a specific time frame. This time frame ranges from:
- less than 1 day
- 1 day - 7 weeks
- 1weeks - 1month
- 1 month - 3 months
- 3 month-6 months
- 6 month-12 months
- 1year - 2years
- 2years - 3 years
- 3years - 5years
- 5years - 7years
- 7 years - 10years
- Greater 10years.
Calculate the age of a coin
To calculate the age of a coin using the HODL wave, we make use of the age band color intensity on the HODL wave. Note that the age of a coin is based on the age of UTXO in a transaction.
For example, when BTC is transferred between wallets a UTXO is created, and the time recorded from the last transaction will be used to have the age of the UTXO.
I'm going to divide the chart into two, young and old coins.
Young coin
The young coins cover the area on the HODL wave called Hot Colors(High-intensity Colors). This area represents the newly unmoved coins in relation to the age bands covered in the ranges between 24 hours to 1 year. That will mean the coins fall within the time frame which I mentioned above covered the ranges above.
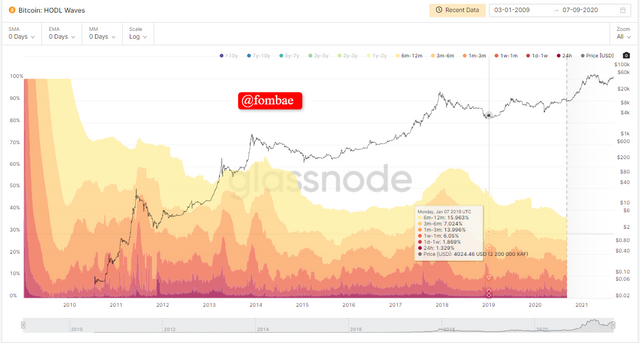 Screenshot Glassnodestudio.com
Old Coins
The Old coins cover the area on the HODL wave called Cool Colors(Low-intensity Colors). This area represents the newly unmoved coins in relation to the age bands covering the ranges between 1yr to 10 years. This area on the chart demonstrates the dominancy of a coin, and which makes such coins tend to peak and get to early bull markets due to their age.
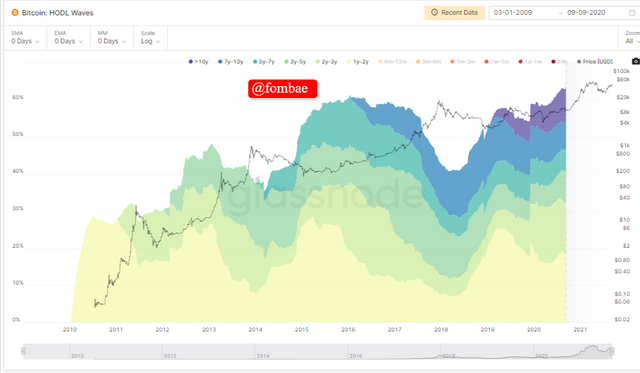 Screenshot Glassnodestudio.com
HODL wave in Bullish Cycle
As I mentioned, the HODL wave demonstrates the ratio between unspent and spent assets in respect to the amount supplied or demand in the market, which then represents the holding or spending of the coin in the market. Note unspent transaction outputs (UTXO), are created when a new transaction is executed. The unspent transaction outputs (UTXO) generate the new age bands, and which are within the ranges of 24 hours to 12 months which then mature as they enter the old age band range.
When the old age band expands, that means more coins are held in wallets without being moved. As I mentioned, UTXO is created when a new transaction is made. So when coins are held in wallets without any transaction, NO UTXO will be spent. It will lead to a low or no supply of the coin in the market during that time frame. This will create a limited supply of the coin, thereby increasing the demand for the coin causing the price to rise. This point will indicate a possible Bullish trend in the mark for the coin in question. At this point, the HODL wave will be indicating a gradual move of the coin into the old coin range with the Low-intensity Colors representation.

Consider the on-chain metrics-- Daily Active Addresses, Transaction Volume, NVT, Exchange Flow Balance & Supply on Exchanges as a percentage of Total Supply, etc, from any reliable source(Santiment, Coinmetrics, etc), and create a fundamental analysis model for any crypto[create a model for both short-term(up to 3 months) & long-term(more than a year) & compare] and determine the price trend (or correlate the data with the price trend)w.r.t. the on-chain metrics? Examples/Analysis/Screenshot?

- Daily Active Addresses
It's the on-chain metrics that indicate the number of active unique BTC addresses on the network during a particular time frame. This matrix is about addresses that have completed a successful transaction on the network be it in sending or receiving. In the chart below, each bar represents a day in a 30 days time frame. I have highlighted a few bars, hover with your consort on any bar will give the details for that day.
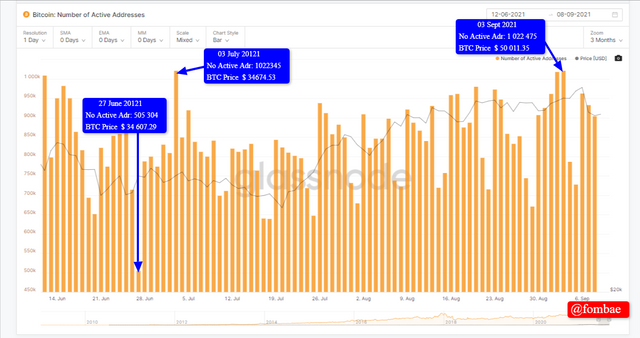 Screenshot Glassnodestudio.com [Short-term (3 months time frame)]
Now let take a look at a longer time frame, and you will see I indicated three arrows, A Band C. The Arrow move up to show that number of active addresses is increasing for arrow A and B. At the same time, we are having an increase in the price of BTC. Well, I added a "B" arrow which is parallel to the movement with time. Here the oscillation is almost neutral, and the number of active addresses does not have a significant difference same as the price of BTC.
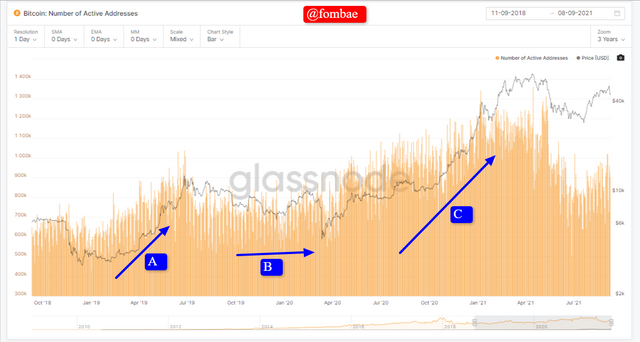 Screenshot Glassnodestudio.com [Long-term (more than a year time frame)]
- Transaction Volume
Transaction Volume on-chain matrix indicates the transaction processes which has to do with the demand and supply of a coin( for example BTC) exchange during a particular duration of time in a network.
Let look at a 03-month time frame Transaction volume for BTC
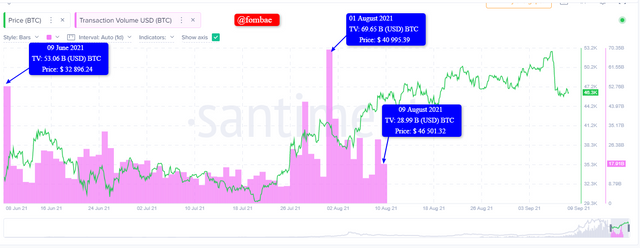 Screenshot Santiment.com [Short-term (3 months time frame)]
From the chart, on 09 June 2021, the Transaction volume of BTC was 53.06B, and BT price at 32 896.24 USD while on the 09 August 2021, the Transaction volume of BTC was 28.99B, and BTC price at 46 501.32 USD. The spick in transactions within the last three months on 01 August 2021 causing a shift in the overall network activity moving Transaction volume to 69.65B.
Longer time frame Transaction volume for BTC
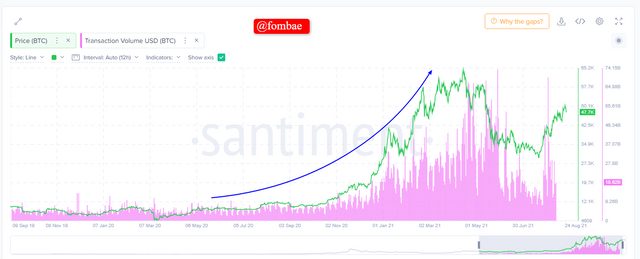 Screenshot Santiment.com [Long-term (more than a year time frame)]
From the chart, you will notice an equal movement between the price and the transaction volume. The changes on the on-chain metrics indicator are mostly spiked by the transaction volume before the actual price follows.
- Network Value to Transaction Ratio (NVT)
The relationship between market cap and transfer volume in terms of ratio is known as the Network Value to Transaction Ratio (NVT). NVT on-chain metrics have the NVT higher reading and the NVT lower reading. The different metric readings can be used to forecast possible signals. A higher reading can indicate a possible fall in price while a lower reading indicates a possible rise in price.
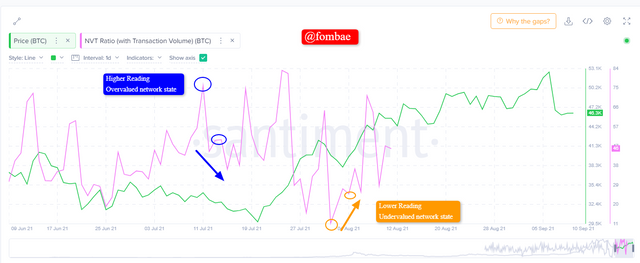 Screenshot Santiment.com [Short-term (3 months time frame)]
You can see a clear illustration of the Higher reading and Lower reading for the price movement. At the Higher Reading the network state is known as been overvalued while at lower reading, it knows as undervalue
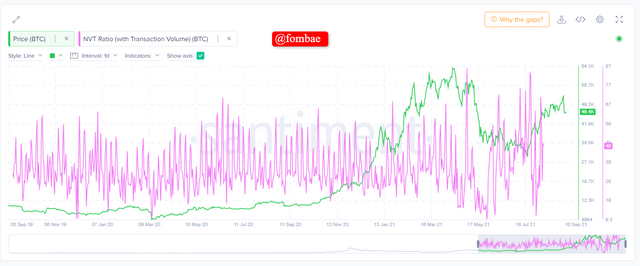 Screenshot Santiment.com [Long-term (more than a year time frame)]
- Exchange Flow Balance
Exchange Flow Balance is the on-chain daily value of a token moving in and out of exchange wallets. If the exchange wallet receives more tokens than sending out, the Exchange Flow Balance value will be positive and vice versa. How it will affect the price of the token will depend if it is a decentralized wallet. It is possible to have a bullish trend if the decentralized wallet receives more of the token from an exchange wallet and causes the token price to rise.
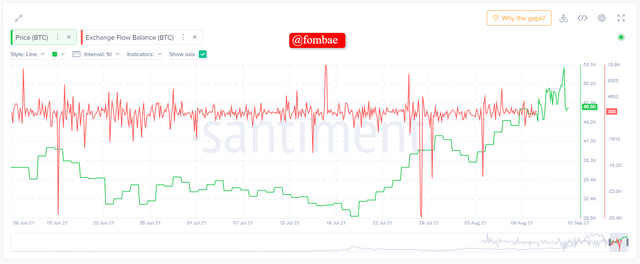 Screenshot Santiment.com [Short-term (3 months time frame)]
With the short-term exchange, it is easy to find yourself in a false market signal when the Exchange Flow Balance value is negative. At that point, you will find the price of BTC falling too.
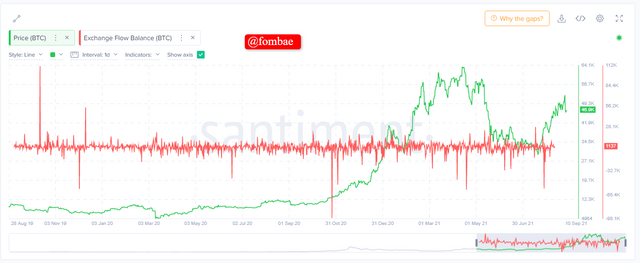 Screenshot Santiment.com [Long-term (more than a year time frame)]
In the long term, you can visibility pick out possibly uptrend signals in the market. As soon as the Exchange Flow Balance value moved from the negative value on the 26 Oct 2020 (-97176.95) to the positive value on the 09 November 2020 (1394.53), BTC price moved from 13K to 15K.
- Supply on Exchange as a percentage of Total Supply
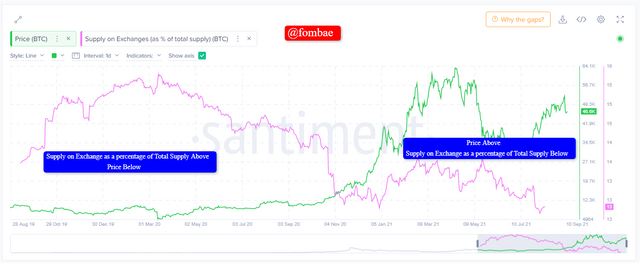
The value of a coin is affected depending on the number of the coin supplied to an exchange wallet. Supply on Exchange as a percentage of Total Supply value increases, the coin price falls. That will mean if an exchange wallet supply is high, the coin price will fall and vice versa.
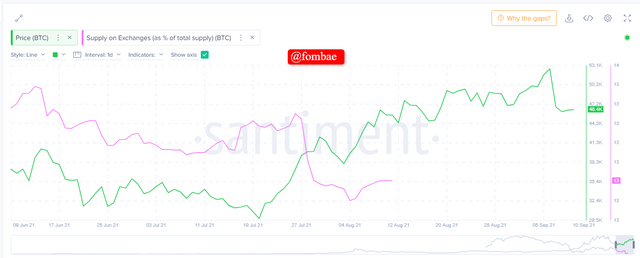 Screenshot Santiment.com [Short-term (3 months time frame)]
We can see on-chain metric indicator movement between the price and supply on exchange as a percentage of total supply on the image. On the 25 June 2021, the Supply on Exchange as a percentage of Total Supply value was 13.51, and drop to 13.28 while BTC price moved from 31.6 K to 45.5K
 Screenshot Santiment.com [Long-term (more than a year time frame)]
Here the chart illustrations are visible in respect to the price and Supply on Exchange as a percentage of Total Supply value. Like as mentioned above, as the Supply on Exchange as a percentage of Total Supply raises, the price falls and vice versa.
On the 14,oct2019, the Supply on Exchange as a percentage of Total Supply value was 15.14, and drop to 13.99 while BTC price moved from 8.3 K to 55.9K

Are the on-chain metrics that you have chosen helpful for short-term or medium-term or long-term (or all)? Are they explicit w.r.t price action? What are its limitations? Examples/Screenshot?

- On-chain Metrics
So far from the analysis above, I will categorically say the short-term scale is not the best approach for on-chain metrics indicators. It will be okay for long-term investments since the signal is visible, and you can miss a false signal without noticing which is an added advantage. This opinion is my opinion. The short term might work for other investors, but to be on the safe side adding other indicators to the on-chain matric.
- Are they explicit w.r.t price action?
The price action depends on the supply and demand of the coin in question. On-chain metrics influence the price movement of a coin following the principle of supply and demand. So the number of buyers and sellers will greatly affect the ratio of demand and supply thereby causing changes in the price movements.
What are its limitations?
Limited Data Information:
As of this date, only Bitcoin has more data as it is the most dominant coin. Other coins have limited data information on the on-chain matrix if trying to use it.
- Possible False Signals
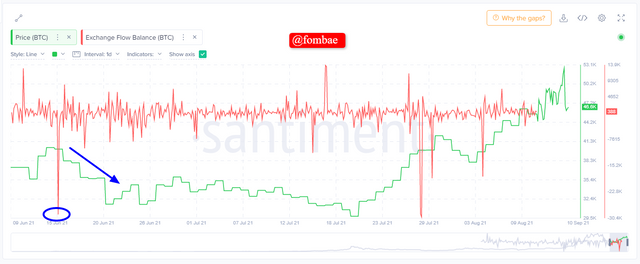
The on-chain metrics signal is unclear when it comes to short-term investing. False signals can lead to huge losses in a market. a clear example can show below
 *Screenshot Santiment.com
They can see from the image where the exchange outflow spiked, and the price continued to fall giving a false signal to a buyer or seller.

Conclusion

On-chain metrics indicators are manipulated by the principle of demand and supply, and which affect the price movement of a coin in the market circle. Looking at applying on-chain matrice indicators, the Long term will be the best option. But I will always think it will all depend on your strategy and which to implement. Try to add other indicators possibly from other platforms to increase the chances of not falling into a false signal. This was a great opportunity for me to have some knowledge of the Onchain metrics indicators.
Thanks @sapwood