
Welcome to another season of trading lessons from the professors, and it has been a long break for me. As the crypto domain has been trending, the been advancement in developing the technology for traders to use. Every trader will want to use the best tools for trading and make more gains.

1.) Define Line charts in your own words and Identify the uses of Line charts.

The line chart is the simplest type of chart that gives a representation of a historical price of assets in a graph-like manner. As mentioned by the prof @dilchamo, it gives a clean and easy-to-understand view to a trader on a chart with a lack of noise to distract decisions. A line chart can be interpreted as that chart that connects closing prices over a specific timeframe. Line charts are just the best tool to reduce noise on the chart and are good for visualization of the overall market trend.
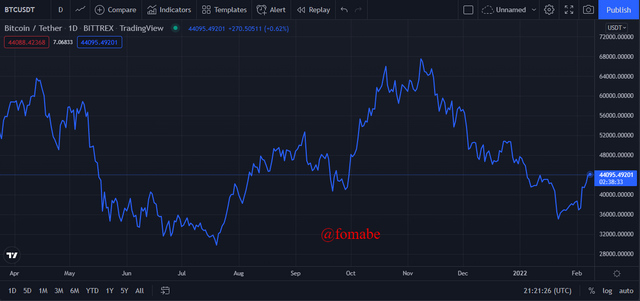 BTCUSDT line Chart (Screenshot from tradingview)
The developer of DOW Theory (Charles DOW) paid attention to the closure of the instrument, as this was the point where he could conclude on the unrealized profit or loss for each day.
Uses
Line Charts can be used as a trendline breakout trading strategy
Trendlines can be identified as straight lines on a graph linking support points for an uptrend and case of a downtrend resistance points. Drawing a trendline is an important tool to be able to view breakouts in a market, to have an accurate trendline, you need at least two points in the market. Identifying swing highs or lows is the strategy to use to draw a trend line. A trendline is an easy tool to use, I will explain more below.
Line Charts can be used to analyze trading patterns
A good number of traders make use of the line chart pattern, which is the most effective trading tool. The purpose of the chart pattern is to identify continuity or reversal signals in the market. As I mentioned, line charts are good tools for the visualization of the market pattern. Traders can make use of the ascending and descending triangle to identify continuation in trend patterns. Another is to pick out possible trend reversals in a market.
Line Charts can be used as a strategy for support and resistance levels.
Only with a good understanding of support and resistance that a trader will be able to have an idea of the next action in the market. The support area is the point in the market where the buying power is strong to stop the assets price from decreasing. A resistance point is when the selling power is strong to stop the price from increasing. So a line chart can be used to spot out support and resistance levels which is the perfect starting point for scalpers(1-Min Scalping).

2.) How to Identify Support and Resistance levels using Line Charts (Demonstrate with screenshots)

I mentioned some aspects of how this level comes about above, support is the point of strong buying, and resistance is the point of strong selling. To be able to identify these levels is very straightforward. Relevant support and resistance levels are based on market swings which are subjective to the horizontal line. We can't say these areas are 100% accurate as the trader will have to approximate and draw the support and resistance lines to identify and connect relevant market highs and lows.
If a trader can identify 3 or more swing points in the market, that will mean that the support or the resistance level is more relevant. I did mention that this strategy can be useful for a 1-min time frame as the support and resistance levels are respected for scalping trading.
Resistance Level Using Line Chart.
As mentioned, it is where we have a strong selling power and a weak buying force from the traders. Here you will identify a swing, and as the market continues to create at least three relevant swings. Then we can confirm the resistance by drawing a straight line to connect the different swing areas. With line charts, the time frame can influence the accuracy of the swing area. So the smaller the time frame, the more accurate this area has been approximated.
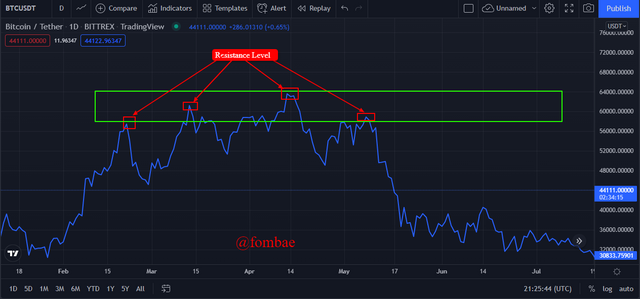 BTCUSDT line chart illustrating resistance levels(Screenshot from tradingview)
Support Level Using Line Chart
It is the area where we have a strong buying power and a weak selling force from the traders. here you will identify a swing, as the market continues and create at least three relevant swings, then we can confirm the support by drawing the straight line to connect the different swing areas
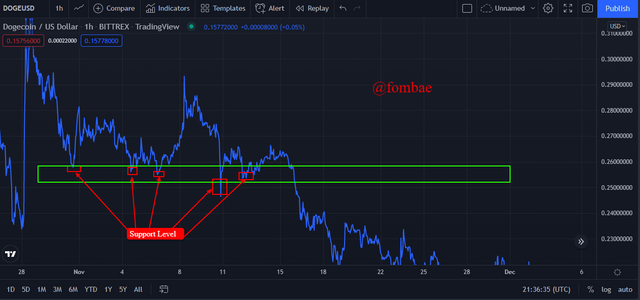 DOGEUSD line chart illustrating support levels (Screenshot from tradingview)

3.) Differentiate between line charts and Candlestick charts. ( Demonstrate with screenshots)

How a trader will be able to interpret a market will depend on how you understand the relations on the graph between the price and the time. There are different methods that a trader can decide to display his or her chart. I will just take us through the difference between line charts and a candlestick chart.
The Line Chart
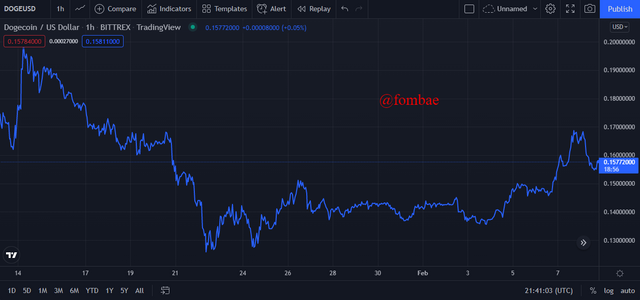 (Screenshot from tradingview)
From my understanding, which I outline above, this chart is the simplest type to understand. Just as we can remember the graph we plotted in secondary school math, we use pencil tips to connect different points. On a trading chart, the points which the line connects are closing prices for each period. Line charts give you the market trend of the current price without any noise or unnecessary data on the chart. Because of this, line charts over the best and quick method of visualization in the market.
Candlestick chart
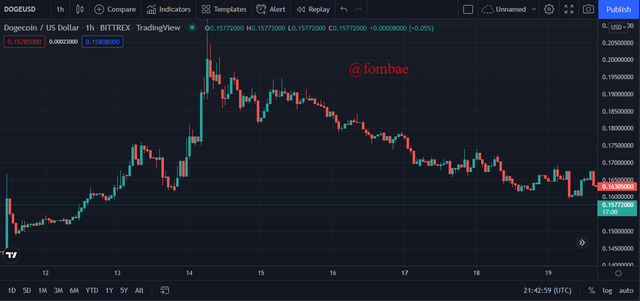 (Screenshot from tradingview)
This chart is made of a candle-like structure that gets its name from the Japanese community, finds traders calling it "Japanese candlestick". I will illustrate that candlesticks are not easy to understand line charts. A single candle is broken into four parts, the opening price, closing price, highest price, and lowest prices within the same period.
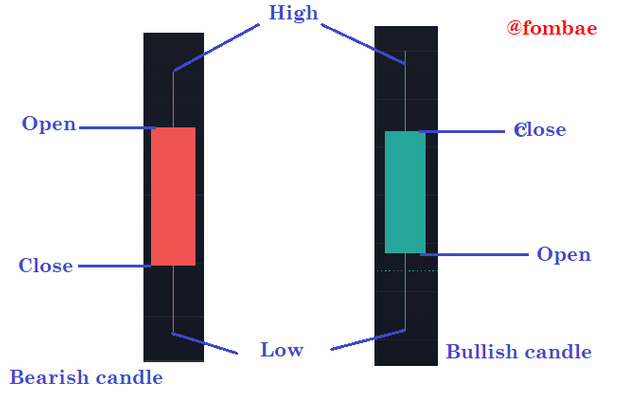
Two types of candles are separated by the color they carry. So apart from the four parts, a candlestick carries a color. These colors can be customized, and you will find red and green on some charts, white and black, and so on. The color is to identify if the candle is a bullish candlestick or a bearish candlestick. Bullish candles form when the closing price is above the opening price, and Bearish candle forms when the closed price is below the opening price.
To conclude, nothing disturbs reading on a line chart compared to the candlestick, which carries too much information. The line chart is just the best method to apply with a high time frame as a trader will not be forced to understand the detail of open and close as found on the candlestick. With line chart cool advantages over candlestick chart, it lacks sophisticated information for advanced technical analysis like the candlestick. Lastly, the line chart does not give information about the volume of the market which candlestick can help to tell.

4.)Explain the other Suitable indicators that can be used with Line charts. (Demonstrate with screenshots)

The best trading strategy is by combining more than one indicator, this is to be able to make accurate decisions in the market. The line chart is not different, I will be adding moving average indicators to the line chart to strengthen the decision I love to take in the market. As explained in the outline by the professor, moving averages help traders in identifying resistance in bearish trends and support in the case of a bullish trend. The best way to utilize moving averages with a line chart is in trend following to identify when the reverse is about to happen.
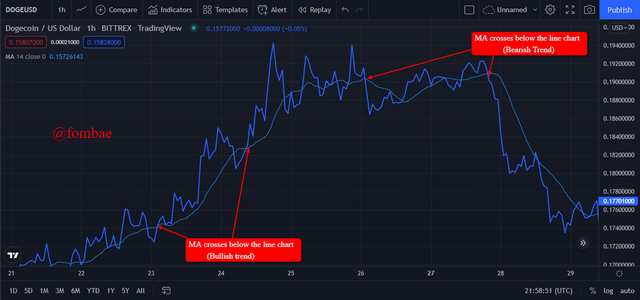 DOGEUSD lins chart combine with MA (Screenshot from tradingview)
From the image above, we can see the moving average indicator moving alongside the line chart while crossing on the line chart depending on the actions of the asset prices. We can see when the moving average moves close to the line chart, a reversal trend is anticipated, and if the moving average eventually crosses, a reversal trend is confirmed.
With these indicators combined, a trader can also identify when the market is in an upward trend or downward trend. When the moving average crosses over the line chart, the market is in a bearish trend, and it is a perfect time for the trader to start anticipating to exit the market to take profit. Vice versa, when the moving average crosses below the line chart, the market is in a bullish trend and a good time to jump into the market.

5.) Prove your Understanding of Bullish and Bearish Trading opportunities using Line charts. (Demonstrate with screenshots)

The trading pattern is the best technique to apply when using a line chart in trading. This pattern can help a trader to understand when the market is in a bullish trend or bearish trend by applying an ascending triangle pattern(bullish) or descending triangle pattern(bearish). These patterns can be applied by a trader to predict future trend signals.
Bullish Trading Signal
Using the Ascending triangle pattern, where the upper trendline is flat, and the lower is rising connect at least more than 3 swings. This partner shows that sellers are weak and buyers are aggressive. Applying an ascending triangle pattern will provide us with a bullish signal. A rise can be initiated as the price approaches the upper trendline and breaks it, and moves over the trendline.
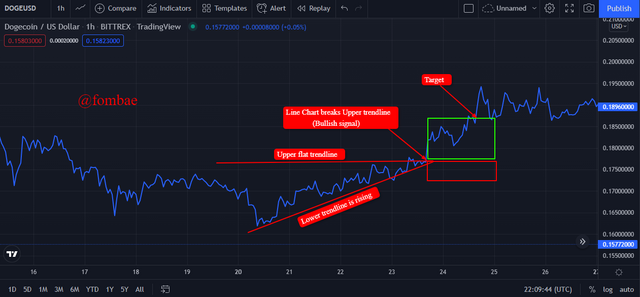 (Screenshot from tradingview)
The image where the two trend lines meet forms an ascending triangle.
Bearish Trading Signal
Using the Descending triangle pattern, on the other hand, we have a descending upper trendline which is connecting at least more than three swings. This pattern shows that buyers are weak and sellers are more aggressive in the market making low highs. applying a descending triangle will provide us with a bearish signal. As the flat lower trendline gets to meet the descending upper trendline. A bearish signal can be confirmed as soon as the line chart moves below the flat lower trendline.
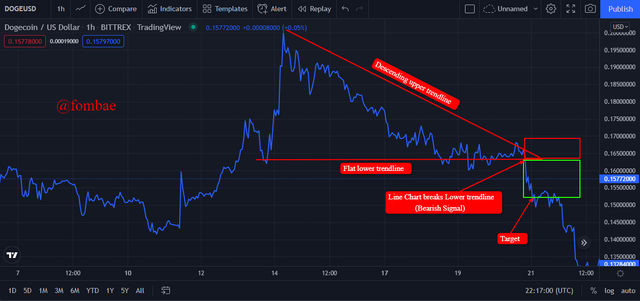 (Screenshot from tradingview)
The image where the two trend lines meet forms a descending triangle, and the market moves below the triangle is showing a bearish trend.

6.) Investigate the Advantages and Disadvantages of Line charts according to your Knowledge.

Advantages - A line chart is easy to interpret.
- Line charts don't have distractive noise in the market
- Line chart overall trend visualization is perfect
- A line chart is a perfect tool to identify support and resistance level
- Line charts give a clear chart pattern to traders.
Disadvantages - A line chart can not be used for advanced analysis as less information detail is given out.
- The absence of opening and closing prices can lead to false signals.
- If time frames are used incorrectly, traders might be faced to make wrong decisions.
Conclusion
To conclude, line charts are easy to interpret but also difficult to apply in day trading. As the chart missed key points which might be very important in sending signals. If you are new to trading, a line chart is recommended for you and does not disturb your brain with too much detail on a candlestick.
hi @fombae please look me and clear my verify my post its about 2 weeks thanks
@fombae here my link
https://steemit.com/hive-172186/@abid940/7gaqcq-achievement-3-task-etiquette-content-by-abid940
Downvoting a post can decrease pending rewards and make it less visible. Common reasons:
Submit
You are only on #club5050 not #club75.
Downvoting a post can decrease pending rewards and make it less visible. Common reasons:
Submit