

1- Define VuManChu Cipher B Indicator in your own words.

VuManChu Cipher B is a combination of different indications for the prediction trading direction in the market. Adding more than one indicator can crow charts making it difficult for traders, to have accurate reading for bullish and bearish market trends. VuManChu Cipher B is a combination of RSI, Market Momentum, Market Volume, and Money Flow on the chart giving the trader more efficient and accurate trading signals.
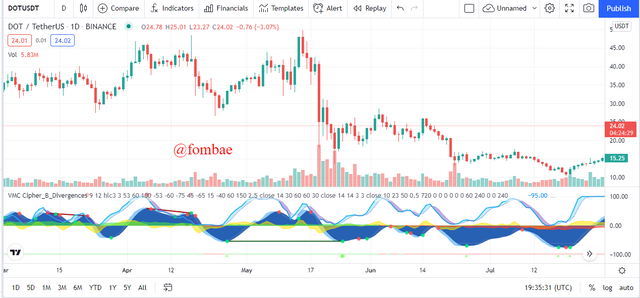 Screenshot TradingView Web platform
VuManChu Cipher B is free to use on the TradingView platform when compared to other marker Cipher indicators. Both Indicators are wave trend indicators with not too many significant differences between the indicators VuManChu Cipher B can be looked at like a trading strategy for advanced traders since the indicator has a combination of more than one indicator. The VuManChu Cipher B has green dots used to pick upward trends and the Blue waves which are used to understand the overbought and oversold states of the market.

2- How to customize the VuManChu Cipher B Indicator according to our requirements? (Screenshots required)

To customize VuManChu Cipher B Indicator I will be following the prof @reddileep outline and using the trading View platform as well.
When I launch the Trading View Web platform, and I click the fx indicator.
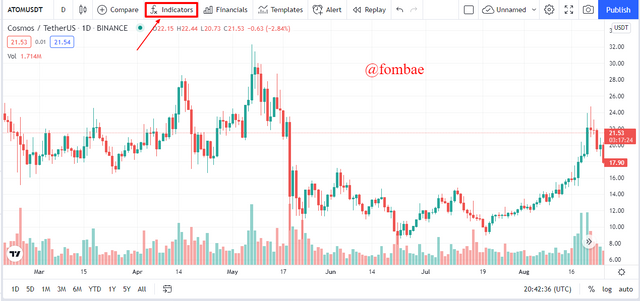 Screenshot TradingView Web platform
The pop-up window will come up with a search bar, and I search " VuManChu Cipher B", related options will show up. I will click on VuManChu Cipher B, and close the window.
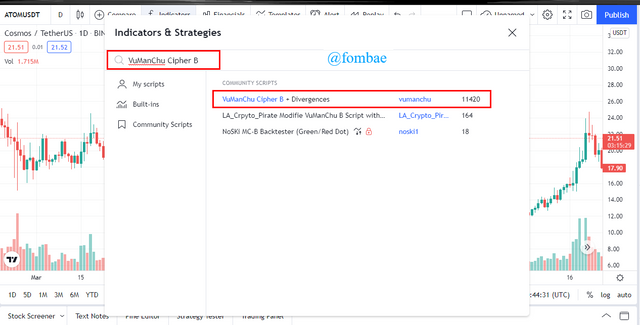 Screenshot TradingView Web platform
Now we can find the VuManChu Cipher B Indicator below the chart, the blue wave, and green dots. Like I mentioned above, understanding VuManChu Cipher B Indicator is not a strategy for beginners.
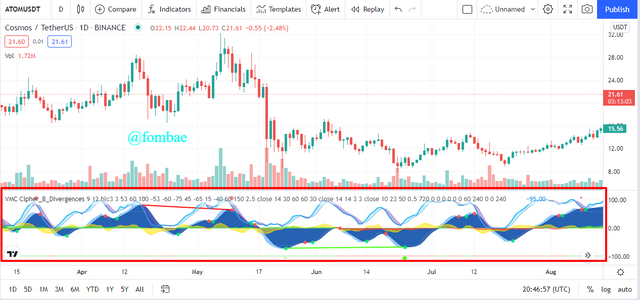 Screenshot TradingView Web platform
Configuration of VuManChu Cipher B Indicator
Close to the VuManChu Cipher B Indicator label on the chart is the setting icon next to the eye icon. Click the setting icon.
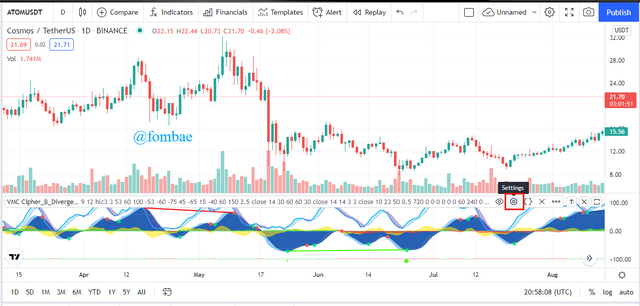 Screenshot TradingView Web platform
The Popup window carried the different tabs for the configurations. The first tab is the input tab, which has different indicators to either be enabled or disabled. Depending on the trader strategy will determine the indicator to be applied. Since we will not be using the Regularly Divergences indicators, I will disable them by unticking the checkbox.
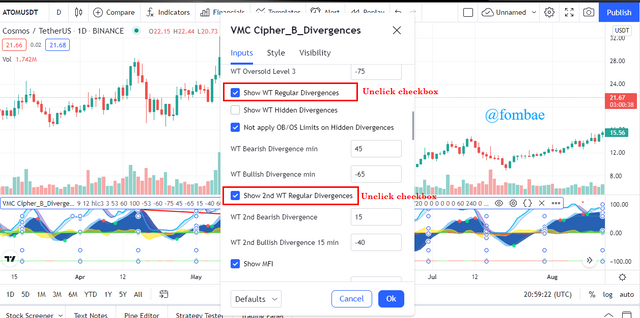 Screenshot TradingView Web platform
We go ahead to unclick the check box for Show Stochastic RSI since we will not be using it. This is to make the chart easier to understand for a trader.
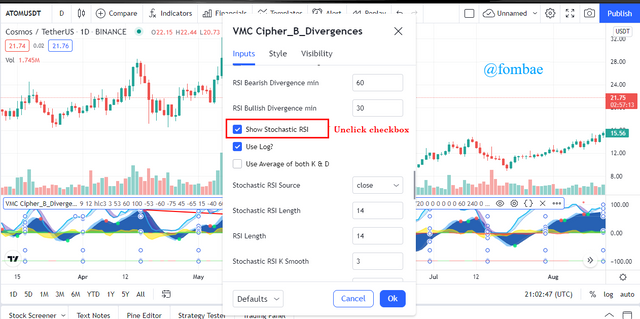 Screenshot TradingView Web platform
The next tab is the style, here color has been applied to the indicators. Since I will not be making use of the yellow Volume Average Price indicator (VWAP), I removed it by clicking the checkbox.
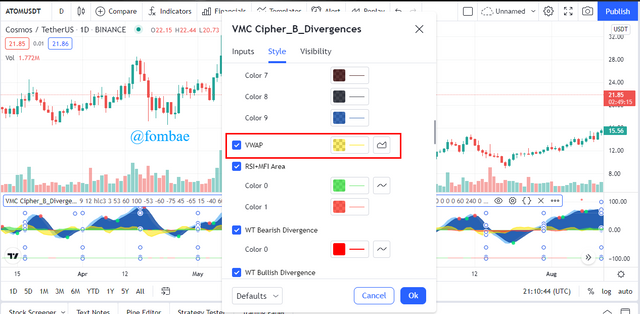 Screenshot TradingView Web platform
On the style tab is the MFI Bar colors Indicator to be removed. I will unclick the checkbox to disable the colors.
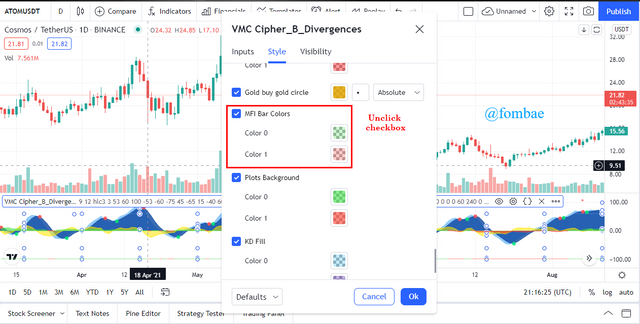 Screenshot TradingView Web platform
Finally, I click Ok to apply the different settings to the chart.
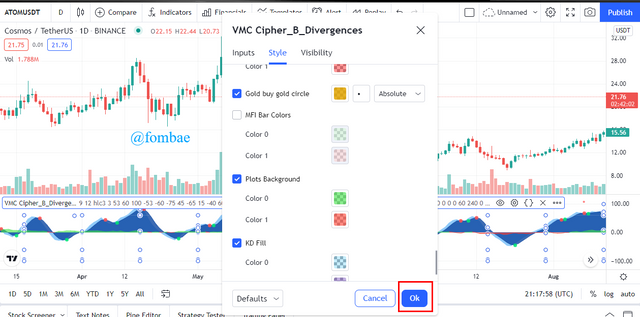 Screenshot TradingView Web platform
Now we have more clear and less complicated indicators on the chart. With this nature, a trading strategy can be easily applied to identify bullish and bearish trends.
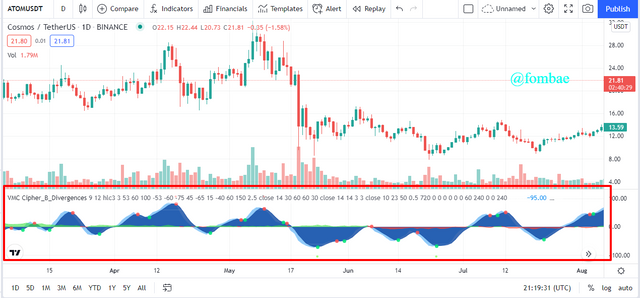 Screenshot TradingView Web platform

3- Explain the appearance of the VuManChu Cipher B Indicator through screenshots. (You should Highlight each important part of this indicator by explaining their purpose)

As I mentioned above, VuManChu Cipher B is a Wave Trends indicator that oscillates between points 100 and -100 on the chart. The wave trend has the general blue color, and which can be categorized in two-wave trend indicators having the Light Blue and the dark blue color. These blue waves signal Overbought and Oversold readings in the market and help to spot divergent price action
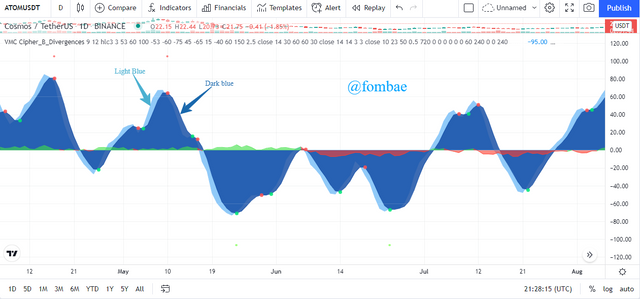 Screenshot TradingView Web platform
The Wave trend divergence at a point represents a dot. These dots can be red and green depending on the current market trend. The green dots signal an upward trend, and the red dots signal a downward trend in the market.
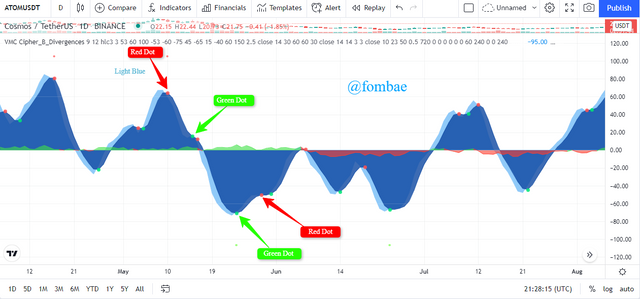 Screenshot TradingView Web platform
Moving on the zero line is the Money Flow Index, which is cloudy in nature. We can notice the cloud in two colors, Red and green. The cloud is Red when the Money is flowing out of the asset due to being Oversold. The green color when the Money is flowing into the asset due to Overbought.
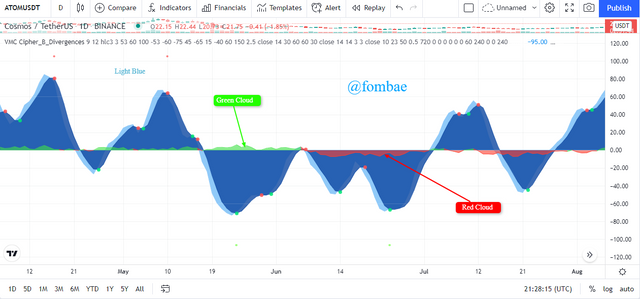 Screenshot TradingView Web platform

4- Demonstrate your preparation for the Trading Strategy combining other indicators. (Instead of showing the addition of indicators to the chart, you should explain the purpose of each indicator for this trading strategy.)

Given that VuManChu Cipher B is a combination of more than one indicator of RSI, Market Momentum, Market Volume, and Money Flow. I will this time add Exponential Moving Average Indicator (EMA) for my trading strategy. following the course outline, I will be adding two EMAs of 200 periods and 55-period Moving Averages
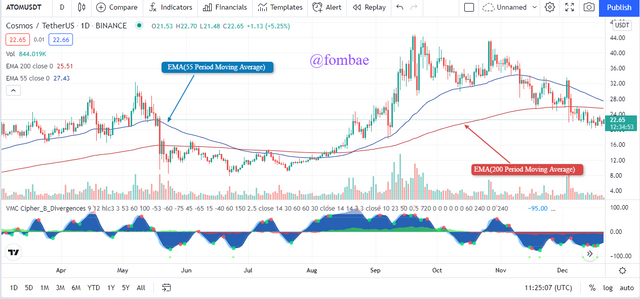 Screenshot TradingView Web platform
200-Period Moving Average
It is a technical indicator for analyzing and identifying long-term market trends since it represents the average closing price for the last 200 days. This indicator is all about adding up closing prices for each of the 200 days and dividing by 200.
Using the strategy can be applied to have accurate support and resistance levels in the market. 200-period Moving Average can aid to identify the strength of trend assets in the market, at this point MA Crossovers are visibly present for the trader to exit or enter a trade.
The 200-period Moving Average is a good tool for trend filters as a trader can look and analyze the current market to place an order for a long-term trade.
55-Period Moving Average
It is a technical indicator for analysis and can be identified as a short-term market trend since it represents the average closing price for the last 55 days when compared to 200 days. This indicator is all about adding up closing prices for each of the 55 days and dividing by 55.
This strategy is cool for swing and short-term traders to predict the exact point to buy and sell on the chart since price changes will react faster on the indicator. With the 55-periods Moving Average, the current market price can be closely followed by the traders.
Crossover is the movement followed by traders when using the Moving average strategy. Appling the 55-period Moving Average and 200 will help in identifying the golden cross (by signal) and Dead cross (sell signal). The Buy signal is spotted when the 55-period Moving Average crosses above the 200 periods Moving Average, and the Sell signal is spotted when the 55-period Moving Average crosses below the 200 periods Moving Average.

5- Graphically explain how to use VuManChu Cipher B Indicator for Successful Trading. (Screenshots required)

I have demonstrated how to add the EMAs (200 and 55period) to any trading chart. I will be using the analysis mentioned above to filter out market trends to identify bullish and bearish trends in the market. I will be using VuManChu Cipher B Indicator to show a successful trade while applying the EMAs in a buy long team entry.
I will be looking at the cross-over between the two EMAs indicators, the cloud on the money flow index, and the dots on the wave trend.
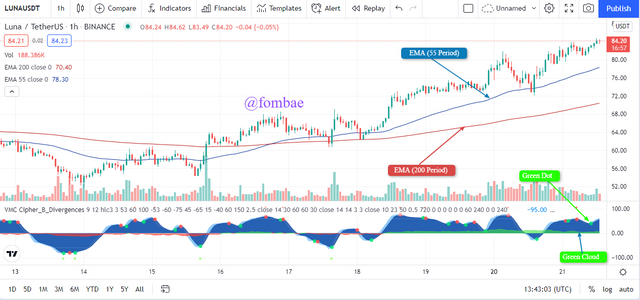
Like I mentioned above, when the 55 EMA crosses above the 200 EMA, it identifies a buying signal. Next, when the Money index flow goes Green, it means money is flowing into the asset and is a signal to enter into a trade. To have the final confirmation, the wave trend crossing each other produces the green dot.
The green dot, combined with the green cloud on the money flow index and the 55 EMA above the 200 EMA is a strong buy long entry signal.
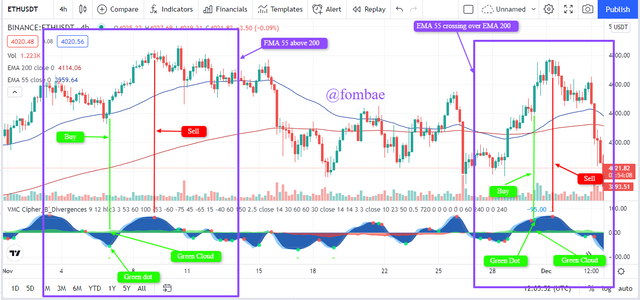 Screenshot TradingView Web platform
From the image above we have two scenarios, cases where the current market already has the EMA 55 above the EMA 200 indicator. The other is where we can identify the crossing movement of the EMA 55 indicator over the EMA 200 indicator.
When the current market has the EMA 55 indicator above the EMA 200, it is a good time to apply for a long entry, as the trader can identify a green dot below the 0 mark amid a green cloudy money flow index.
The second scenario is good for short entry as the trader can get to the market when EMA 55 crosses over EMA 200, a wave trend produces a green dot amid a green cloud on the money flow index. This situation can appear below or above the 0 mark. The profit here is usually small as a trader will have to exit within a short trade.

6- Using the knowledge gained from previous lessons, do a better Technical Analysis combining this trading Strategy and make a real buy or sell order in a verified exchange. (You should demonstrate all the relevant details including entry point, exit point, resistance lines, support lines, or any other trading pattern)

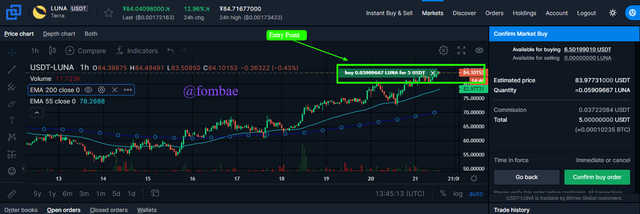
Following the technical analyses mentioned above, I decided to get into the trade. Put all into considerations, as shown on the chart below for the LUNA asset.
 Screenshot TradingView Web platform
I notice in the current market, we have the EMA 55 period above the EMA 200 period, the color of the cloud on the Money flow index has a green color. A few hours ago, we can identify the green dot on the wave trends showing that the market is in a bullish trend. From all this analysis, I placed a buy order to hold the asset (LUNA).
 Screenshot Global Bittrex Web platform
 Screenshot Global Bittrex Web platform
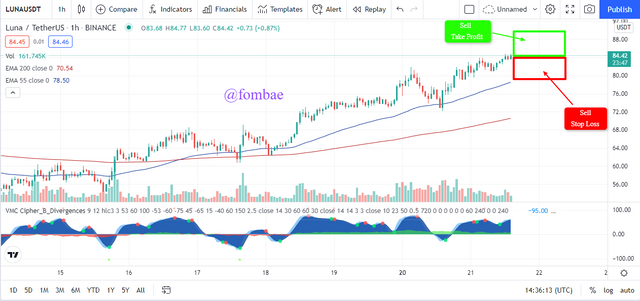
I will be monitoring the chart, spotting the red dot to place a sell order in order to take profit.
 Screenshot TradingView Web platform
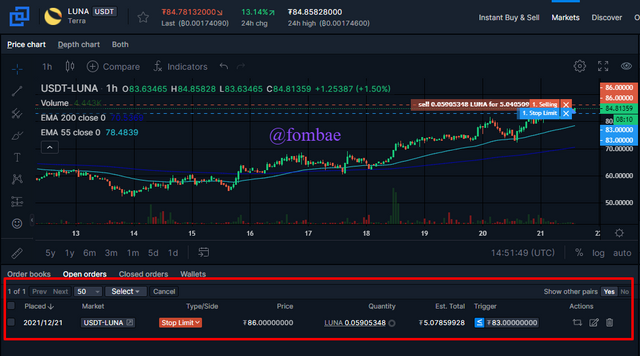
In order not to stay on watching the market, I can set a stop-limit order. From the chart below, I set my selling order, estimating take profit and stop ratio at 2: 1.
 Screenshot Global Bittrex Web platform
 Screenshot Global Bittrex Web platform
Now I will not border myself following the current trend of the market as the stop limit will take care of my trade set.

Conclusion

VuManChu Cipher B can be seen as an all-in-one oscillation of more than one indicator on a 0 axis line between 100 and -100 points. The indicator formed wave trends with green dots giving strong signals for a bullish market trend and a future extreme sellers momentum which is the red dot. Adding Moving average indicators to VuManChu Cipher B helps traders to be able to predict accurate market trends. Moving Average indicators are popular technical analysis, and applying a 200-period indicator makes it a more significant psychological level. When the 55-periods stay above the 200-period indicator, and a green dot is identified below the 0 mark amid a green cloud on the money flow index. It is a good signal for a long-term entry. A short team entry can be predicted when the 55 period just crosses over the 200-period indicator. The green dot can be in any direction hoping the money flow index holds a green cloud. It has been a course, thanks prof @reddileep, im hoping to have more understanding of the VuManChu Cipher B indicator as time goes,
ভাইয়া আমি আমার Achievement 2 পূরণ করেছি। কিন্তু verified করা হয়নি।৭ দিন pending এ পড়ে আছে। দয়া করে Achievement 2 verified করে দিন।
https://steemit.com/hive-172186/@mdmamun001/achievement-2-task-by-mdmamun001-or-or-basic-security-on-steem-blockchain-or-or-date-15-12-2021
Downvoting a post can decrease pending rewards and make it less visible. Common reasons:
Submit
https://steemit.com/hive-172186/@mehrbanjan/achivement1-introduce-my-self-by-mehrbanjan.
Verifiy my post plz.
Downvoting a post can decrease pending rewards and make it less visible. Common reasons:
Submit
Achievement1 Introduce Myself by @aliraza01
Plz verify my post
Downvoting a post can decrease pending rewards and make it less visible. Common reasons:
Submit