

Good day wonderful people pf the SteemitCryptoAcademy Community! This is my first time attempting a beginners homework on the the community and I am glad to have qualified owing to the fact that i have met all requirements needed for me to participate in this lecture and homework.
This wonderful lecture, a job well done by the amiable professor @sachin08, has given me a lot of insights on understanding wedge patterns in the course of trading and its application. Below, I have provided detailed answers to the questions which were given as homework exercise to lecture.

(1) Explain Wedge Pattern in your own word.
(2) Explain both types of Wedges and How to identify them in detail. (Screenshots required)
(3) Do the breakout of these Wedge Patterns produce False Signals sometimes? If yes, then Explain how to filter out these False signals.
(4) Show full trade setup using this pattern for both types of Wedges.( Entry Point, Take Profit, Stop Loss, Breakout)
(5)Conclusion

Wedge Pattern is a technical chart representation or formation that shows or portrays price range and changes over time. It can be utilized as a technical tool for predicting the advancement of the market either in bearish movement or in bullish movement.
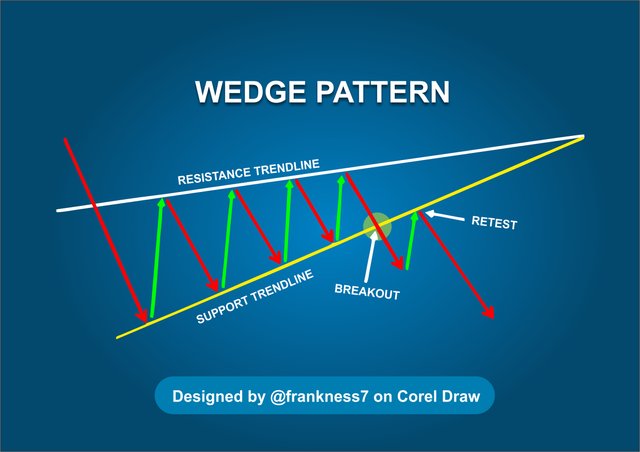
The wedge pattern is made up of converging trendlines which a drawn in a bid to make a wedge and hence, we call it a wedge pattern. Wedges are viewed generally as a reversal pattern in which the price of a tradable will reverse itself once the pattern has been confirmed. The wedge pattern are likely to occur at the mid of the trend or at the top of the trend, forming the wedge pattern, after which traders are to make an entry or exit the trade by taking profit as prices take a reversal move after the formation of the wedge pattern.
Below is a pictorial illustration to further explain the concept of a wedge pattern.
According to the comprehensive lecture, there are two types of wedge patterns which are the Rising or Ascending Wedge Pattern and the Falling or Descending Wedge Pattern (Both of which i will be extensively explaining in the next question below)

Prior to the explanations given by the Professor from the lecture, it is clearly noted that there are two types of wedge patterns which he taught us. They are;
- The Rising Wedge Pattern
- The Falling Wedge Pattern
From further research, i also found out that both wedge patterns listed above could also be called, The Ascending and Descending Wedge Patterns.

The Rising Wedge Pattern can also be known as the Ascending Wedge Pattern. It is formed as a resultant effect of of the combination of prices between the converging trendlines. The rising wedge pattern is also termed as a bearish form of wedge pattern and this because, after the this pattern there comes a downtrend and prices will move in a downward way or path after a breakout.
Below is a screenshot image showing an example of the rising wedge.
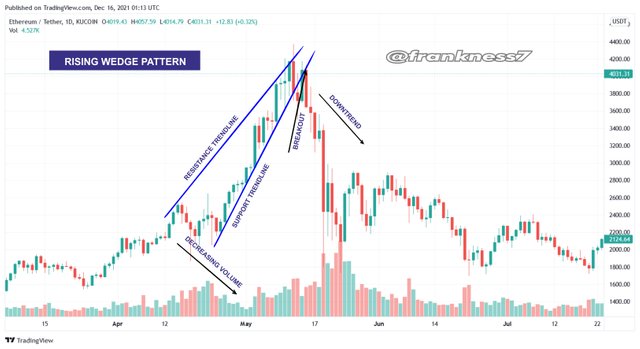
The rising wedge pattern is characterized by a narrowing price channel with both the resistance and support levels ascending or pointing upward to the right corner. After a rising wedge is formed or created, the price will usually break out of the support to enter a downward movement or downtrend.

Being that Rising Wedges are not easy to the identify, the Professor has taught us some very good fundamental features to apply in other to identify this wedge pattern. These features are stated and explained below;
| Features | Explanations |
|---|---|
| The Up-slope Trendlines | Two up-sloping lines are to be precisely drawn. One to be drawn along the upper resistance line while the other to be drawn along the support line and both are to be converging or intersecting at the steepest points (at the top). |
| Numerous Touches | The rising wedge pattern should have numerous or many touches or nodes at both upper and lower trendlines. A least of five (5) touches should be observed on the wedge pattern i.e three (3) on one trendline and 2 on the other trendline. |
| Volume Direction/ Pathway | In the rising wedge, volume usually inclines downward or move downwards as price increases abruptly till there is a breakout and price reversal gets ready to occur. |
| Breakout Volume | The breakout volume is usually below average but it could also appear or result to be heavy or result to be light. |

Falling Wedge basically forms at the end or base of downtrend and this results in the commencement of an uptrend which is termed or defined as a reversal. It can also be called the descending wedge pattern.
Below is a screenshot image showing an example of the falling wedge.
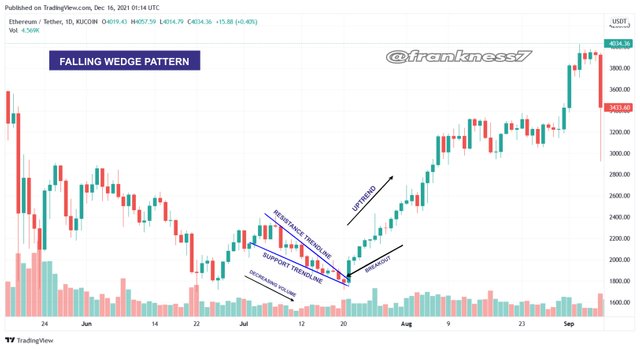
Literally looking at the falling wedge, the price pattern appears to be bearish but in the actual sense, it is not bearish but bullish as it is aimed at starting another bullish uptrend.

The following are notable features with which we can determine the presence or occurrence of a falling wedge pattern.
| Features | Explanations |
|---|---|
| The Down-slope Trendlines | Two Down-sloping lines are to be precisely drawn. One to be drawn along the upper resistance line while the other to be drawn along the support line and both are to be converge or intersect at the steepest points (at the bottom). |
| Numerous Touches | The falling wedge pattern should have numerous or many touches at both upper and lower trendlines. A least of five (5) touches should be observed on the wedge pattern i.e three (3) on one trendline and 2 on the other trendline respectively. |
| Volume Direction/ Pathway | Here In the falling wedge pattern, volume usually declines downward or trend downwards. |

The breakout of these wedge patterns produces false signals sometimes. For instance in a rising wedge pattern that is supposed to be a bearish wedge pattern, we might find out that instead of the price chart to follow a downtrend after a breakout point close to the converging point of the wedge, we now suddenly observe an unusual upsurge of price uptrend which can actually lead to a disappointment to technical analysis of traders who don't or were not expecting such an abrupt change in price trend.
Below is a screenshot image depicting an unusual false signal developed from a certain rising wedge pattern that clearly acted in reverse to the normal trend which was suppose to accompany the rising wedge pattern (i.e. the usual downtrend in price).
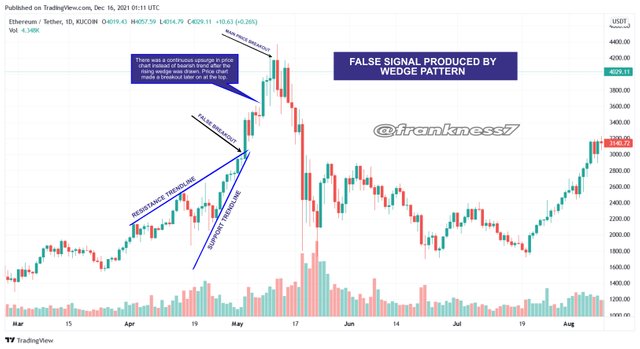
The above screenshot image shows the exact deviation from the principle of the rising wedge pattern thus, viewed to have created a false signal about the price chart. We can observe that the after the breakout point, there was no price reversal and instead, the price continued to go up in an uptrend direction. This usually causes a surprising experience to new traders who may have not understood the threat that this false signals can produce when not carefully understood or quickly noted.

I am going to apply my knowledge of the wedge patterns that i have learnt from the comprehensive lecture to work in the screenshots below.
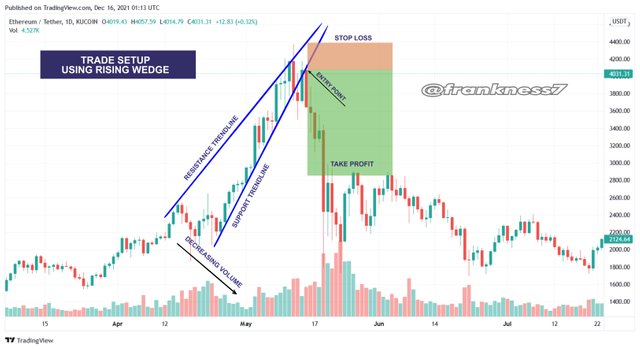
From the above screenshot image, We can vividly observe that the Rising Wedge has been formed from touching both trendlines (i.e the upper resistance line and the lower support line) which when it cuts across or breaks the Support line, We then assume that point to be our entry point (i.e the point where we choose to throw in our money or invest in the commodity) and then We can mark out our Take Profit level and Stop loss level slightly over the tip of the wedge or the resistance line.

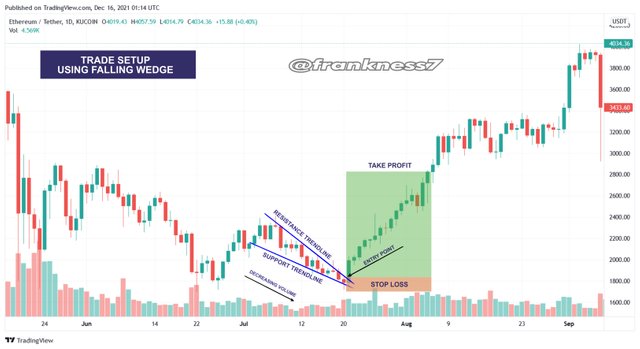
From the above screenshot image, We can vividly observe that a Falling Wedge has originated which is extensively touching the two trendlines (Resistance line and Support line). The point at which it breaks the Resistance line is termed our entry point where we can make an entry then, We can note the Take Profit level and then Stop loss level rightbelow the tip of the wedge or below the Support line (lower trendline).

This comprehensive lecture meticulously compiled and elaborately explained by The Amiable Professor @sachin08 has given me great insight on the subject of understanding wedge pattern signals in the course of trading. I have learnt good basics on the importance of knowing how to understand the movement of price charts or trends of price charts in other to achieve an effective and successful trade by the application of these wonderful wedge patterns.
I acknowledge you all for reading through and also thank Professor @sachin08 as i look forward to partake in your next lectures and homework activities.
I captured all screenshots from Tradingview.com and were edited by me on the Corel draw Software for easier and further elaboration