Introduction
It's an honor to be here again at this moment of the day to attend the lecture from professor @yohan2on where the professor lectured on The Swing Trading Style. The lecture is with no doubt a great one and I am glad I've learned something such that I can attend to the task given by the professor. Join me as I walk you through the process of solving the task.
Introduction to the Swing Trading Style
In simple words, the swing trading style in cryptocurrency is a trading strategy employed by traders/investors to take advantage of a market trend for making some profits from it. In the process, different supports and resistance are drawn to project the entry/exit area on the assets' chart pattern in different time-frames; Monthly, Weekly, Daily, 4 hrs, and 1 hr.
The drawn supports and resistance are used for decision making as regards when to enter or exit a crypto asset's market. With the help of technical indicators on the chart pattern, traders can easily carry out analysis before making an investment decision. Although, some traders also employ fundamental analysis in this trading strategy but mostly, traders stick to the technical analysis to effectively manage their time.
DOGE/USDT Trading Pair
I will be using the DOGE/USDT market to make a trading/investment plan. DOGECOIN has experienced a good market uptrend over the last few months which has its value appreciated in the crypto space before the market falls and that interests me to see how I can set up a proper trading plan to make some profit for myself from the market.
For this purpose, I will be exploring the DOGE/USDT chart pattern with multiple time frame analysis on TradingView mobile application to check on the past price behavior of the asset over time.
DOGE/USDT- Weekly Time-Frame
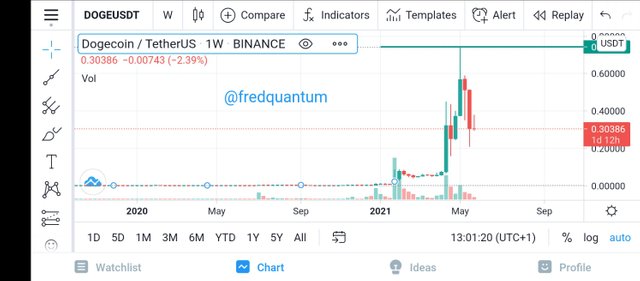
DOGE/USDT- Weekly time-frame
From the chart pattern of the DOGE/USDT trading pair shown above, it is evident that the pair has experienced a huge uptrend over the last few months before up to a value of 0.74 USDT before having a strong fall which puts the market in a bearish trend as seen from the weekly time-frame chart above. Note: The chart pattern of DOGE/USDT on a weekly time frame shows that the asset is in a bearish trend at the moment.
DOGE/USDT- Daily Time-Frame
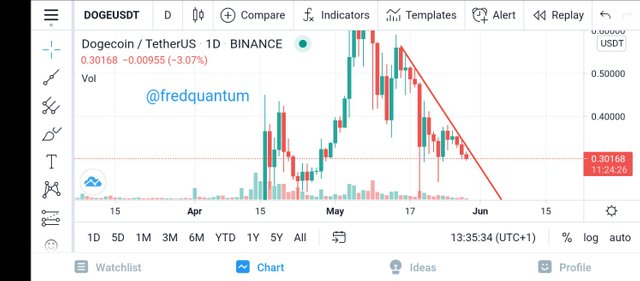
DOGE/USDT- Daily time-frame
Also, from the above daily time-frame chart pattern of the asset, it's still on a downtrend considering the price behavior over the last few days.
DOGE/USDT- 4-hourly Time-Frame
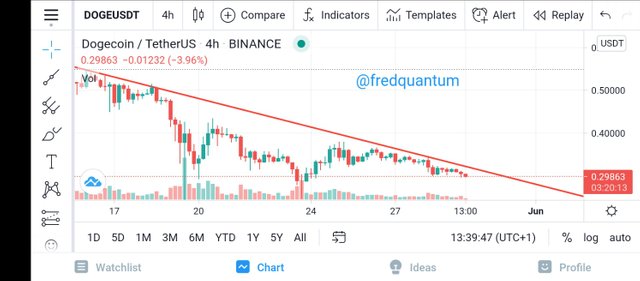
DOGE/USDT- 4-hourly time-frame
The downtrend persists in the 4 hrs time-frame chart pattern of the asset above. let's see my last time frame (1 hr time-frame) and deduce some facts.
DOGE/USDT- 1 hr Time-Frame
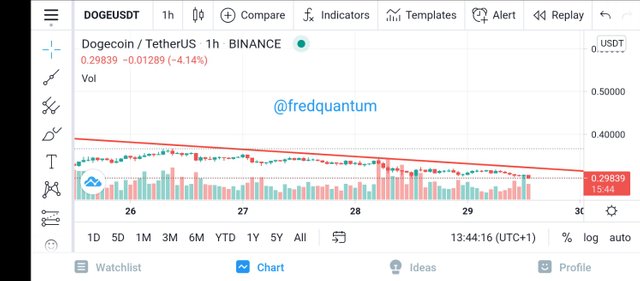
DOGE/USDT- 1 hr time-frame
As revealed by the 1 hr time-frame above, the chart pattern at 1 hr also revealed the asset is in a downtrend although with slight supports but no major trend reversal is seen.
Candlestick analysis and use of other relevant supporting indicators for your trade decision.
Now, I will be analyzing the DOGE/USDT market and note every point of supports to decide when to enter a trade and the resistance to mark my take profit levels. The SuperTrend technical indicator would also be used to support my analysis. I will kick start this from the weekly time frame to have an overview of what has happened in the market.
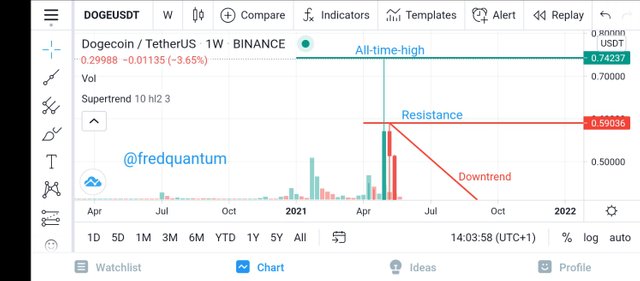
On a weekly time-frame chart above, the asset attained an all-time high of 0.74 USDT before the asset massively moved downtrend. Let's explore the 4-hourly chart pattern below to see the actions that took place with our SuperTrend technical Indicator setup.
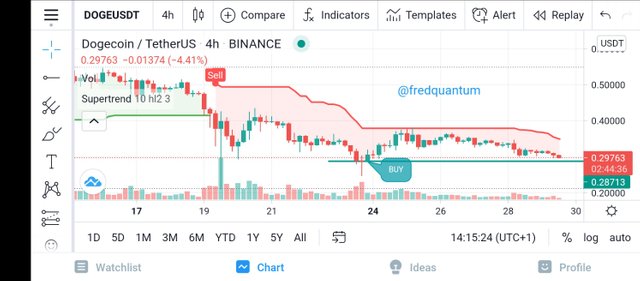
The 4-hourly chart pattern above shows that the market has been extremely bearish and the SuperTrend can hardly give a signal. At the bottom, I marked out support for buy at 0.28 USDT which occurred on the 23rd of this month, while the asset is currently trading at 0.298 USDT, and set that as my buy area as I expect a trend reversal at the point. Let's proceed.
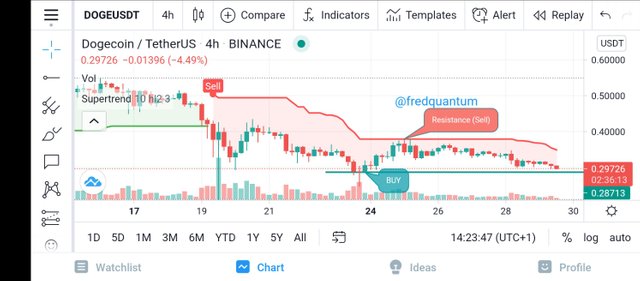
I marked out a resistance line at the price of 0.38 USDT, my resistance co-existed with the SuperTrend resistance line and this could be my taking profit level 1. Let's go further.
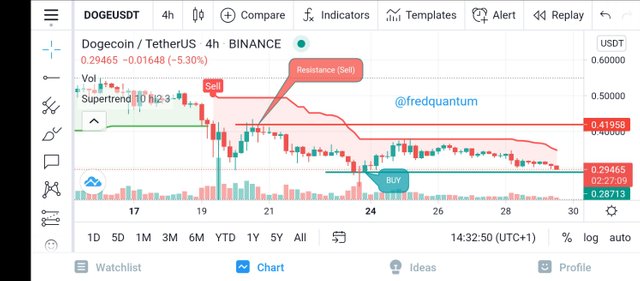
Provided there is a price breakout at 0.38 USDT (my first profit level) then I can make the resistance line at 0.42 USDT as my second profit level. Let's see one more chart.
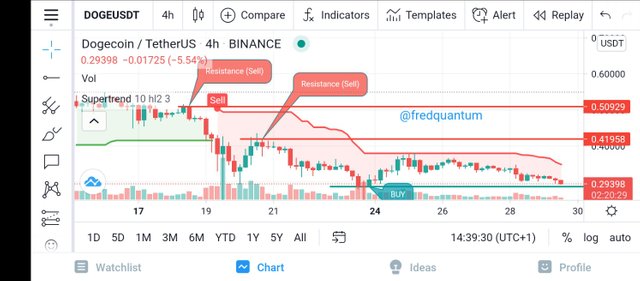
From the above, if we further experience a bullish trend in the market (DOGE/USDT), my third profit level would be at 0.50 USDT on the support line I drew out that nearly co-existed with the SuperTrend resistance line.
Stop Loss
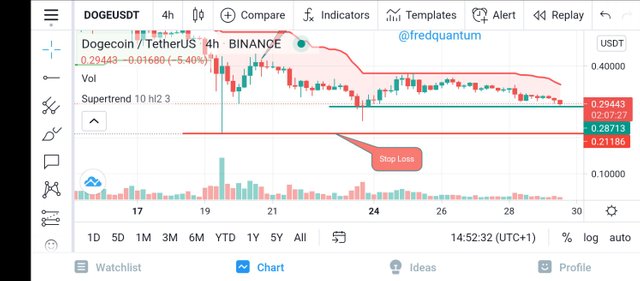
If the DOGE/USDT market goes uptrend from my chart analysis from the point of purchase at 0.28 USDT but falls back shortly and breaks my support of the purchase. Then, a stop-loss has been put in place to control my loss and the support line at 0.21 USDT would be the Stop loss.
Trade management ( Setting stop loss, trailing stop and take profit)
My point of entry in the analysis is 0.28 USDT having the first profit level to be 0.298 USDT, and 0.3801 USDT as the second profit level. Going further, if there is a resistance breakout then my third profit level would be 0.50 USDT. As it is very important to effectively manage resources and not get carried away, my stop loss was picked at a support line below my purchase line, having the stop loss to be 0.21 USDT.

In conclusion, swing trading style is useful for both short term and long term traders to effectively plan their investment and as such allows them to set their profit levels with stop loss well equipped to focus on other things. Thanks to professor @yohan2on for this yet another great lecture. Thank you, all.

Written by;
@fredquantum
Hello @fredquantum,
Thank you for participating in the 7th Week Crypto Course in its second season and for your efforts to complete the suggested tasks, you deserve a 10/10 rating, according to the following scale:
My review :
An article with excellent content, you dealt with the topic accurately and clearly in all its aspects. Your use of the SuperTrend Analysis Indicator enables you to extract many important signals when trading.
Thanks again for your effort, and we look forward to reading your next work.
Sincerely,@kouba01
Downvoting a post can decrease pending rewards and make it less visible. Common reasons:
Submit
Thanks for the review professor @kouba01, it's an honour to take part in this lecture.
Downvoting a post can decrease pending rewards and make it less visible. Common reasons:
Submit