Introduction
I'm glad to be at the academy again at this moment of the day to learn more about cryptocurrency, thanks to the crypto professors for their great works at the academy which is aiding the progression of the students' knowledge in the crypto ecosystem. I have attended the lecture presented by professor @asaj which is centered on Vortex Indicator, it's a great lecture and I am glad that attended the lecture. I will be using this article to solve the task given by the professor.
Designed in Canva using a Free image- Image source
1. What is the Vortex Indicator?
Vortex indicator is a technical indicator that is one of the tools used in the technical analysis of crypto markets and other stock markets. It is an invention of Etienne Botes and Douglas Siepman which came into existence in the year 2010 and it is a development on the earliest works of the Market technician known as J. Welles Wilder. Vortex indicator is used on the chart pattern of assets to identify trend reversals or trend continuation, as the case may be.
The Vortex indicator comprises of two lines which are; Positive movement line (+VI) and Negative Movement line (-VI). The movement of these lines over time indicates a probable trend reversal or the continuation of an existing trend and it's easily used to predict the next price behavior of an asset with buy/sell signals when an intersection exists.
The colors of the positive line (+VI) and negative line (-VI) doesn't have a standard as it can be set to users' preference for easy identification of the movement over time. In short, the Vortex indicator is used to identify trend reversal or trend continuation on the chart pattern of an asset over time. Let's see how it works in the next section. See fig. 1 below
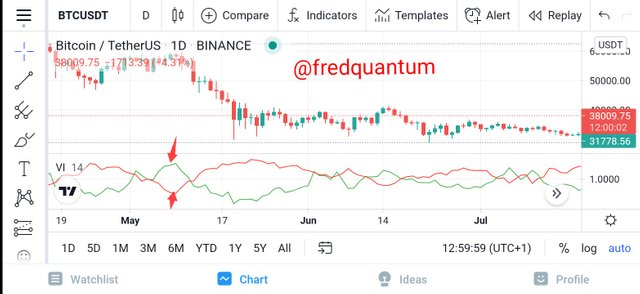
Fig. 1: VI trend lines (Green for +VI and Red for -VI)
How does the Vortex Indicator Works?
The vortex indicator takes into consideration the distance between the highs and lows of an asset over time according to the time frame chosen on the chart pattern and the representation of the calculation results in the movement of the lines (+VI and -VI).
Take, for instance, I customize my +VI to be green and -VI to be red, the distance between the current high and previous low periods results in a positive movement of the asset's price in question with the +VI moving in the upward direction while the distance between the previous period high and the current period low results in a negative movement of the asset's price with the -VI moving in the downward direction.
I stated earlier that it gives buy/sell signals and this is done when there exist the crossing over of the indicators line, for instance, if +VI crosses above the -VI, that implies a buy signal and if -VI crosses above the +VI, that implies a sell signal.
Vortex Indicator Calculation
I will be discussing this section of the task under a few calculation steps.
Trend Determine: This is done by calculating the distance between the previous period highs and lows and the current period highs and lows. As such, the length between the current high and the previous low gives a positive movement then the trend line +VI is winning which implies an upward movement of the asset and a good indication to buy. And if the current period low occurs after a previous period high then the result is negative movement which implies downward movement of the asset and a good indication to sell.
Period: Period can also be termed the length to which an analyst based his analysis on. There is no standard length, a user can choose a length that best suit his analysis which could be; 14, 26, 50 and so on and what this means is the period in Hours/Days/Weeks and so on, according to the time frame chosen. Therefore, the calculation for 14 periods would be; +VI14 = 14 periods sum of +VI and -VI14 = 14 periods sum of -VI. Like I stated earlier, there is no standard for periods, a user can choose any length of choice but research shows that 14 periods give more accurate results.
True Range: True range is calculated through the following; The current high minus the current low, the current high minus the previous close and the current low minus the previous close.

2. Is the Vortex Indicator Reliable?
Generally, technical indicators are not always accurate or we can say, they are not 100% accurate as they tend to give false signals that can be misleading, the Vortex Indicator isn't an exception to this fact. Vortex indicator gives many good signals through its trend lines movement and crossing over to enable an analyst to identify a trend reversal or a continued movement.
Research shows that the vortex indicator is a good technical indicator that gives reliable signals as long as the user utilizes it the right way but the result varies under certain conditions. For instance, using the vortex indicator at smaller periods tends to give many buy and sell signals through crossing overs with no clear trend movement while using it at higher periods has delayed crossing overs but with a clear trend movement when it does.
In addition, technical indicators can be used in combination with other tools to confirm signals, as such it is recommended to use the Vortex indicator with the MACD (Moving Average Convergence Divergence) as it would enhance the reliability of the Vortex indicator signals. If the vortex indicator gives an identical signal with the MACD then this confirms the originality of the signal given, although, the two might not give the signal at the same time, a close time to each other.

3. How to add Vortex indicator on Chart and the recommended parameters
For this section of the task, I will using the TradingView App to access the chart of assets. The steps involved would be listed below.
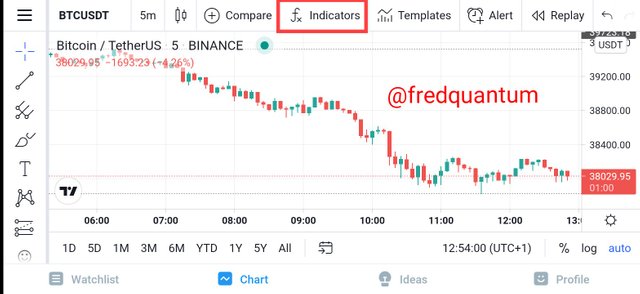
Fig. 2: Select indicators
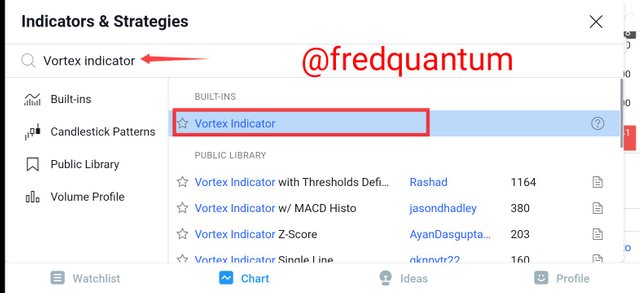
Fig. 3: Vortex indicator search
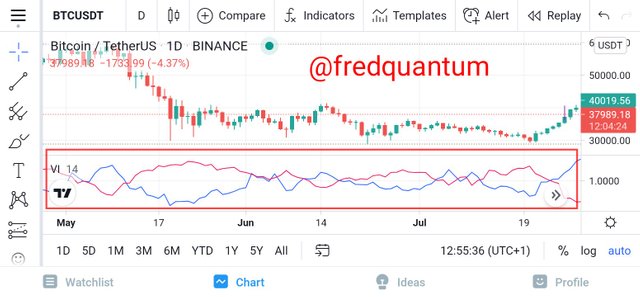
Fig. 4: Vortex Indicator on the Chart
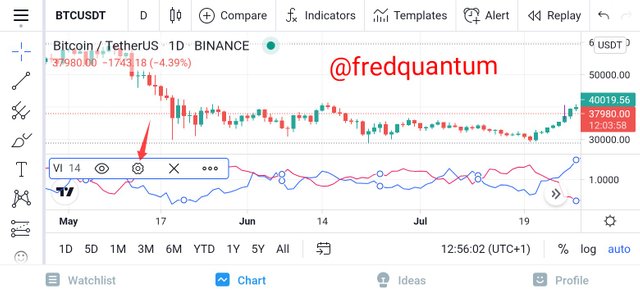
Fig. 5: VI- Settings
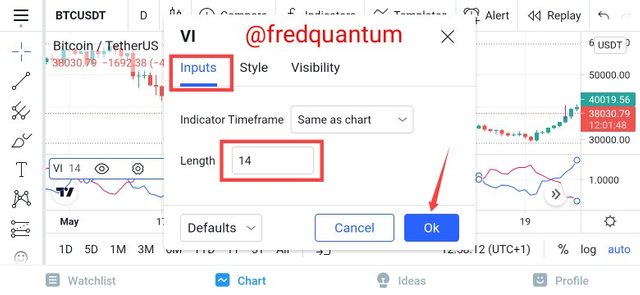
Fig. 6: VI- Inputs
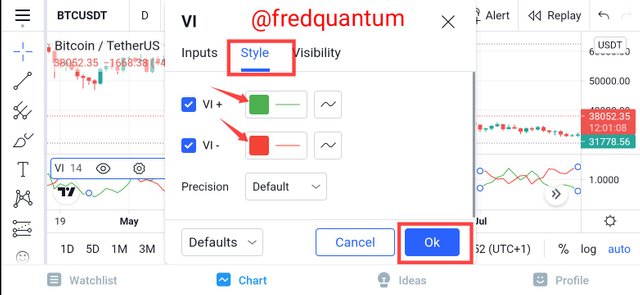
Fig. 7: VI- Style
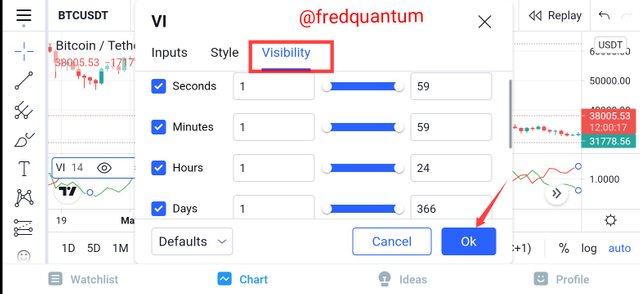
Fig. 8: VI- Visibility
I have been able to complete the configuration and you can see the colors for my +VI and -VI to be green and red respectively. See fig. 9 below

Fig. 9: Vortex indicator
Recommended Parameters
The recommended parameters for the Vortex indicator would be discussed below.
Length: Length parameters is 14 at default which implies 14 periods which could be (14days, 14weeks, 14 months and so on), according to the time frame on the chart. Research shows that, 14 periods gives more accurate signals and is recommended to be kept at 14 such that I keep the length settings at 14.
Chart's time frame: When I was explaining the accuracy of the Vortex indicator earlier, I explained that at shorter time frames, there is a tendency to get many buy/sell signals which don't turn out to be true as such, if you are using the same as chart on the settings of VI, it is recommended to use higher time frames on the chart.
Visibility: Visibility settings is recommended to be kept at the default. Altering the visibility settings might brings up some kind of confusion during analysis and I kept it at default.
+VI and -VI colors: No special rules are guiding the default color to be used for identifying the duo of +VI and -VI but it is recommended to use a color that is easy for a user to identify and not identical colors for both as it can bring up confusion when trying to identify the trend as indicated by Vortex indicator.

4. The Concept of Vortex Indicator Divergence
There exist both bullish and bearish divergence when we talk about the Vortex indicator, both of which would be discussed in this section of the task.
Vortex Indicator Bullish Divergence
In the use of Vortex indicator, there exist a bullish divergence when an asset has been in a bearish state for some time and as such, form another low which is interpreted as a lower low but the +VI oscillating line forms a higher low. This is an indication of a trend reversal ahead, meaning the downtrend movement is almost over as the asset prepares to go bullish/uptrend. Let's see an example in fig. 10 below.
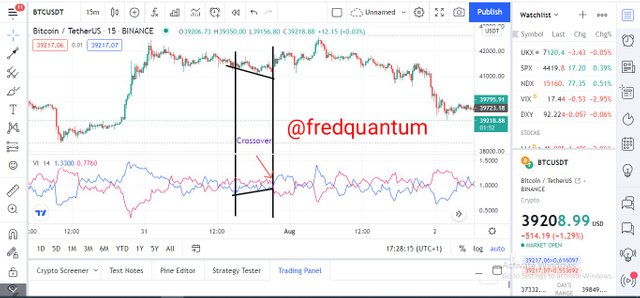
Fig. 10: VI Bullish Divergence
From the chart of BTC/USDT on the 15mins time frame above, at a particular time on the 31st July 2021, the asset made a low while the +VI also had a low. Some minutes later, the price of the asset made another low (lower low) but this time around, the +VI made a higher low which is an indication of bullish divergence. In the long run, the +VI crossed over the -VI which opened the way for a bullish trend of the asset.
Vortex Indicator Bearish Divergence
Bearish divergence occurs in the use of the Vortex indicator when the price of an asset makes higher high and the +VI oscillating line makes lower high instead, this is an indication that the bull run is over for some time and the bear is taking over sooner. Let's see an example in fig. 11 below
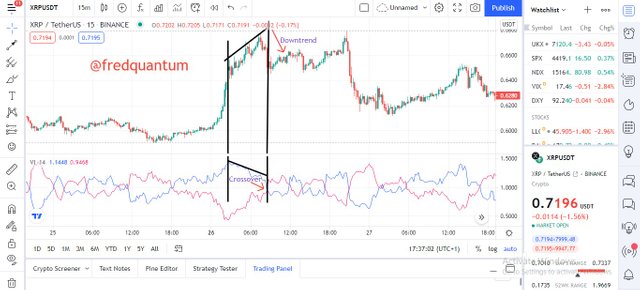
Fig. 11- VI Bearish Divergence
Above is the chart pattern of XRP/USDT asset at 15mins time frame. It happened on the 26 July 2021, when the asset's price created a new high and followed by consecutive Higher highs, in the contrary, the movement of the +VI created series of Lower highs which is an indication of a bearish trend insight. Later that day, the +VI crosses below the -VI and the bearish trend began.

5. Using the VI to buy and sell two cryptocurrencies
For this section of the task, I will be buying the BTC/USD asset and selling the XRP/USD using the Vortex indicator. Let's get to it below.
BTC/USD (Buy Entry)
I explored the chart pattern of BTC/USD asset on TradingView on a 15mins time frame, I detected an earlier crossing over of the +VI above the -VI which is an indication of a good buy. Let's see Fig.12 below.
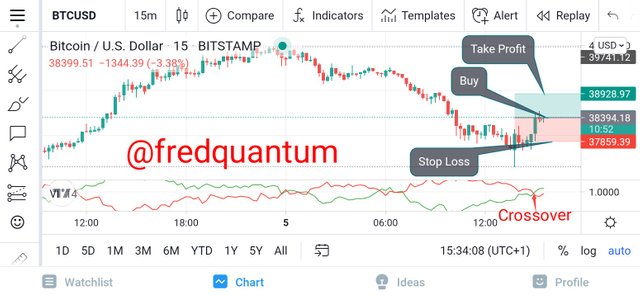
Fig. 12: BTC/USD on 15 mins time frame
From the setup above, after the crossing over of the +VI trend line which is an indication of an upward movement of the asset. On the chart pattern, I set up a buy entry utilizing the 1:1 (R: R) putting me at an equal exposure to gain and loss. I entered at the price 38430 USD, the stop loss set at 37859 USD and the take profit at 38925 USD using the Meta Trader 4. See the fig. 13 below for the trade placement.
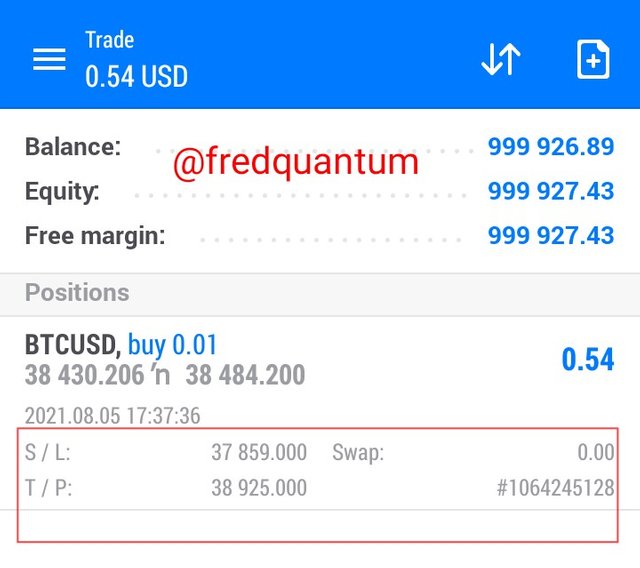
Fig. 13: BTC/USD trade
After a few minutes of the trade placement, I checked and I realized the trade has closed in profit when the price reached my take profit level. The trade ended with a profit of 4.95 USD. See fig. 14 below.

Fig. 14: BTC/USD trade exit in profit
XRP/USD (Sell Entry)
I made a sell entry into the market of XRP/USD asset after I found out the -VI trend line has crossed over the +VI sometimes earlier. This is realized on the chart pattern of XRP/USD at a 45mins time frame. Let's see fig. 15 below.
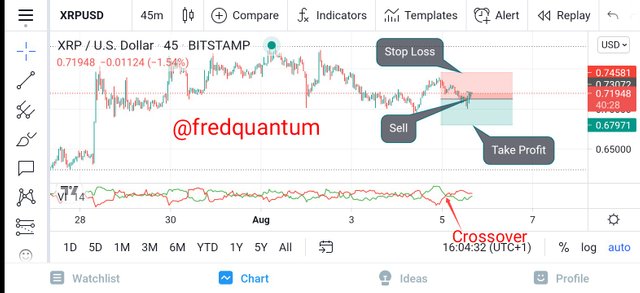
Fig. 15: XRP/USD on 45mins time frame
From the chart above, I placed a sell entry into the market of XRP/USD and I didn't forget to use my 1.1 (R:R) which place me at an equal exposure to gain and loss. The sell entry is 0.7203 USD, the stop loss is 0.7451 USD and the take profit is 0.6792 USD. I placed the trade using the Meta Trader 4. See the trade placement in fig.16 below.
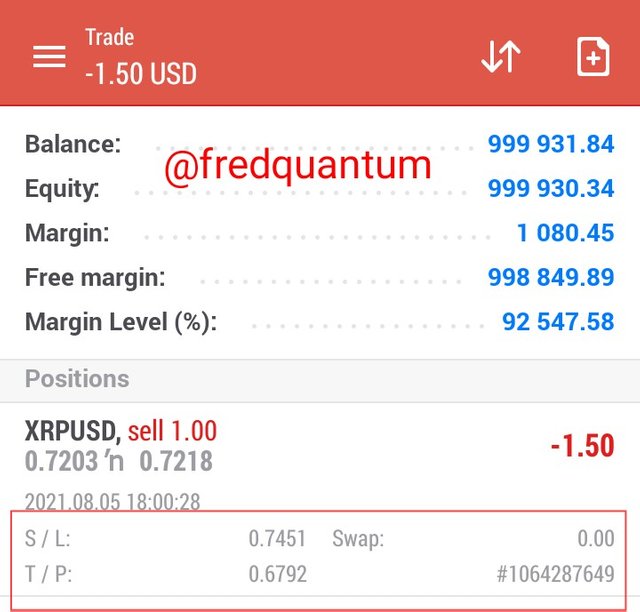
Fig. 16: XRP/USD trade

Conclusion
The technical indicator Vortex indicator is one of the tools used for technical analysis in the crypto ecosystem, it's quite new as compared to many indicators that have been existing for longer years. The reliability of this technical indicator within the little time it has spent in the space is remarkable and maybe it would take more years before it can grow to become one of the top best tools in the technical analysis space.
Remember, technical indicators often give false signals and VI isn't an exception. For more accurate results, it's advised to combine this technical indicator with MACD for more accuracy. Thanks to professor @asaj for this great lecture.

Cc: @asaj

Written by;
@fredquantum
You've got a free upvote from witness fuli.
Peace & Love!
Downvoting a post can decrease pending rewards and make it less visible. Common reasons:
Submit
Good job @fredquantum!
Tanks for performing the above task in the sixth week of Steemit Crypto Academy Season 3. The time and effort put into this work is appreciated. Hence, you have scored 8 out of 10. Here are the details:
Remarks
You have demonstrated a clear understanding of the topic.
Downvoting a post can decrease pending rewards and make it less visible. Common reasons:
Submit