
1- Introduce Leverage Trading in your own words.

Leverage can be defined as the ratio between the investment needed and the position value why margine refers to how many percent of the position needed. Leveraged trading which is also referred to as margin trading is a trading system which permits a trader to enter positions that are very much bigger than his capital. This means that a trader can enter a market position with money that is far greater than his capital.

2- What are the benefits of Leverage Trading?

- Instead of paying the full price of an assets the trader can minimise the capital risk by paying a small portion. for example if the open/entry price of a coin is $2000 the trader can use leverage trading like 400:1. This implies that he will have to pay $1 for every $400 of the coin. At the end he ends up opening a position with only $5 for the assets using leverage trading.
- In leveraged trading, trade profits are multiplied. Take for instance that you bought a crypto asset whose real price is $1. You bought 20,000 pieces of the coin with only 1000 dollars and at a leverage of 20 : 1. The price of the coin then increases by 5% and you decide to sell out then you would have
20,000 * $1.05 = $21000
hence your profits will then be $1000 which is about 100% of your real/invested money.

3- What are the disadvantages of Leverage Trading?

- The trader could be required to deposit a greater margin if the market starts to go against him so as to cover his losses.
- As beautiful as the multiplication of reward maybe in leverage trading, so is the multiplication of the losses that could also be incured.
- Fees are charged in the form of periodic funding fee. This is charged for holding the coin. This is totally contrary to the what happens in spot trading.

4- What are the Basic Indicators that we can use for Leverage Trading? (Need brief details for any essential Indicators and their purposes)

Supertrend indicator:
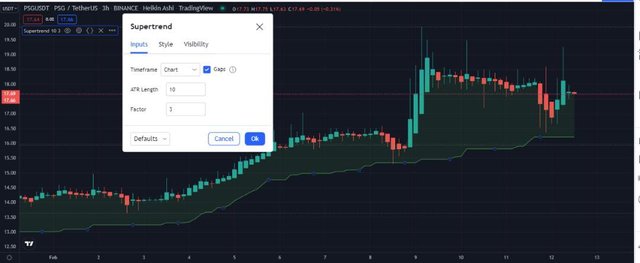
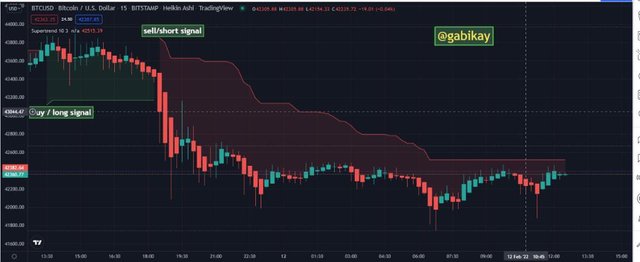
similar to moving average, this indicator is plotted on price and the trend of the market can easily be identified by its placement upon price. It is constructed with just two parameters namely multiplier and periods. In the construction of supertrend indicator, the parameters set by default are 3 for it's multiplier and 10 for average true range(ATR). The ATR is very vital in supertrend as it is used by the indicator to compute the indicator value and hence helps to alert to what degree the price may fluctuate.
Parabolic SAR:
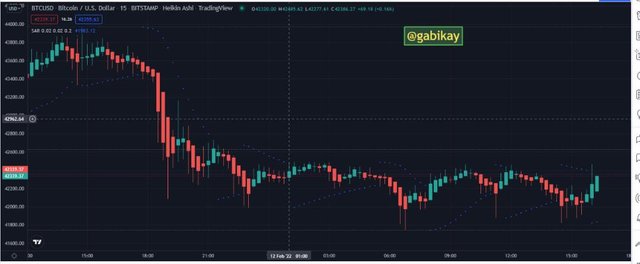
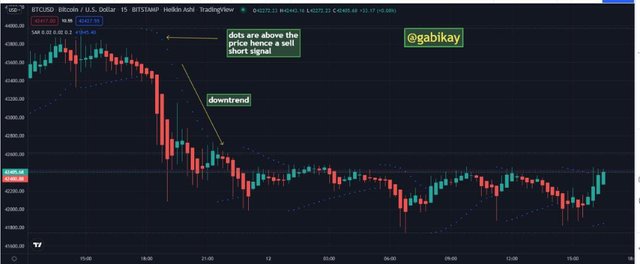
The parabolic sar also known as parabolic stop and reverse is a well-known indicator used to detect an assets short-term momentum. It aids a trader to know where to place his stop loss.
Moving Average Cross (MA Cross):
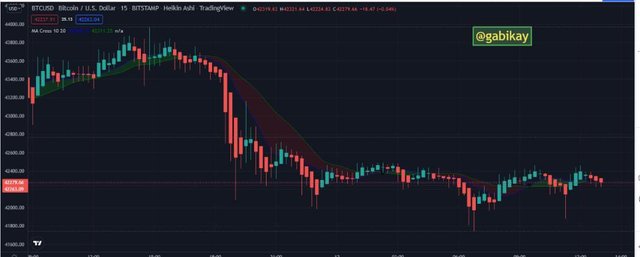
The MA cross is the technical tool that occurs when two different MA lines intersect each other. The moving average cross indicator helps to identify the direction which the price might be trending, expose potential entry and exit points, and detects when the trend might be trending or reversing hence, when the two MAs cross each other, it is a signal that the trend could change soon.

5- How to perform Leverage Trading using special trading strategies (Trading Practice using relevant indicators and strategies, Screenshots required)

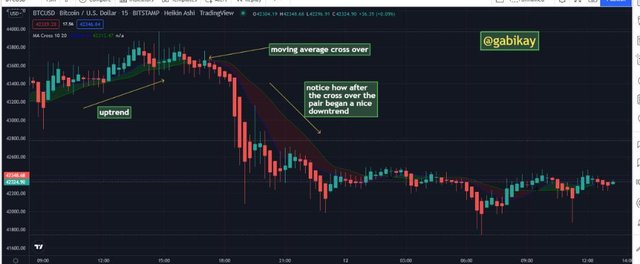
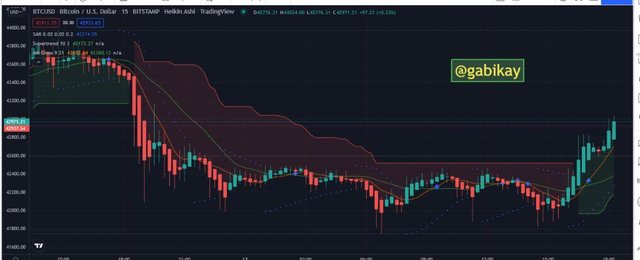
Using MA cross for leverage trading, the time is set to 15 mins and the chart type used is Heiken Ashi and the trade pair is BTCUSD. Here I used two different MAs i.e (10 & 20) and then I spot where the two MAs cross each other. At the point where the Green MA crosses the blue MA and goes below it is a sell short signal.
Also, I could use Supertrend indicator to spot entry and exit positions in leverage trading. When the supertrend goes below the price and turns Green, it can be identified as a buy signal. Also, when the supertrend goes above the price and turns red, it can be denoted as a sell short signal.
Considering the parabolic SAR for leveraged trading, when the dots are green and go below the price, it can be read as a buy long signal. Also when the dots are red in colour and the dots mo.ve above the price,it can be read as a sell short signal
Below is a chart containing all three indicators

6- Do a better Technical Analysis considering the above-explained trading strategy and make a real buy long or sell short position at a suitable entry point in any desired exchange platform. Then close that buy or sell position after appearing trend reversal signal from the Parabolic SAR indicator. Here you can also close your Buy or Sell position using any other desired Trading Method in addition to the signal coming from the Parabolic SAR indicator. However, here you must prove that trading method as a reason for closing your position. (Usually, You should demonstrate all the relevant details including entry point, exit point, resistance lines, support lines or any other trading pattern. Use at least 2X leverage and no more than 10X )

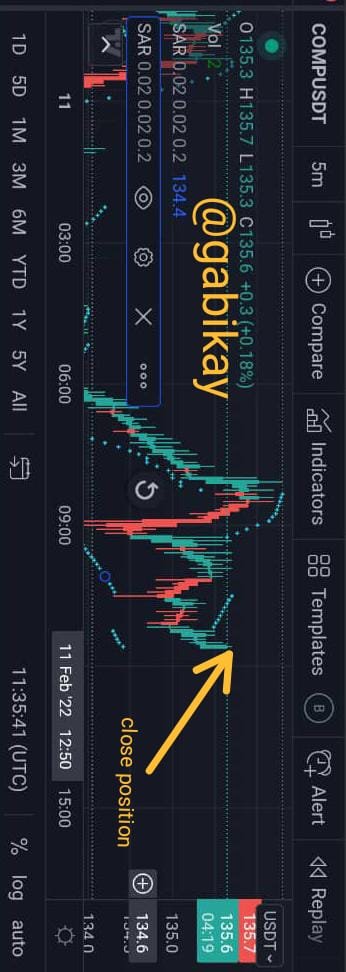
• For the purpose of this leveraged trade, I have used COMPUSDT pair. I used time interval of 5 minutes and Heiken Ashi chart to remove unnecessary market noise. I spotted the beginning of the Parabolic SAR dots moving below the price. This is a buy signal. So I take an entry position.

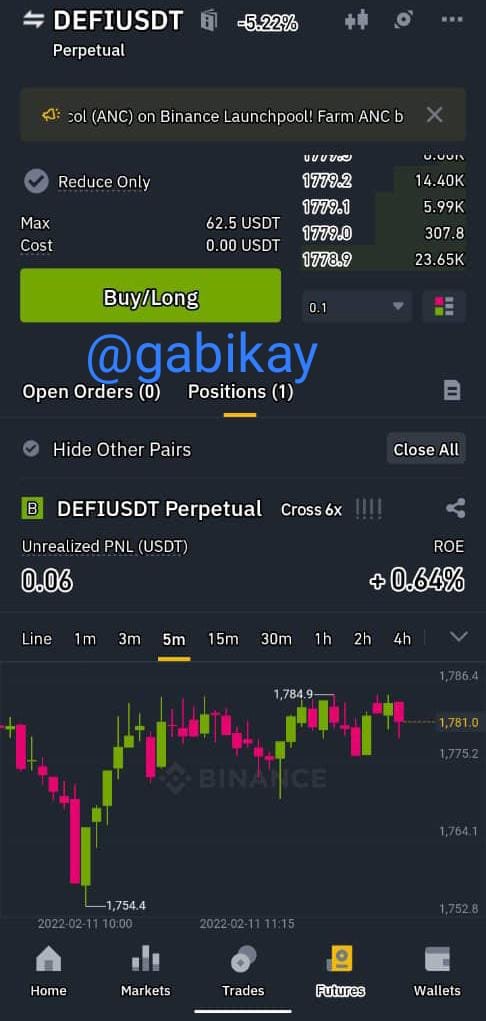
• I have completed this Trading using Binance Exchange. I quickly go to trade and open a Buy Long position. I entered the market at 0.00% of ROE
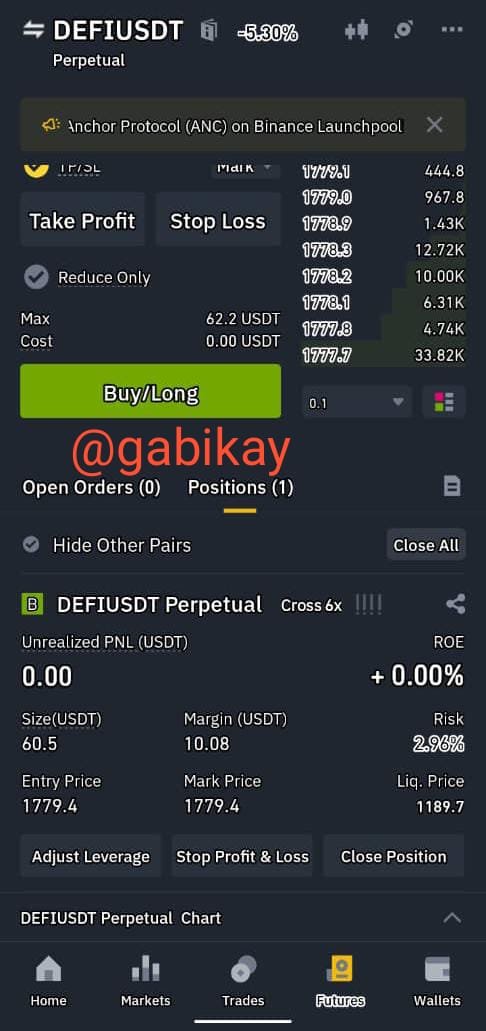
• Next, I await a little market move and then I close position at 0.64% ROE.
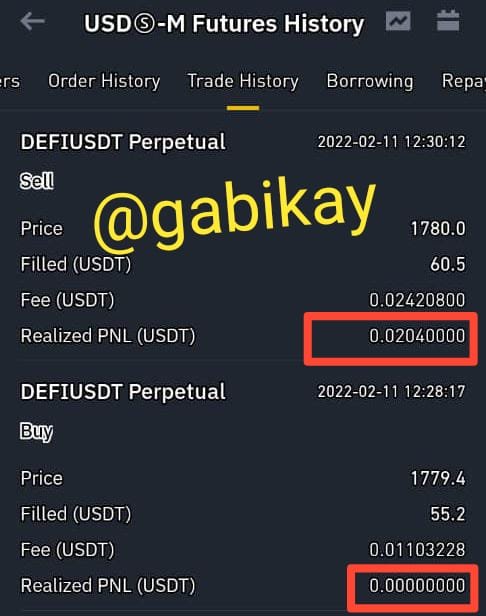
• Below is my trade history. My total PNL can be seen to be 0.0204USDT. I have not made any loss from the trade but unfortunately, the trade fee has taken up a little above my profit.

Conclusion

Leverage trading is a very profitable kind of trading but only when properly understood and used. The Supertrend, Moving Average Cross, and Parabolic SAR are indicators that can be used to spot entry and exit positions.
To avoid liquidation, it is wise to always input your stop loss once you open an position and as always, never invest more than you can afford to lose.

Regards to professor @reddileep