I have been very choosy with assignments recently as I ensure I participate in exciting ones even though I go through all classes. Hello everyone, my name is @gbenga and I am happy to be participating in the @yohan2on assignment, after attending his class on Swing trading. Without any further ado, I will swing into this exciting task.

Introducing Trading
Trading is the exchange of commodities, assets, liabilities, stocks, indexes, forex, real estates, and digital assets between two people. Compared to investing that doesn't look deep into the technical analysis of an asset but rather on fundamental analysis, Trading in the financial market requires the major use of technical analysis and less of fundamentals.
Technical analysis involves the study of price, volume, and trends of past financial instruments via indicators, oscillators, and trading systems to form a future prediction of the market.
Swing Trading
Swing trading is trading that involves the holding of a trading position until the target is met. The target can be met within hours, days, weeks, and sometimes months. For Swing traders just like every other trader, a chart is important and a chart is the basis of technical analysis. For the sake of this task, I will be working with SOL/USDT pair.

Trading plan for SOL/USDT
A trading plan is essential for any trade, it comprises every intended activity and action that will be taken place on the trade. Professional traders would emphasize heavily having a trading plan because it is a traders' whitepaper. It will tell when, how, and why a trader will place a trade while helping to mitigate/manage risks. To state clearly, the aim of every trading plan is to make a profit, although, in some cases, it might not go as planned which will lead to losses in some cases when your wins surpass your losses, then you are in power. The plan is important as it helps traders through ill-advice, emotional decisions, and allows them to stick to rules and predetermined exit.
There are several trading platforms to trade and use trading tools to analyzes the market, but for me, I am very familiar with Trading view I do not like to trade crypto assets that do not have enough volume and liquidity and this is why I do not trade coins that aren't listed on Binance Margin trade. Coins listed on Binance margin trade have enough liquidity, the market price can move thereby forming a trend or creating a readable chart, the price cannot be manipulated with little buys or sells, and exit can be done without fear of no liquidity. SOL has $360,448,467 in volume on Binance and over $1 billion on all exchanges.
Multiple time frame analysis
In other to trade, it is important to check the past history of the chart. I will be utilizing the weekly time-frame, Daily time-frame, 4-hours time-frame, and the 1-hour time-frame (seldom). It is important to view an instrument in a different time frame as it allows traders to see the overall trend of the market. With a larger timeframe, one can see the larger picture but with the smaller time frame, it is easier to see the smaller waves in the trend.
Weekly Time-frame Chart
i will utilize the weekly chart to see a broader spectrum of the coin, this will help me understand the entire price history of the coin including the overall trend.
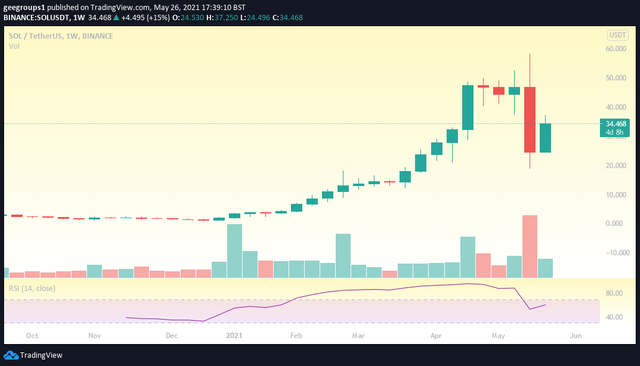
From the chart, the coin has been on the uprise for a while, it experienced a downfall in a short while and now has a rise in price. This is very easy to identify because the entire graph shows an extensive.
Daily time-frame chart
This is a more detailed chart showing the waves from the weekly chart. The 1-day chart shows the graph in a daily manner where one bar or candlestick represents 1 day.
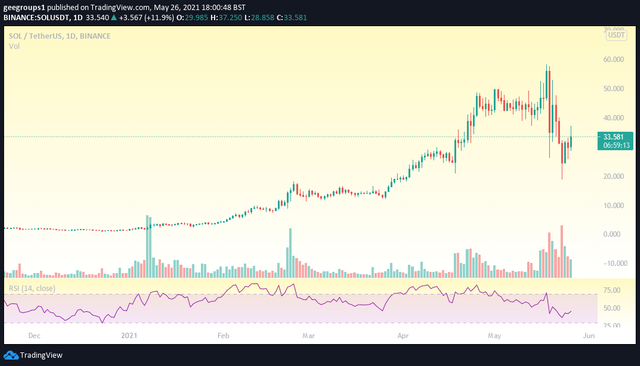
Candlestick analysis and use of other relevant supporting indicators for your trade decision.
To begin the analysis, I will use the weekly, 1day, and 4 hours time frame. For the weekly timeframe, it is easier to see the bigger picture of the chart, showing the trend, the all-time highs, and all-time lows.
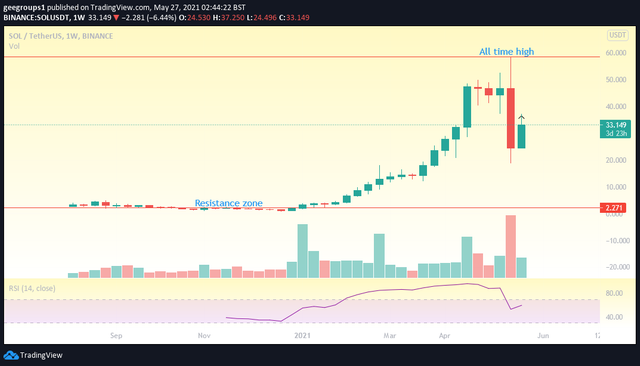
The chart shows from the 10th of August 2020 till date (27th May 2020). Showing the lowest low, highest highs, and the resistance before the coin started to see an uptrend.
On the Daily chart, I am able to look closely and identify the trends in the chart as well as identify who is in control of the market, buyers or sellers. From the chart, I was able to see an uptrend, followed by a downtrend, and a market reversal. Currently, the sellers have the market as the last candlestick is the selling stick.
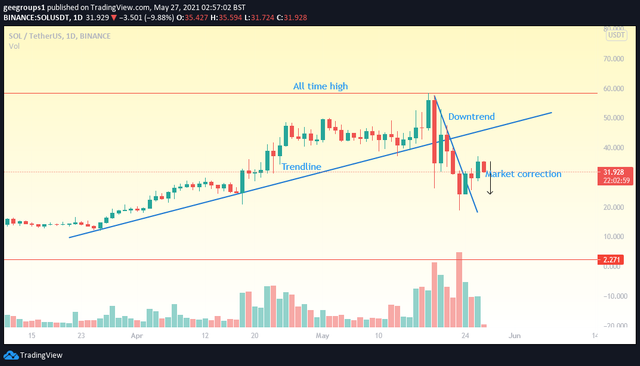
In other to check for patterns, impulsive moves, and corrective moves, the use of indicators, entry, exit, and stop-loss.
At the 4-hour time-frame chart, a cup and shoulder pattern was established which means that SOL will have its price movement up except unless things go wrong (failure) but then, we can't say that one analysis proves everything.
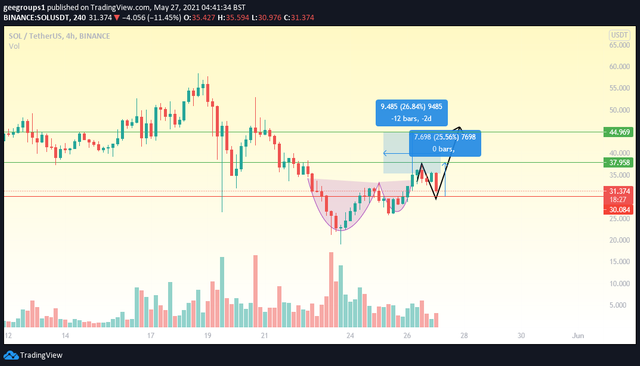
I could check using another price pattern such as the ascending triangle.
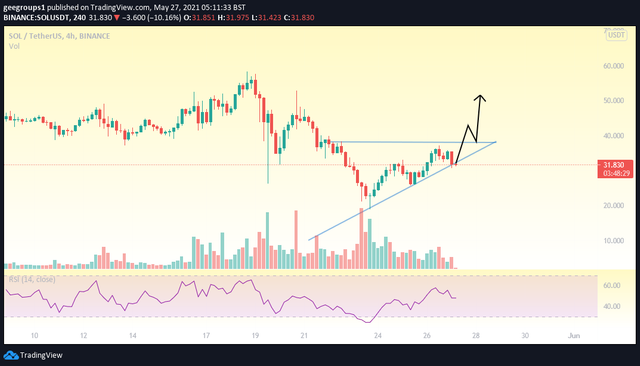
The market is currently dominated by sellers which could be traders taking profit from the previous impulse thereby causing a correction. The volume of sell is moderate with over $1M but then indicators need to prove this and then I will be using the Relative Strenght Index.
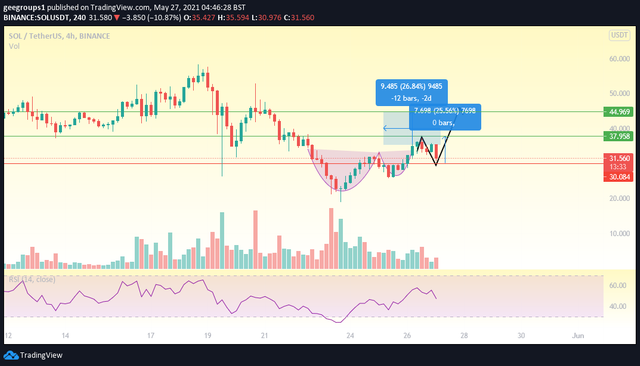
The relative index at 47. 93 shows there is a high sell but this sell might drop to pick again and then start the impulse which will take the coin to its targetted point.
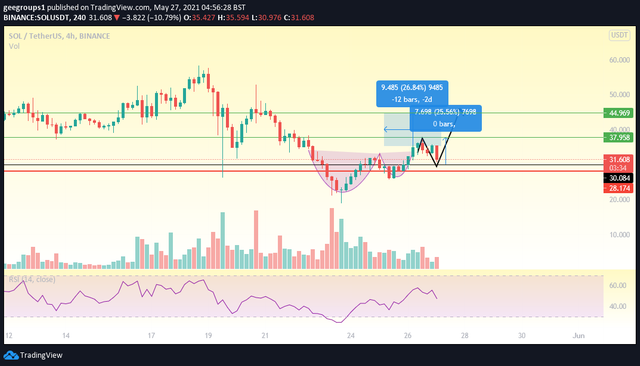
Then, since the market isn't solely owned by me, there could be cases where the market goes against me, I will be stopping loss at$28.174 which is the higher low below the entry.
/
Trade management ( Setting stop loss, trailing stop and take profit)
For this trade, I will enter the trade at $30.084, will take profit at two points, $37.958 and $44.969. I will be stopping the loss at $28.174.
| Entry Price | 30.084 |
|---|---|
| Stop-loss | 28.174 |
| Take Profit 1 | 37.958 |
| Take Profit 2 | 44.969 |
Conclusion
No one has made all trading calls and analyses right, and this is why it is important to use stop-loss when entering a trade. Do not allow greed and fear to take over you when trading, always have a plan and remember that there will be several other trades, it is important not to waste resources on a trade while losing.

Hi @gbenga
Thanks for participating in the Steemit Crypto Academy
Feedback
This is excellently done. It's an article with a well laid out trading plan, with good technical analysis and demonstration of the Swing trading style. Identifying and Trading Chart patterns is one of the great resources used in Swing trading purposely for having good entry and exit positions.
Homework task
10
Downvoting a post can decrease pending rewards and make it less visible. Common reasons:
Submit
Thanks friend, I am glad you were able to go through my post.
Downvoting a post can decrease pending rewards and make it less visible. Common reasons:
Submit