Thank you Prof. @kouba01 for this insightful lecture, here is my homework post.
What is the Relative Strength Index - RSI and How is it Calculated?
Relative strength index is a momentum oscillator that determines the speed and change of price movements. like other technical indicators, it is used as a trading tool. it was developed by J. Welles Wilder in his book in 1978 "New Concepts in Technical trading Systems"
How RSI Works
RSI is used to measure whether an asset is oversold or overbought
The RSI oscillates at a range of 0-100. By default the mean is 50. The RSI is considered bearish or downwards trend when it is below 50 and when it is above 50, it is considered bullish or upward trend.
To spot oversold or overbought signals, it has been made at below 30 and above 70 (+or 20 of the mean). when the RSI is above 70, it is considered oversold when it is below 30.
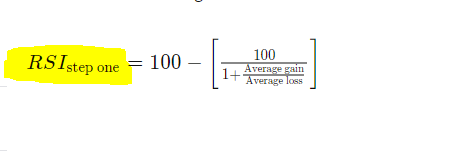
How to Calculate RSI
RSI is calculated in two parts.
in the First formula, average there means addition of the individual entries divided by the number of entries. Mathematically, Average = x1 + x2 + x3 +...+Xn/n
The first formula.
Taking an example in cryptocurrency. Let's suppose TRON(TRX) performs well for 7days and gained an average profit of 1.5% and had a poor performance for the remaining days and loss 2% averagely. Using the above formula, the RSI will be
In the above example, the RSI of TRON(TRX) came out to be 42.857 which is below the mean. This means that the graph will be going down and indicates a bearish or a downwards trend.
If it had been below 30, it would have indicated an oversold asset.
Had it been above 50, it would have been a bullish or upwards trend. and if it had been above 70, it would have indicated an overbought asset.
The second part of the RSI calculation can be done once there are 14 periods of data available. The second step smooths the results.
Can we trust the RSI on cryptocurrency trading and why?
Nothing in the universe is perfect and RSI is not excluded. However, if RSI is combined with other indications like support, resistance etc. and a good trading experience, it may become a trustworthy indicator. The following are some demerits of RSI;
it does not considered some other factors that influences crypto prices, for example, economic news and some other factors.
sometimes, RSI stays overbought or oversold even in fluctuating markets for a long time that may contradict divergence suggestions and give rise to false negative or false positive signals.
How do you configure the RSI indicator on the chart and what does the length parameter mean? Why is it equal to 14 by default? Can we change it? (Screen capture required)
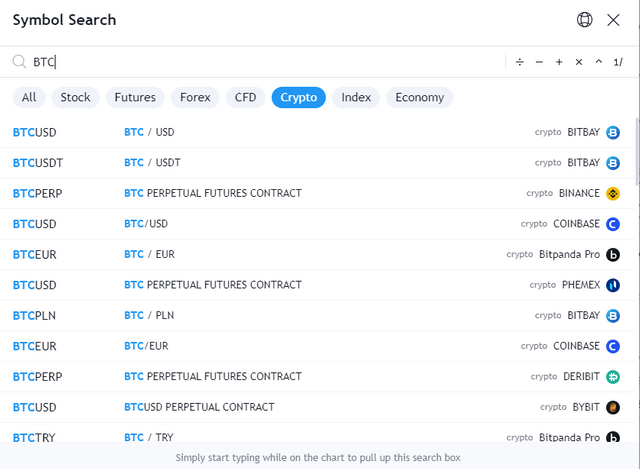
First go to Tradingview. Tradingview is a market analysis tool.
Click on "Launch Chart"

Start typing in your preferred currency and the searchbox will show up. in my case, I am selecting BTC/USD for my analysis
Click i the fx button to open indicators and strategy dialog box from the top menu and select or type in Relative Strength Index. The chart will be shown immediately. This is a Year to date (YTD) time frame.
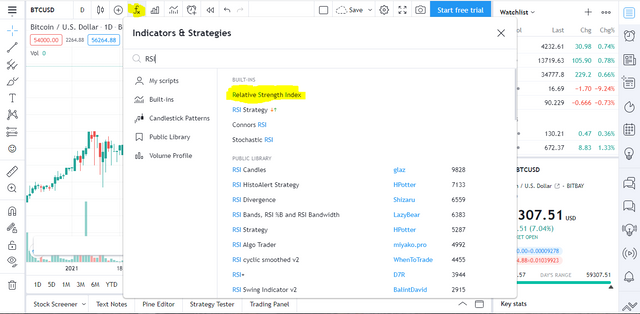
Length Parameter
Length is the parameter that decides the speed reaction to the changing market.
Length of the RSI chart is by default 14 units. The time units selected determines the length. If for instance, 1 month time frame is selected, RSI of 14 months will be shown. If 1 day is also selected, a 14 days RSI will be shown.
There are other parameters in RSI and it includes price of RSI it is closing price by default, but can be changed to lowest or opening price.
How do you interpret the overbought and oversold signals when trading cryptocurrencies? (Screen capture required)
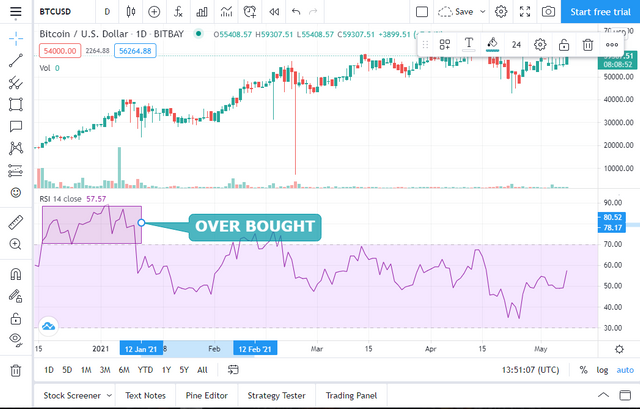
If the RSI of an asset is below 30, it indicates the asset has been oversold and overbought if it's above 70.
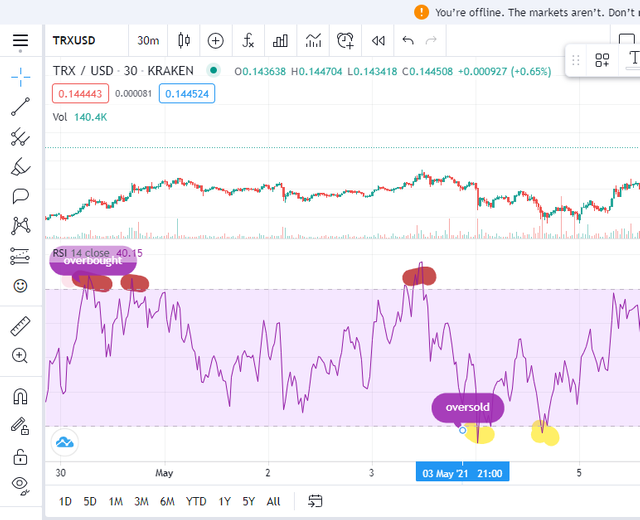
The overbought signals are those that are highlighted yellow and the oversold signals are highlighted red. in the picture above, it can be seen that the RSI was below 30 at around 9pm on 3 may and indicated an oversold. In 30 april an overbought was recorded.
How do we filter RSI signals to distinguish and recognize true signals from false signals. (Screen capture required)
RSI can give false signals. a technique that can be used to spot these signals is divergence in RSI.
There are two types of divergence; bullish divergence and bearish divergence.
Bearish divergence happens when the RSI makes an overbought reading followed by a higher high pattern. A higher high pattern means the next high is more than the previous high.
A bullish divergence occurs when the RSI makes an oversold reading that is followed by a higher low that matches corresponding lower lows in the price.
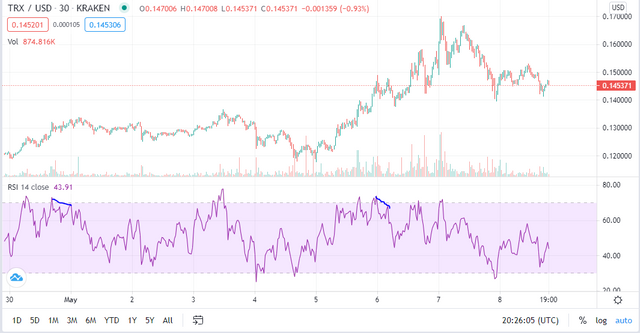
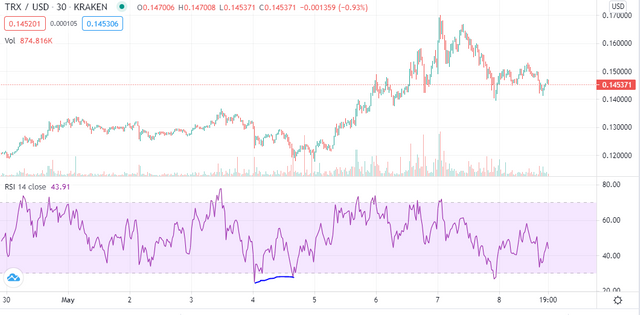
In the chart, it can be seen that a bullish divergence and a bearish divergence were found.
Review the chart of any pair (eg TRX / USD) and present the various signals from the RSI. (Screen capture required)
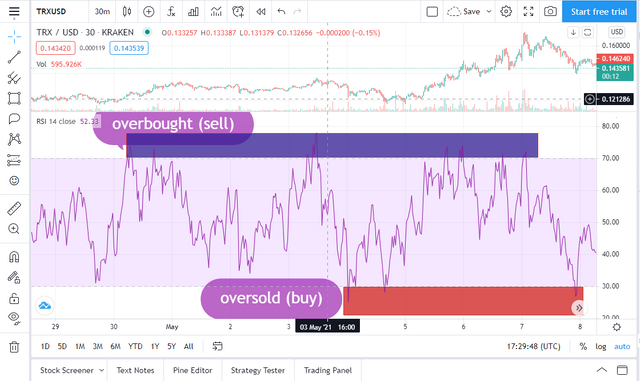
the cryptocurrency pair compared here is TRX/USD. The area of the blue rectangle shows the overbought signals and a signal to sell.
The red rectangle shows the oversold signals and therefore an indication signal to buy
Conclusion
The RSI tool is used to indicate oversold and overbought signals but using that alone will not suffice for a correct signal and therefore it will be better if combined with other indication tools and trading experience
Thank You
Hello @gentles,
Thank you for participating in the 4th Week Crypto Course in its second season and for your efforts to complete the suggested tasks, you deserve a 5/10 rating, according to the following scale:
My review :
Medium content, it lacks accuracy in answering some questions and analyzing some important points due to not being well understood. Try to take your time researching the basics of the RSI and their uses.
Thanks again for your effort, and we look forward to reading your next work.
Sincerely,@kouba01
Downvoting a post can decrease pending rewards and make it less visible. Common reasons:
Submit
@kouba01 profesor mi tarea aún no la ha revisado
https://steemit.com/hive-108451/@derlis13/steemit-crypto-academy-temporada-2-semana4-comercio-de-criptomonedas-con-rsi-prof-koubai01-by-derlis13
Downvoting a post can decrease pending rewards and make it less visible. Common reasons:
Submit