Assalam-o-Alaikum!
I hope that you will be well with the blessings of Allah Almighty. This is the first week of season 4 and I'm very excited that I participated this week. I got some late but no worry. I am very thankful for professor @allbert that he gave a very important task about trading and in my point of view, this is so important because there are many important things in this task that usually traders do not know about them.

So, Now move to the topic.
1- Graphically, explain the difference between Weak and Strong Levels. (Screenshots required) Explain what happens in the market for these differences to occur.
Answer Question Number One

On these occasions, most of the buy and sells orders collect here in large numbers.
In the chart, the price moves down and stays at a point where price takes support and moves up in chart. That support point is called Minor Support. Usually this support imagen weak support so this support did not take seriously. Second time, after some time when the market moves down in the chart and takes support to move up then the support point is called Strong Point. This point has a lot of chances of the market up at a high level. Sometime after the strong support market moves down again and takes support, then at the time support is called Major Support but here I will discuss only Strong Support.
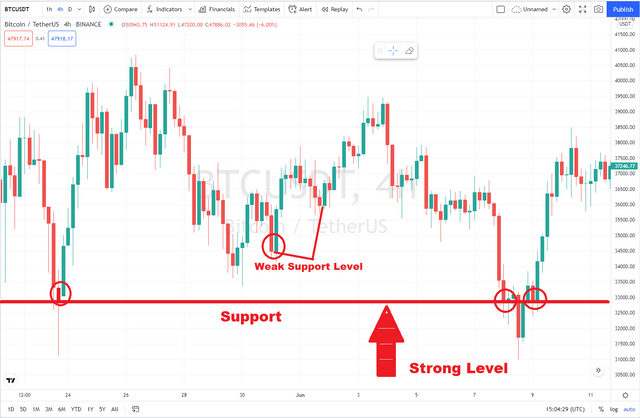
On the strong point, traders trade fastly to get more benefit and profit, and here a large amount of money moves to liquidity. This is also called Strong Support. This is so trustable point because there are many chances to market up in the chart but sometimes it could be opposite to the expectation.
Resistance
In the chart, the price moves up and stays on a point then and moves down to take a resistance then the point of the resistance is called Minor Resistance. This is usually understood as weak resistance. Again market moves up and takes resistance to move down. Then the second point is called Strong Resistance.
There should be at least of 8 to 10 candles gap between the two support and resistance otherwise these are not allowed to be called different support and resistance.
When price creat support after this, price break to the support and move down and after this at the correct point price make a resistance where support was created. Here is now support is resistance and after this formation, we get sell signal to sell trading and here is a signal of a strong market.
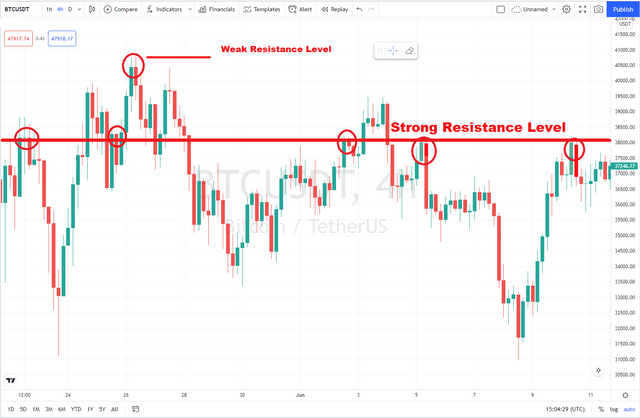
On the other hand, when price makes resistance and after this, price break to the resistance and moves up. After, it makes support at the same level where resistance was being created. It means that here resistance has become support. After this formation, we get a signal of buy trade in the market, and here is a signal of fast trading.
2-Explain what a Gap is. (Required Screenshots) What happens in the market to cause It.
Answer Question Number Two

What are the gaps and what happens in the market to cause it?
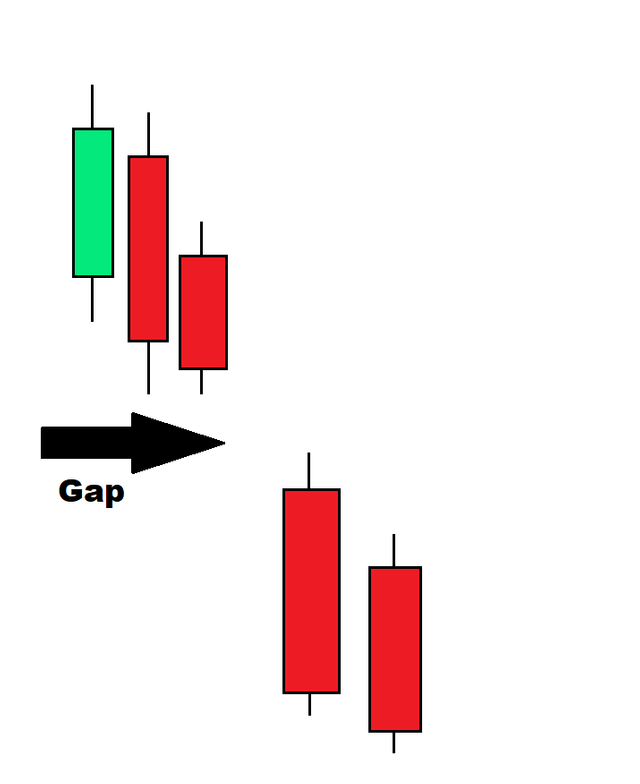
In trading, gaps are the areas in which trading stays close for a short while. Actually when prices fastly move up and down then for a short time no trading and in the result assets chart shows the difference in the normal pattern of the price then traders analyze it and interpret it for profit. Gaps can change the value of any currency and they are responsible to change the structure of the chart.
3- Explain the types of Gap (Screenshots required, it is not allowed to use the same images of the class).
Answer Question Number Three

Type of gaps that I will explain
Break away Gap
Runway Gaps
Exhaustion Gaps
Breakaway Gap
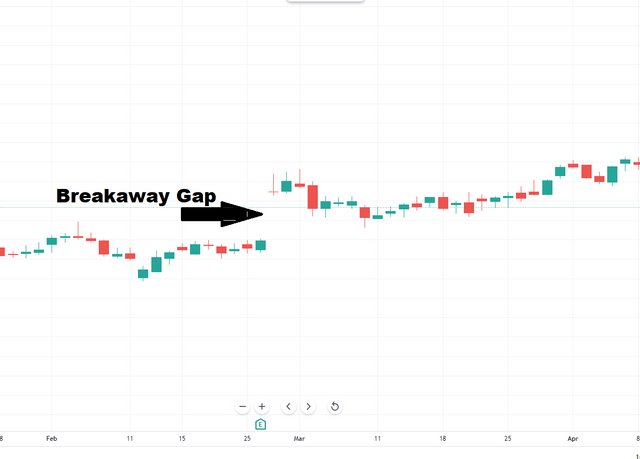
Normally people take these gaps the same but are not. As the name implies Breakway. It means are to break something and move forward. Commonly breakaway gaps are found near support and resistance. Breakaway gaps are seen in the trend when a price moves out of the trading and this gap does not fill and trading moves forward fastly. It starts a new trend and also represents support and resistance level.
Runaway Gap
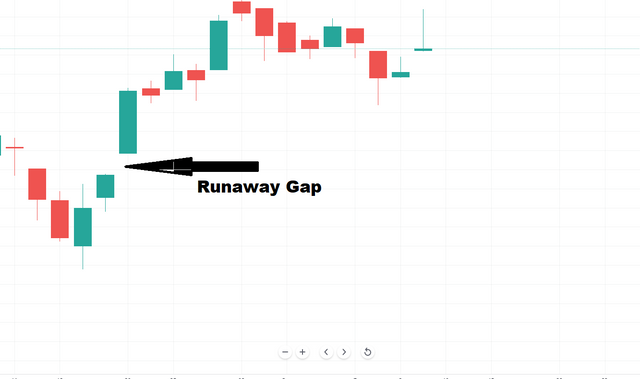
When a gap occurs when the price action decides that what is the type of the gap. A runaway gap occurs when trading activity skips its regular points of price. Runaway Gaps are formed due to Increased buying interest that happens all of a sudden. These gaps formed in good-trend and these gaps do not get filled soon and usually saw trending moves and at times these gaps formed in the mid-way of the trend.
Exhaustion Gap
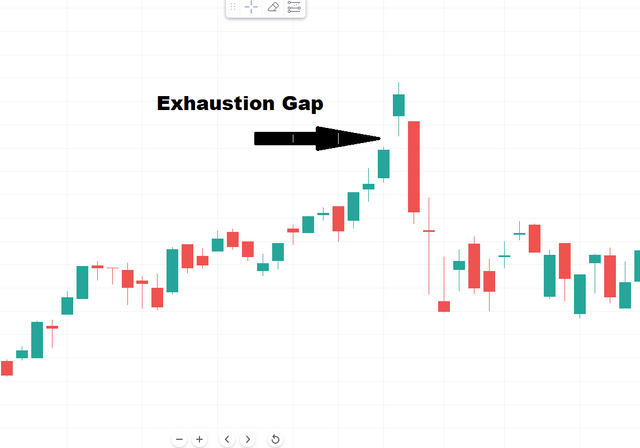
So now we look at the other type of gap which is the exhaustion gap. Exhaustion gaps as the name suggests comes at the end of the move hence they indicate exhaustion of a major move these gaps are associated with rapid extensive advances or declines in contrast to runway gaps at the moment before the appearance of exhaustion gap does not indicate any increase in resistance as they proceed basically there is no tendency to lose momentum, on the contrary, the move continues to speed up until suddenly it hits a wall of supply.
4- Through a Demo account, perform the (buy/sell) through Strong Supports and resistances. Explain the procedure (Required Screenshots).
Answer Question Number Four

As I defined strong support and resistance so now I will perform (sell/buy) through strong support and resistance according to the requirement of the task.
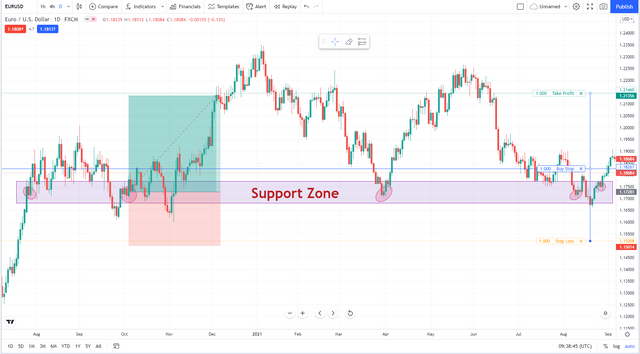
The market shows support and resistance to every movement and through it, we get a zone of continuous support. In this zone, when the market takes to support the first time then it is taken as minor support but, when the market takes to support the second or third time then is taken as strong support. In this sequence, we get a support zone and in this zone, we can trade anywhere at the strong point, and here most of the currency buys because after a strong level, the currency rate increases.
Trade With Resistance Level
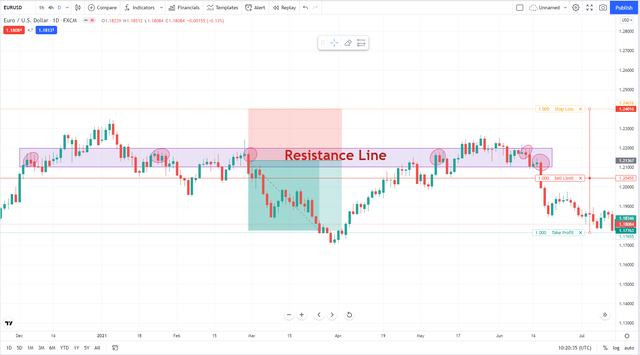
Now I will show that how can we trade on strong resistance points. When the market moves up and after a time market moves down by taking resistance then a resistance point creates. After a while market again moves up and then comes down to take a resistance then another resistance point creates and the same market makes the same sequence of trading. Then by analyzing a resistance line can draw that called resistance zone. This zone is good for sell trading in which we can sell our assets.
Let understands it by an example.
References
Trading With Strong Support Level
In the screenshot, you can clearly see a support zone and circles are showing support levels. I entered the market when it's the market current price in 1.18084. I traded of buy at the price of 1.18267. It means that my buy tradie will start at 1.18267. I adjusted stop loss (ST) and take profit (TP) at 1.15208 and 1.21460. I traded on a 1000 account balance. When the market will touch to buy stop then my trading will start automatically and if the market goes up then I will get a profit of 1.21460 and here my trading will stop automatically. On the other hand, if the market does move up and start moving down then my trading will be finished at 1.15208 and I will get a minor loss.
Trade with Resistance Level
In the given screenshot, you can see a resistance zone and you can see some circles in the screenshot. These circles are showing resistance points where the market takes resistance. Now I will trade or sell here. I set my sell limit at 1.20455. This is the point on that my sell trading will be started. I set take profit and stop loss at 1.17655 and 1.24016. If the market will move down then my trading will be finished at taking profit point and I will take my profit. If it will go against expectations and the market started to move up then my trading will be finished at stop loss and I will face minor loss.
5- Through a Demo account, perform the (buy/sell) through Gaps levels. Explain the procedure (Required Screenshots).
Answer Question Number Five

Now I will talk about trading on gaps and this is also so important to explain it. Gaps are the areas or spaces where trading does not happen and these areas took seriously. Now I will show you trade on gaps through screenshots.
First of all, for this purpose, I used a tradingview demo account. My defined currency is USD (United States Dolla) and I find out a strong gap area where in past many gaps were applied. So, I will do trading on it. I show you a circle which is represented by a circle. This is actually a gap. I trade here at the price of 134.61. I did the trade of buy my risk-reward ratio is 1:1.
Risk/Reward= 1:1
Trade will close at 164.99 on my behalf and it will also close at 134.99 if it goes against.
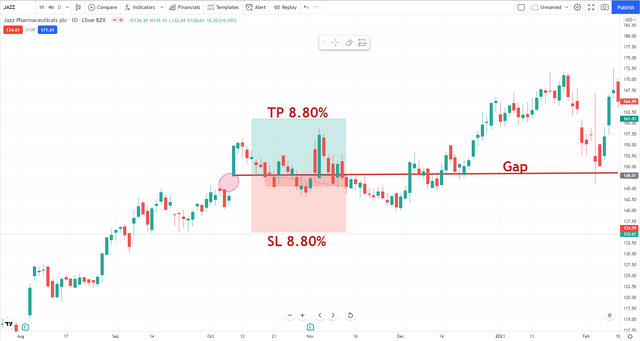
This is actually a risky action and any risky trader should do it.
CONCLUSIONS
After completing this task I come to the conclusion that gaps and strong support and resistance levels are most important and a trader can easily take high profit from them by using them correctly. These are the soul and heart of trading. If we mastered this technique we can easily take a high profit in trading.
A Post by
@ghiasahmad
CC: