
1a) Explain the Japanese candlestick chart? (Original screenshot required).
b) In your own words, explain why the Japanese Candlestick chart is the most used in the financial market.
c) Describe a bullish and a bearish candle. Also, explain its anatomy. (Original screenshot required)
2 a) In your own words, explain the candlestick patterns and their importance in carrying out effective technical analysis.
b) In your own words, explain the psychology behind the formation of the following candlestick patterns.
- Bullish engulfing Candlestick pattern
- Doji Candlestick pattern
- The Hammer candlestick pattern
- The morning and evening Star candlestick pattern.
- The Harami Candlestick pattern.
3a) Identify these candlestick patterns listed in question 2b on any cryptocurrency pair chart and explain how price reacted after the formation. (Original Screenshot of your chart required for this exercise).
b) Explain the measures taking by the trader before trading candlestick patterns.
c) Using a demo account, open a position (buy or sell) on two crypto assets using any candlestick pattern and explain your reason for taking the trade. You can perform this operation using lower timeframes. (Show screenshots of your position and also your chart.
I will be tackling the first question which is; Explain the Japanese candlestick chart? (Original screenshot required).
In your own words, explain why the Japanese Candlestick chart is the most used in the financial market.
Describe a bullish and a bearish candle. Also, explain its anatomy. (Original screenshot ).
The Japanese Candlestick is a structural representation of the price of an asset which indicates the opening, closing, highest and lowest price of it market over a specific time rate.
It is basically used to determine the technical analysis of assets. It is formed or produced as a result of the interpretation between buyers and sellers on a particular asset.
The Japanese candle stick was developed by a rice trader called Munehisa Homma. It was developed in the 1700s. His main ideology behind it invention is to be able to determine the relationship or interaction between buyers and sellers on the market.
As of today, it is one of the best tool used by traders to predict price movement or technical analysis on the market. All thanks to the inventor.
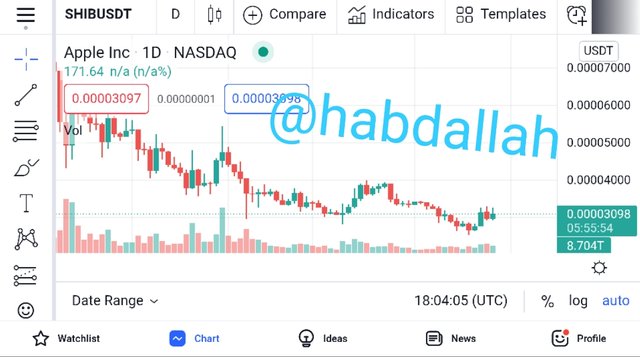
screenshots from tradingview
The Japanese candle sticks are in two forms, which is the red candle stick and the blue candle stick. The red is being named or referred to as the bearish candle, whiles the green candle is being also referred to as bullish.
The bullish candle starts with a high price, close price,low price and open price. Whiles the bearish candle starts with a high price, open price, low price and close price.
As i earlier stated, it one of the most used chart by traders all over the world due to these reasons,
*The Japanese candlestick pattern is very easy to read. It easy to read due to the colorization and structure of the candlesticks. The default colours for the Japanese candle are red and green. The green colour is used to signify buying or rising price. Whiles the red colour signifies selling or falling price.
- It tends to offers more information and insights about a particular market structure due to the high price, low price, open and close price on the candle.
*The shape of the candlestick can help traders in predicting price movement as from the look of the shape of a candlestick. Large candle bodies usaully signifies more market volume and vice versa.
- You can also customize it your desired look. How you want it to be.
Describe a bullish and a bearish candle. Also, explain its anatomy. (Original screenshot required)
Bullish Candlestick;
A bullish candlestick is usually green or white which is formed as a result in the increase of a price value or the amount of volume of buyers. Buyers only buy when the green or white candle which is the bullish is formed. Because there is going to be an increase in the volume of the price. Also when the open is greater than the close, it means that there is an increase in price value.
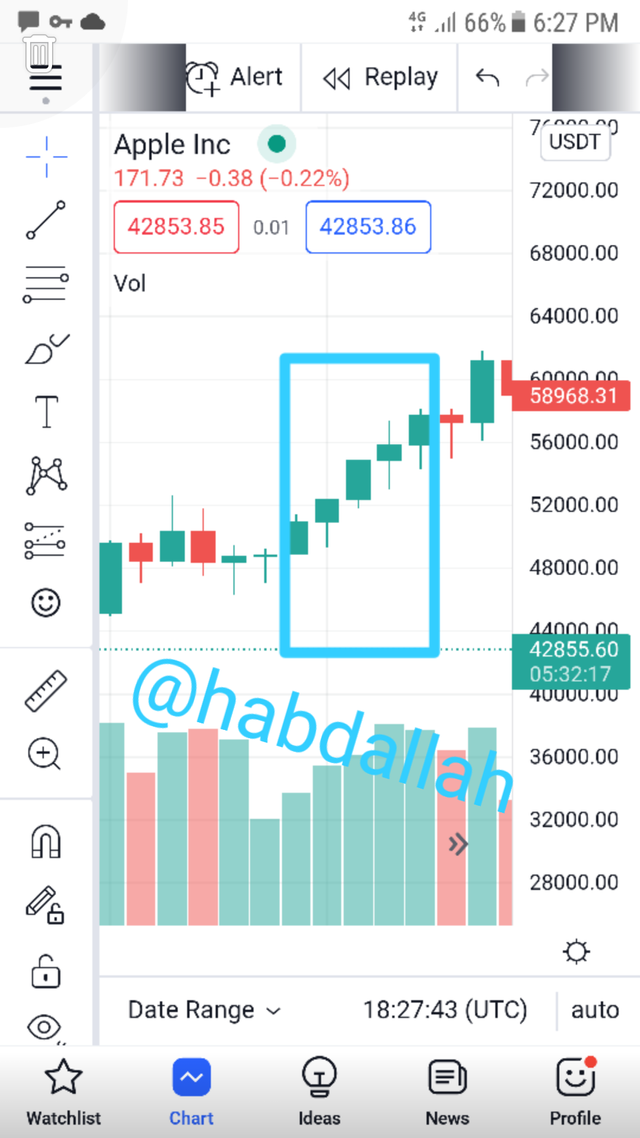
The Bullish candlestick usually indicates that buyers are taking over the market and price are in an uptrend movement.
Bearish candle stick;
The bearish candle stick is also red in colour which is also formed as a result of decrease in price value or the decrease in volume of sellers.
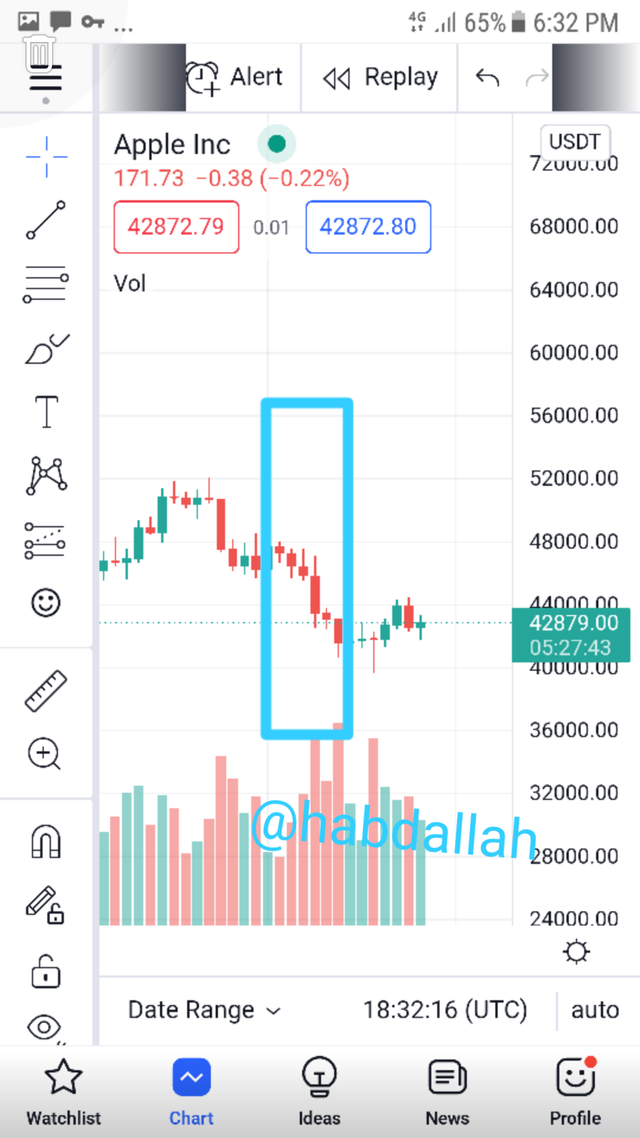
As buyers tends to sell when the green candle is formed, they also they sell when the red candle is formed. The red candle stick indicates that sellers are taking over the market. With this the market price are in down trend. Which is means the market is falling.
Anatomy of candlesticks;
The anatomy of a candlestick usually consist of four main parts. Which are opening price, closing price, Highest price and lowest price.
The other parts of the candlestick are the shadow and real body. The shadow shows the unsettled movement of price, which is the area whereby buyers and sellers compete among themselves.
Part of the candle stick
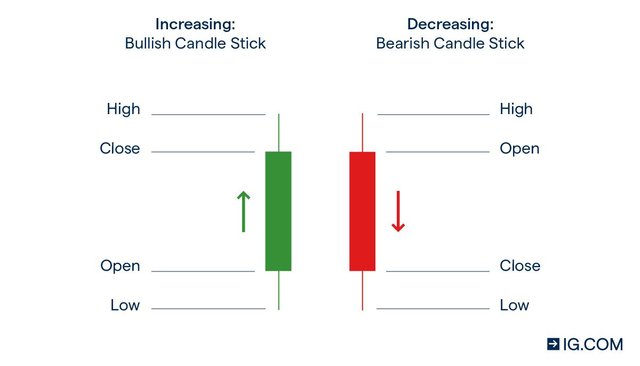
https://images.app.goo.gl/1JrVcECZa6xAr7KQ8
Opening price: The opening price is the begging price at which the market opens for trade in a given period. This is the best period or time to put in or step in to buy as a trader.
Closing price. The closing price is the closing price at which the market closes for trade in a given period.
Highest price. The highest price is the limit or point at which price touches or stops at,during a given period. That is the highest point a market can get to.
Lowest price. This is also the price limit or point at which price touches or stops at during a specific time rate. It is the lowest point a market can get to.
Body. The body of a candle is simple the difference or distance between the opening price and closing price.
Shadow. The shadow is the difference or distance between the closing/opening price and the highest/lowest price. It where buyers and sellers struggle the most.
In conclusion, The Candlestick is a structural representation of the price of an asset which indicates the opening, closing, highest and lowest price of it market over a specific time rate.
It is basically used to determine the technical analysis of assets.
Best regards professor @reminiscence01
All screenshots where taken on tradingview.com