Good day, beautiful Steemians, I am @hadassah26, welcome to my steemit crypto academy season 4 week 4 homework for professor @lenonmc21 on Price Action + Break-Even Technique.


"1. Define in your own words what price action is."
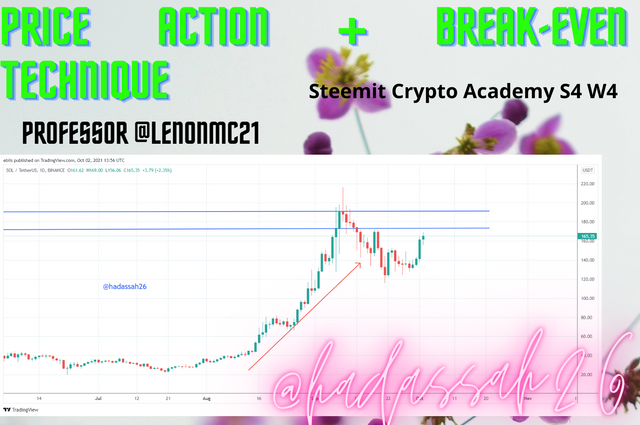
Price action is a technical analysis technique that focuses on analyzing past price movements over time and using them to make predictions on how the price would move next. Unlike technical indicators that are the result of calculations based on past price actions, traders use price action to predict the general market sentiment and hence predict how the price will move.
Price action could be described as a rather unique fundamental analysis tool as it forms the basis for calculations of certain other tools, like technical indicators.
Traders who use price action argue that it's raw and it's the best analysis tool compared to the rest. They don't have to check out other options like fundamental anal as the price action already tells them all they need to know about the market.


"2. Define and explain in detail what the "balance point" is with at least one example of it. (Use only your graphics)"
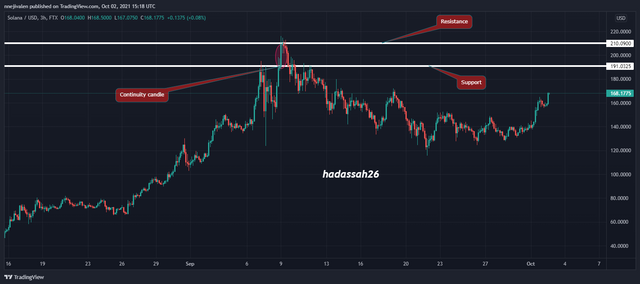
The "balance point" is the last candlestick that marks the end of a retracement. After this point, price continues in the general trend. For example, if the general trend is an uptrend and a retracement occurs, the trend might go down a bit before going back up. The final candlestick in this slight downtrend is identified as the balance point. This is an important point and we draw our horizontal lines on the top and bottom of the candlestick.
Looking at the chart you can see points where I drew my circles. I identified these points as balance points. If we draw a line out from these points, we see a lot of market activity around that area and possible resistance and support zones. These are areas to look out for in the chart when making trading decisions.


"3. Clearly define the step by step to run a price action analysis, with "break-even"?"
In using break-even to run a price action analysis, it would be good to follow these steps.
Define the time frame which works best for you: One has to know what kind of trader he is and decide the appropriate time frame that would be best for him. A scalper for example would be dealing more with hourly or minutes time frames, like the 1-hour time frame. Some could combine different time frames to give them more information on market sentiment. Choose whichever works best for you.
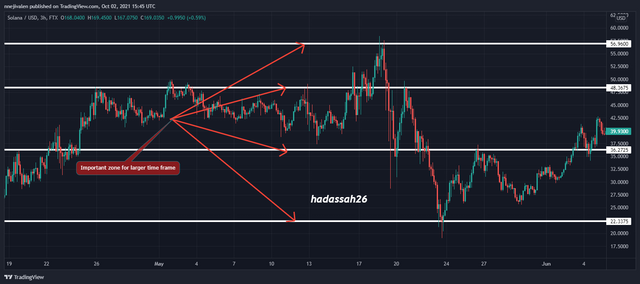
Pick out important points in the chart: One has to determine the support and resistance points and draw horizontal lines, to depict each point. The balance point is also important and we follow the procedure stated above to determine the balance point and also draw out our horizontal lines at the appropriate points.
Identify the trend: We observe the underlying trend, to note if the market is currently bullish or bearish in the time frame chosen. Identifying the trend is important as one could easily get carried away with the retracements and forget the main trend. While doing this, we pay attention to our important points as it is these points that help us know when to enter the market.


"4. What are the entry and exit criteria, using the break-even price action technique?**
This chart below is the chart for the bigger timeframe, in this case we will be using the 3 hour timeframe and the pair of SOLUSD, which we use to determine the trend
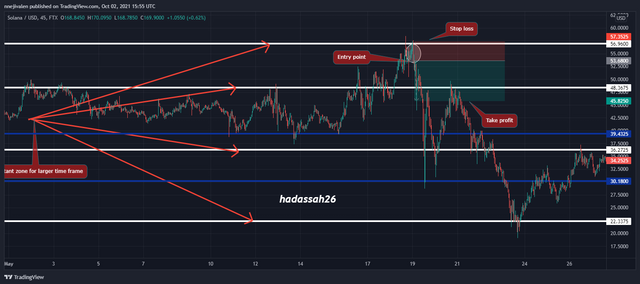
In the Chart below, it is the smaller timeframe of 45mins in a pair of SOLUSD, this chart was used to determine the entry point in the market and from the entry point we can determine our stop loss and take, more details of it can be seen below the chart.
Entry points
After following the steps above, we watch how the price moves. If the market changes direction after the break-even point, then it's time to enter the market. This means that if the retracement is a bearish one and the next candlestick after the balance point shows a large bullish candlestick, then that should be a good entry point.
Exit point:
Stop loss and take profits are always good to be done on a 1:1 ratio. One should set stop loss at the break-even point. When this is done, the take profit is set at the same distance as the stop loss from the entry point in the opposite direction.


"5. What type of analysis is the price action or the use of technical indicators more effective?"
Users who do well with either of them claim the other is more effective. Price action enthusiasts swear that technical indicators are cumbersome and unnecessary and technical indicators enthusiasts claim that price chart analysis is too raw and can be difficult for them.
Price action studies market sentiment in real-time and users make decisions based on this. They study past price actions, which are a result of general market sentiment, especially at important areas like key support and resistance points and equilibrium points, just as we showed above.
Technical indicators on the other hand involve calculations made based on past price actions and users make decisions based on the result of a combination of them on the chart. There's a lot of them useful for different situations and traders who understand them to know which ones work best for them.
People who trade with price action sometimes add one or two indicators to their chart to be able to tell key support and resistance points like the moving averages for example. People who use technical indicators are advised to have some basic understanding of price action as many indicators are formed using price action data.
To me, price action is very effective as people who trade with price action don't even need to bother so much about fundamental analysis and all as every information is displayed in the prices.
Also, in using price action, one works with data in real-time, instead of depending on technical indicators whose data has a lot of lag time.
One can successfully use both effectively also depending on the type of trader he is to achieve better results.


"1. Make one entry in any pair of cryptocurrencies using the price action technique, using the "break-even point." (Use a Demo account to be able to make your entry in real-time, using any time frame of your choice.)"
Looking at the SOL/USDT chart, we try to find out balance points and draw our support and Resistance lines from there.
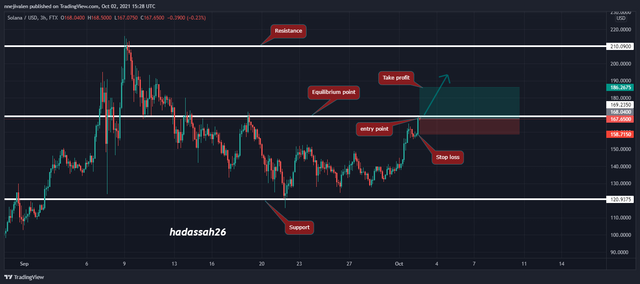

From the chart above, I was able to find my balance point above, highlighted in the rectangle. Drawing out the horizontal lines, we see price trying to break past the Equilibrium point. Once I see a red candlestick, indicating an uptrend, I conclude that the price will cross that line and put in a buy order. If price breaks the line, then it's likely to form a new support zone. I also placed my stop loss immediately after the end of the candlestick above and with the risk to reward ratio of 1:2, I placed my take profit. From the chart, we can clearly see that the trade has already started yielding profit.


Price action is an interesting and long-lasting technical analysis tool, as it forms the basis for many other technical indicators. A lot of people say that it's the most ancient and the best technical analysis tool. It involves knowing certain important points in the chart like the support, resistance and balance point, and patterns.
Knowing how to identify these points and when to enter and exit the market are important in price analysis to be able to use it effectively.
Learning how to work well with price analysis will be very advantageous to the trader in the long run.
Cc: @lenonmc21