Hey Steemit!
Here is my homework post for Professor @nane15. It was a great lesson, and I hope you will enjoy reading my post.
.png)
1. What do you understand by trading? Explain your understanding in your own words.
A trader is a person who is responsible for all the buying and selling of these assets in any financial market. They can buy their assets or trade on behalf of some other individual or any institution. There are a few differences between a trader and an investor. One of the main reasons is the duration they hold on to the assets.
Some of the key takeaways of financial trading are:
- Financial market refers broadly to any marketplace where securities trading occurs.
- There are several kinds of financial markets (but not limited to) such as forex, money, stocks, cryptocurrencies and bond markets.
- These markets may include the exchange of assets or securities.
Due to price fluctuations, most traders usually buy and sell these assets to profit from them. It is crucial to analyze that asset's short-term and long-term price to make a decent profit.
2. What are the strong and weak hands in the market? Be graphic and provide a full explanation.
Strong hands, I would like to repeat some words of our professor from the lecture, "The market is manipulative" and the market is either one way or another, there are two types of players in a financial market, they are "Strong hands" and "Weak hands." A strong hand is a colloquial term used for the well-financed traders and those who dominate the market. These strong hands are mostly big organizations, companies, banks or very organized individuals.
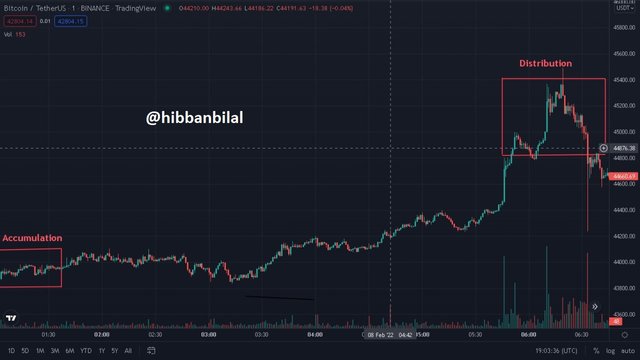
These Strong hands are the key players that can move the market or withstand a short-term setback. All markets consist of these strong hands, but they take on a unique role in future trading. These strong hands always know the right time for buying and selling their assets. These strong hands will buy assets in large amounts. They will set the buy order price higher than they brought it for, which results in the cost of that asset raising; this process is called accumulation, this triggers a bullish trend, and a bullish trend is an uptrend in the price of an industry's stocks or overall rise inboard market.
Now that the uptrend had begun, these professionals started liquidating their assets at a very high price, thus making a profit. This process is called distribution, and it's the same as accumulation. In the screenshot, you can see some signs of accumulation and the distribution phase.
Weak hands, weak hands is a term that is often used to describe traders and investors who lack convictions in their strategies or the resources to carry them out. These weak hands are driven mainly by fear, so they exit their positions quickly on almost any news or event which is considered detrimental to them, which results in losses. These weak hands tend to adhere to rules that make their trading very predictable and are very easily shaken out by normal price gyrations. The result of these rules is that they buy assets at a very high price and sell at a low price and lose their money.
3. Which do you think is the better idea: think like the pack or like a pro?
In a time like this, where the markets are so manipulative, it is better to have a sense of your independence instead of doing what these so-called "crypto influences" say on social media like Reddit, Twitter, etc. It is way better to learn, experience, and take risks to get better with trading, identifying uptrends, and knowing when to buy and sell your assets.
So the conclusion is pretty simple. Think like a pro as thinking like a herd is the worst idea ever, as their decision is driven by emotions which, as I mentioned above, will make you lose your money instead of making a profit. Professionals make profits even from small investments, and the key to that is patience and being serious with your fundamental and technical analysis.
4. Demonstrate your understanding of trend trading. (Use cryptocurrency chart screenshots.)
A trend in a financial market is an overall direction of a market or asset's price. In technical analysis, these trends are called trendlines or price actions that highlight when the price is making higher swings high or higher swings lows for an uptrend or a downtrend.
There are several ways of identifying a trend; one of them was demonstrated by our professor in the lecture, which is using the Elliot wave with the Wyckoff method. Elliot wave theory consists of 5 waves in the impulsive leg and three waves in the corrective leg. When the impulses have been identified, you can now set an open and exit for your positions.
There are a few rules of the starting five waves that are used to identify a trend:
- Wave 2 shouldn't fall below wave number 1
- The length of wave three shouldn't be the shortest. It should look like the most prominent wave.
- Wave 4's peak shouldn't be the same as the peak of wave 1
Trend trading is a trading style used to generate profit by analyzing the moment of an asset in a particular direction. When the cost of an asset moves in one overall direction, up or down means it's a trend. The following screenshot of Investopedia is incredible as it explains trend trading very well.
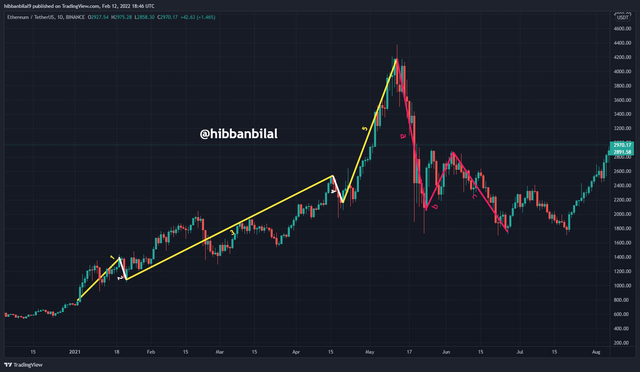
The above image identifies a trend following the Elliot waves theory. You can see that the five waves formed are following the rules of Elliot Waves theory. Wave Number 2 is not below Wave Number 1 and Wave Number 3 is the longest one. Wave Number 4 is also not meeting the peak of Wake Number 1. After that, 3 correction impulses can also be identified in the price action. This shows that the trend has come to an end and you can take an entry in the direction of the reversal.
5. Show how to identify the first and last impulse waves in a trend, plus explain the importance of this. (Use cryptocurrency chart screenshots)
- Identifying the First Impulse
In order to identify the first impulse, we need to identify the last trend formed. The following image shows a complete wave formed on the chart.
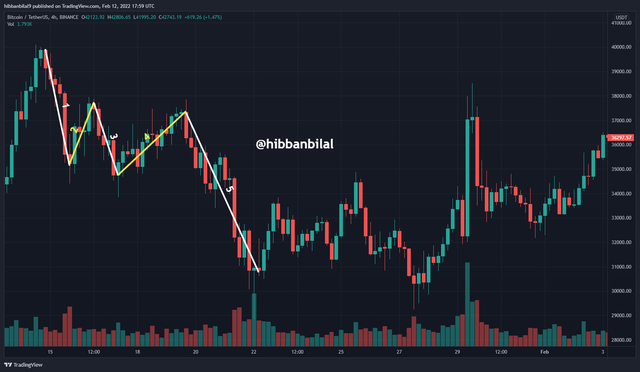
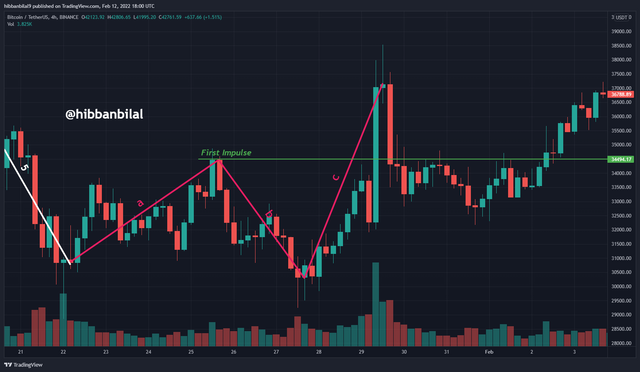
Now, we need to identify the corrective waves after the 5th impulse. The waves a, b and c are formed the same as the previous pattern. The wave b should be below the previous low peak and the wave c should cross the peak of wave a and form a higher peak. This is the scenario in case of a downtrend. Now, wave c is identified as the first impulse.
- Identifying the Last Impulse
In order to identify the last impulse, the price action should be identified according to the Elliot Waves Theory. After the identification of the 5 waves, we then identify the corrective waves. The last corrective wave which is wave c is considered as the last impulse.
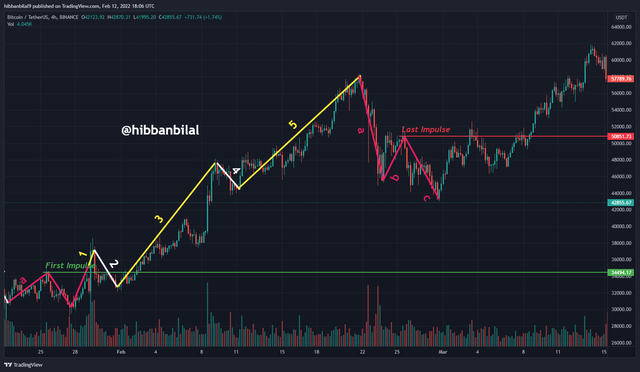
- Important of the first and last impulse
It's important to keep in mind that these impulses are your key to a profitable trade, so considering both of the impulses is very important as when combined, they will show you strong signals that will lead you to generate a profit in the end.
6. Show how to identify a good point to set a buy and sell order. (Use cryptocurrency chart screenshots)
The following image shows a complete long trade setup using the Elliot Waves Theory:
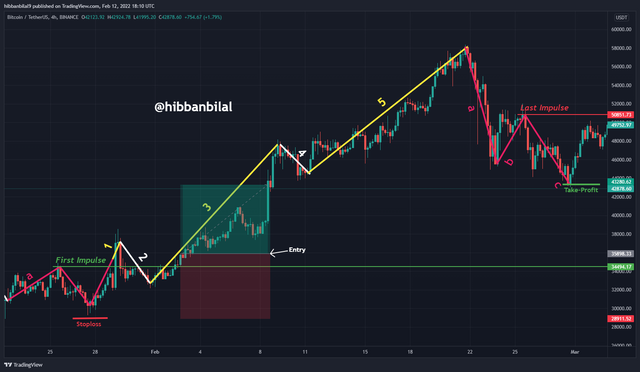
Entry: The entry point is identified after the closing of the candle which breaks the peak of wave "a" and marks the beginning of the first impulse. It is a good entry point and a potential entry can be taken here.
Target: We mark our target at the last impulse as this marks the ending of the previous trend. So your take-profit should be placed here in order to exit the market at the right point.
Stoploss: In a good trade setup, stop loss is essential to minimise our risk on the trade. We will place our stop loss below the lower peak of wave "b" as the pattern would most probably become invalid if it goes below this point.
7. Explain the relationship of Elliott Wave Theory with the explained method. Be graphic when explaining.
Elliot wave theory played a vital role in this method, as we used it to identify the first and second impulses. After identifying the impulses, we set up an open and exit point for our positions to make a profit. We were able to determine when a downtrend was about to start to weaken. In the following screenshots, you can see at what point a downtrend starts and at what t point it starts to weaken, and it was all possible because of the Elliot wave theory.

So in the end, it is evident that technical analysis and fundamental analysis both are critical as knowing an asset that you want to trade or make an investment on, and you need to know how to check the graphs as it plays a significant role in the prices of an asset or stock. The traders need to find the points in a price range for determining the point of buying and selling an asset to get a favourable profit. I'd thank Professor @nane15 for teaching us such an amazing lesson. Thanks.
