Hey Steemit!
Here is my homework post for Professor @reminiscence01. It was a great lesson, and I hope you will enjoy reading my post.
.png)

1. Explain Confluence trading. Explain how a trade setup can be enhanced using confluence trading.

We know that we can just predict the market, not script it. The fact that we cannot script it means that no indicator can provide a 100% chance of our prediction getting successful and thus winning us the trade. But, in order to minimize the risk while taking the trade, we can use multiple indicators.
While using multiple indicators, if they give us the same signal, then there are more chances of our prediction getting right, and thus our trade getting successful. If those indicators do not show confluence with each other, then we have an idea that the prediction provided by one indicator can be false. So the usage of multiple indicators to confirm a signal or prediction on the chart is called Confluence Trading.
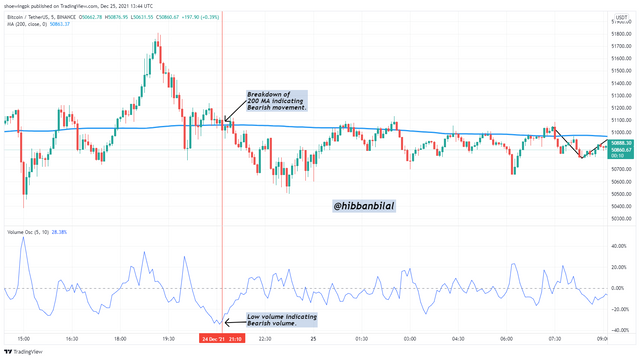
In the chart above, it is seen that the price candle has broken the 200MA, which was acting as a support to it. Its breakdown indicates a bearish movement. Now, to confirm if the signal of a bearish movement in the market is correct, I used another indicator.
I used the Volume Oscillator to confirm the signal. The Volume Oscillator is showing a low volume at the time of breakdown; a low volume indicates a bearish movement. Therefore, we now have two confluences supporting the signal and thus making our signal more reliable. You can also see that the price followed a bearish movement after the breakdown.

2. Explain the importance of confluence trading in the crypto market?

Importance of Confluence Trading
Confluence Trading is really important as it helps us as it is an approach made by traders to confirm if their prediction is correct or not.
The use of Confluence Trading confirms if the signal achieved by a single indicator is correct or not. This saves him from getting the wrong trade and losing his investment.
The usage of multiple indicators help to get a reliable signal and thus a reliable trade setup. We know that no indicator can script the market, so the usage of multiple indicators help us to make our trade setup strong. This increases the chances of our signal getting correct, and thus it makes our trade successful.
When a trader uses multiple indicators around the chart, he can find some good combinations of indicators for himself. This makes his trading experience good, and he can have his own strategies to get better trades.
We can also detect false breakouts in the chart by using other indicators in confluence. This helps us avoid poor entry points, and we can later enter the market at a potential entry point.

3. Explain 2-level and 3-level confirmation confluence trading using any crypto chart.

It is an obvious thing that the more you confirm a signal, the more reliable it becomes. Therefore, the more confluences you use, the more reliable your signal will become. Now let's talk about two types of Confluence Trading, 2-level Confirmation Confluence Trading and 3-level Confirmation Confluence Trading.
2-level Confirmation Confluence Trading
This type of Confluence Trading involves using at least two indicators to confirm your signal. You use one indicator to get a signal and then the other to confirm if the signal is correct. It helps you to achieve a better trade setup. It is good for those people who want fewer indicators on their chart and trade simply. It is suitable for beginners too.
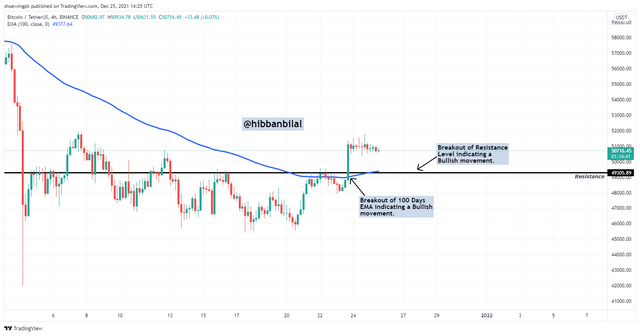
Below is the chart of BTCUSDT on a 4-hour timeframe. In this chart, 2-level Confirmation Confluence Trading is used. We first used the Market Structure as an indication. You can see that there is a support level marked on the chart. The breakout of this support level indicated a Bullish movement.
We used another indicator, 100Days Moving Average, to confirm the signal. When we applied the MA on the chart, we could see that it had already been broken. The breakout of the MA indicates a Bullish movement. Therefore, by using 2-level Confirmation Confluence Trading, we confirmed the Bullish signal.
3-level Confirmation Confluence Trading
In this type of Confluence Trading, you use at least three indicators in confluence to confirm your signal. It is more reliable than 2-level Confirmation Confluence Trading as it uses more indicators. You use one indicator to get a signal and the other to confirm the signal. The chances of your signal getting right through this type of confluence trading are very high.
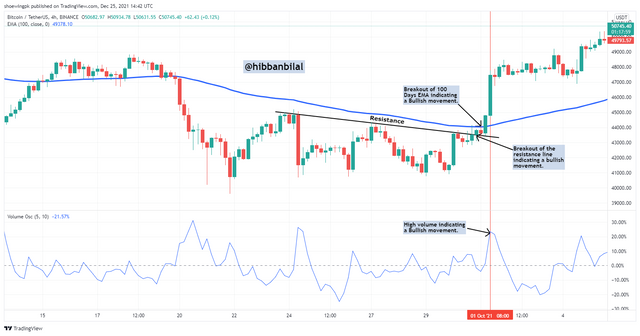
In the chart below, of BTCUSDT on a 4-hour timeframe, we have used 3-level Confirmation Confluence Trading. The Market Structure is used first as an indication. We can see that a resistance acting on the price action is broken. This indicates a Bullish movement.
To confirm this signal, we used the 100 Days Moving Average. The MA has been broken, and its breakout indicates a Bullish movement. To confirm the signal again provided by the previous two indicators, we use a third indicator which is Volume Oscillator.
The Volume Oscillator shows a high volume which indicates a Bullish movement. We can see that all three indicators provide the same signal, so we get a strong trade setup here by using the 3-level Confirmation Confluence Trading.

4. Analyze and Open a demo trade on two crypto asset pairs using confluence trading. The following are expected in this question.
- a) Identify the trend.
- b) Explain the strategies/trading tools for your confluence.
- c) What are the different signals observed on the chart?

Demo trade on XRPUSDT
The first asset on which I will open a demo trade is XRPUSDT. I used the 4-hour chart to analyze the chart and used 2-level Confirmation Confluence Trading.

a) Identify the trend.
The trend that the market is following is an overall Bullish trend. Though, the recent price of candles is bearish.
b) Explain the strategies/trading tools for your confluence.
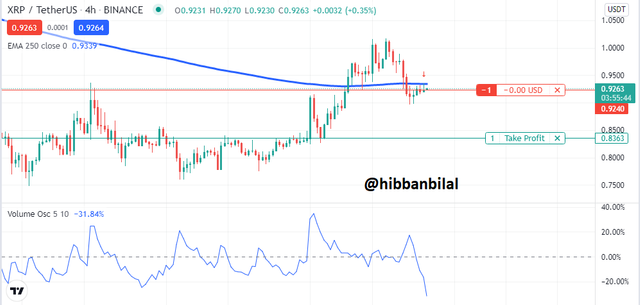
It is visible in the chart that I have used two indicators, 250Days Moving Average and Volume Oscillator.
I applied 250DAYS MA on the chart. It can be seen that the price has broken the Moving Average. The breakdown of the Moving Average indicates a Bearish movement in the price.
In order to confirm the signal provided by the Moving Average, I used the Volume Oscillator. You can see in the chart that after the breakdown of the Moving Average, the Volume started decreasing and it got low. A low volume indicates a bearish movement in the price. Therefore, the Volume Oscillator confirmed the signal provided by the Moving Average.
c) What are the different signals observed on the chart?
The two confluences, a low volume and the breakdown of Moving Average, indicates that the market will be moving in a Bearish trend now.
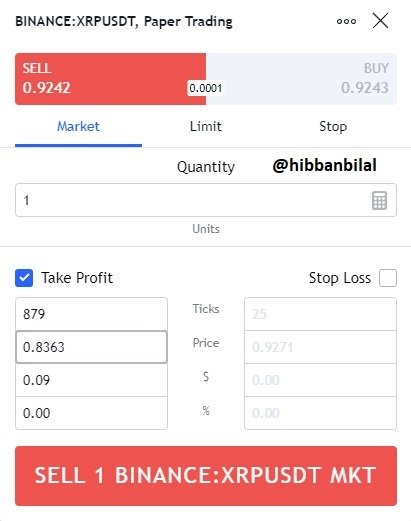
As the price will follow a bearish trend, I will be opening a short position in the market. The following picture shows my target value, and the chart shows that the demo trade has been executed.
Demo Trade on SOLUSDT
The second asset that I will be opening trade on is SOLUSDT. I used a 4-hour timeframe to analyze the chart, and in this asset, too, I used 2-level Confirmation Confluence Trading.
a) Identify the trend.
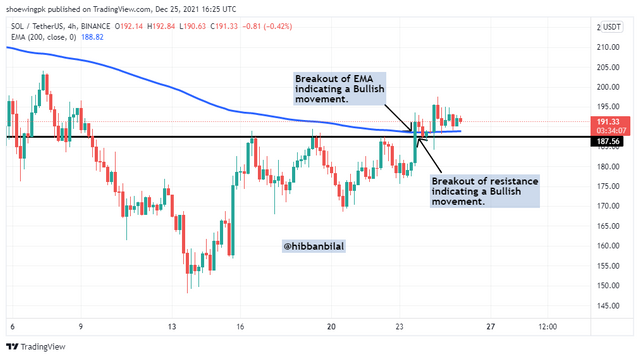
It is seen on the chart that the overall trend in the price action is Bullish. Though, the market has moved in a range in between.
b) Explain the strategies/trading tools for your confluence.
As seen in the charts, I have used the Market Structure and a 200Days Moving Average.
First, I noticed a horizontal resistance on the chart and therefore, I drew a resistance line. I saw that the price action had broken the resistance line, indicating a bullish movement. So I decided to use another indicator to confirm my signal.
The second indicator that I used was a 200Days MA. The price has broken the MA, which was acting as a resistance to it. Thus, it indicates a bullish movement. This shows that the Moving Average has confirmed the signal provided by the change in Market Structure.
c) What are the different signals observed on the chart?
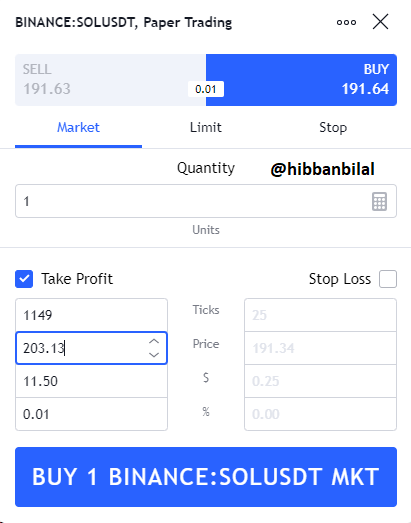
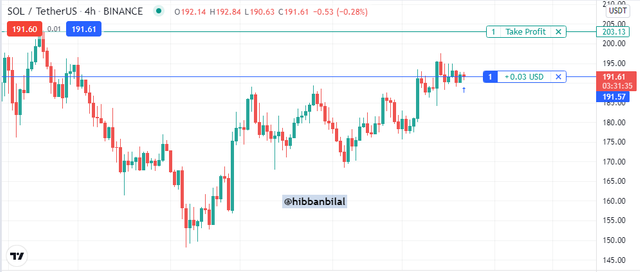
The two confluences used, the breakout of MA and Resistance line, indicates a bullish movement in the price. Therefore, I will be opening a long position in the market. The target value is shown in the picture below, and the proof of execution of the order is shown in the chart below.


As a trader, your focus is to earn more and lose less. Confluence Trading helps us to confirm our trading signals and thus achieve a more reliable trade setup. The more confluences you have, the more are the chances of your trade getting successful. But, no matter how many confluences you have, you can never script the market. Therefore, along with using confluences, you should also place your stop-loss to minimize the loss in case your prediction goes wrong. It was an amazing lesson, and I thank Professor @reminiscence01 for providing us with such an amazing lesson.
Hello @hibbanbilal, I’m glad you participated in the 6th week Season 5 of the Beginner’s class at the Steemit Crypto Academy. Your grades in this task are as follows:
Observations:
Correct.
Recommendation / Feedback:
Thank you for submitting your homework task.
Downvoting a post can decrease pending rewards and make it less visible. Common reasons:
Submit
@steemcurator02
Downvoting a post can decrease pending rewards and make it less visible. Common reasons:
Submit
@steemcurator02
Downvoting a post can decrease pending rewards and make it less visible. Common reasons:
Submit
@steemcurator02
Downvoting a post can decrease pending rewards and make it less visible. Common reasons:
Submit
@steemcurator02
Downvoting a post can decrease pending rewards and make it less visible. Common reasons:
Submit
@steemcurator02
Downvoting a post can decrease pending rewards and make it less visible. Common reasons:
Submit