Hey Steemit!
Here is my homework post for Professor @utsavsaxena11. This was a great lesson, and I really hope that you will enjoy reading this post.
.png)

1. Explain Head and Shoulder and Inverse Head and Shoulders patterns in detail with the help of real examples. What is the importance of volume in these patterns(Screenshot needed and try to explain in details)
In trading, we have a lot of patterns to help us determine the movements of the market. Among these patterns are the Head and Shoulders and the Inverse Head and Shoulders patterns. These are basic patterns and are very popular in trading. They indicated trend reversals, and the prediction is very strong. So let’s take a look into them one by one.
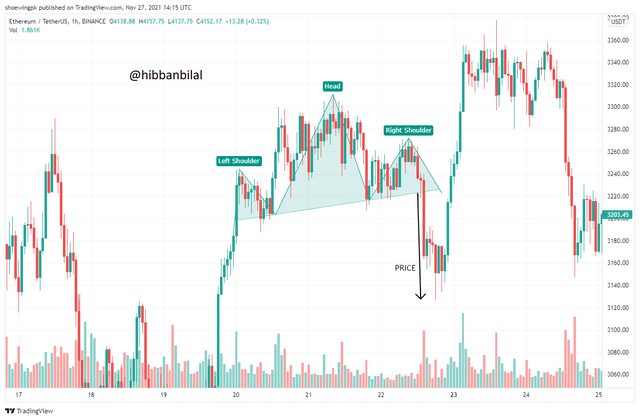
The head and shoulders are a trend reversal pattern that indicates the change in trend from bullish to bearish. The pattern takes time to form but has a very strong indication, and there’s a very less probability of it going wrong. As the name suggests, it has one head and two shoulders.
Formation of the Pattern
The first shoulder is formed when the price rises, making a peak, and then the price comes back. Then, the head is formed as the market makes a peak above the previous high and the price again falls back. Finally, the second shoulder formed as the price makes another peak, previous then the peak of the head, and the price falls back.
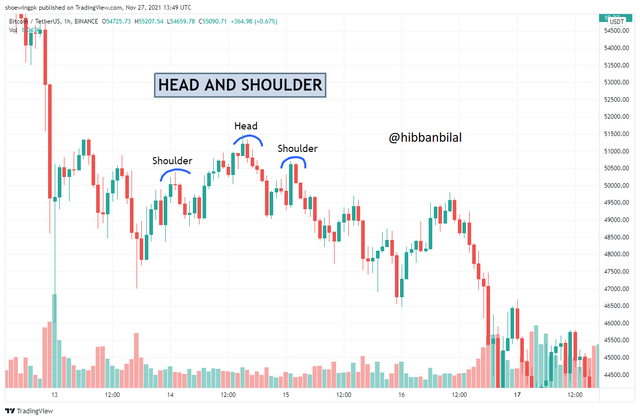
This completes the pattern, but it is not obvious that this pattern will be formed accurately as it is quite unusual. You can see disturbances or fake-outs in the pattern, which you should avoid.
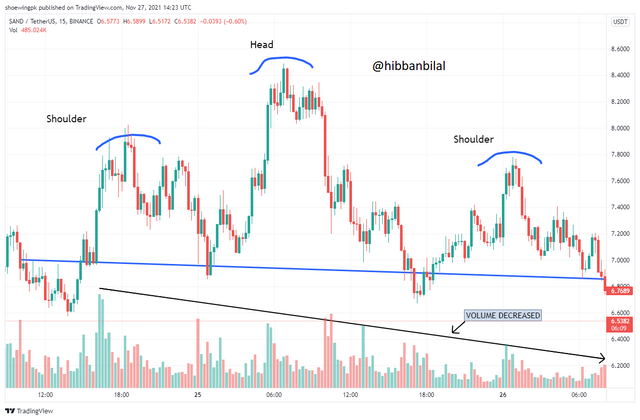
Effect of volume
After the formation of a left shoulder, if we compare the volume before and after its formation, it is seen to be decreasing. Similarly, after the formation of the head, we can see a further decrease in the volume. Finally, after the formation of the second shoulder, the volume here further decreases. Such a decreasing volume indicates that buyers are no longer interested in the market, and the sellers are dominating them. This leads to a bearish trend, as the head and shoulder predict.
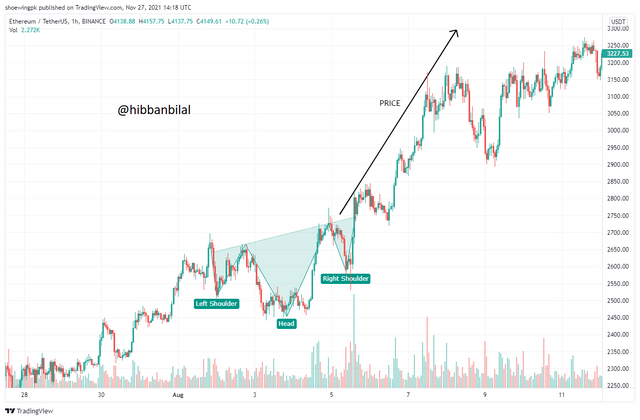
As the name suggests, inverse, you can easily predict that it is the opposite of the Head and Shoulders pattern, and so it is. This pattern also consists of two shoulders and a head, but in the opposite direction. Also, its indication is opposite of that of the Head and Shoulders. It means that the Inverse Head and Shoulders indicate a trend reversal from bearish to bullish.
Formation of the Pattern
Now let’s talk about how this pattern is formed. The first shoulder is formed when the price falls, making a lower peak, and then the price rises. After that, the formation of a head is seen when the price falls again, making a peak lower than the previous peak, and rising up again. Finally, the pattern gets completed when the second shoulder is formed by making another lower peak but not lower than the peak of the head.
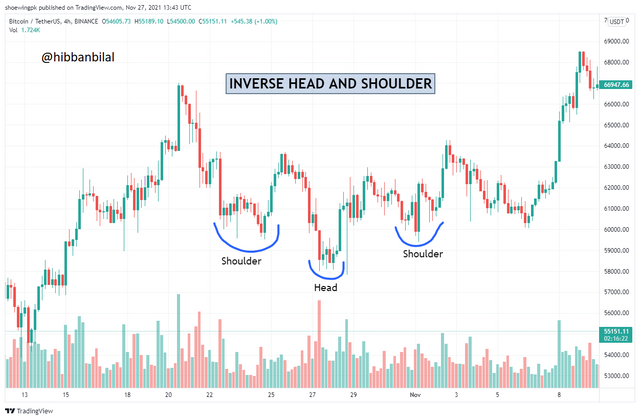
We previously discussed the disturbances made in the Head and Shoulders pattern, which restrict it from being completely perfect. The same goes for the inverse head and shoulder; it also has disturbances, and therefore, it is not usually seen to be perfect.
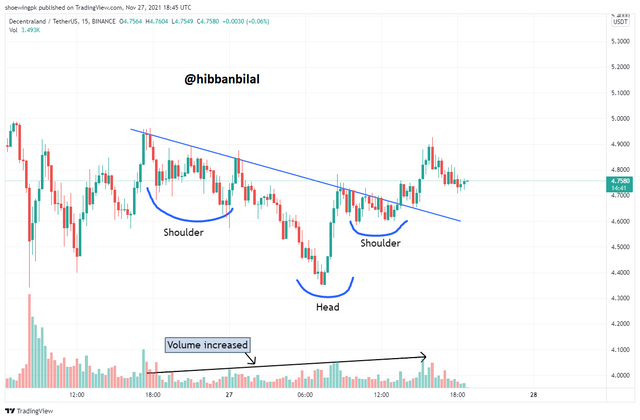
Effect of volume
As the formation of the first shoulder gets completed, the volume is seen to be increased. Then, after the formation of the head, a further increase in the volume is seen. Finally, as the pattern completes with the formation of the second shoulder, the volume is seen to be more increased. This means that the buyers are getting optimistic, and they are dominating the sellers. This indicates a bullish trend, as suggested by the Inverse Head and Shoulder pattern itself.
2. What are the psychology of market in Head and Shoulder pattern and in Inverse Head and Shoulder pattern (Screenshot needed)
The psychology of the market defines the movement of the price of an asset. The price of the asset increases when the buyers are in control of the market. Similarly, the price decreases when the sellers are in control of the market.
The psychology of the market varies with each sub-pattern of Head and Shoulder. If we talk about the first shoulder, we can see that at the beginning of the left shoulder, the buyers are seen to be dominating as the price increases. Then, the sellers come into action, which leads to the price getting retested.
In the case of the head, the buyers are seen to be optimistic as a high greater than the previous high is formed, though, at this point, the number of buyers interested in the market has decreased. After this, the sellers come in domination as they retest the price back.
Finally, as the formation of the second shoulder starts to begin, the buyers are again seen to be in control of the market as the price starts to increase. But, the sellers come into action and retest the price.
By the time this whole pattern is formed, the volume is decreased. Therefore, it can be said that the buyers are no longer interested in this market, and the sellers will be the ones dominating now. Thus, starting a bearish trend.
We have different psychology of market in the case of the Inverse Head and Shoulder pattern.
As the first shoulder begins to form, we see the sellers in action as the price of the asset is seen to decrease. This does not last for long as the buyers dominate the sellers leading to a retest in the price.
Now, if we talk about the formation of the head, we can see that the sellers are optimistic at the beginning, which leads to a decrease in price. This creates a low beneath the previous low. The price then begins to retest as the buyers dominate the sellers.
Finally, as the second shoulder starts to form, the sellers are again seen to be in action as the price decreases. But once again, the buyers overtake the sellers causing a retest in the price.
During the time of the pattern getting completed, an increase in the volume is seen. This means that the buyers are getting optimistic, and they have taken over the sellers. This indicates a bullish trend, as suggested by the Inverse Head and Shoulder pattern itself.
3. Explain one demo trade for Head and Shoulder and one demo trade for Inverse Head and shoulder pattern. Explain proper trading strategy in both patterns separately. Explain how you identified different levels in the trades in each pattern(Screenshot needed, and you can use previous price charts in this question)
Below, we have a chart of BTC/USDT in a one-day timeframe. We can notice a formation of the Head and Shoulders pattern here.
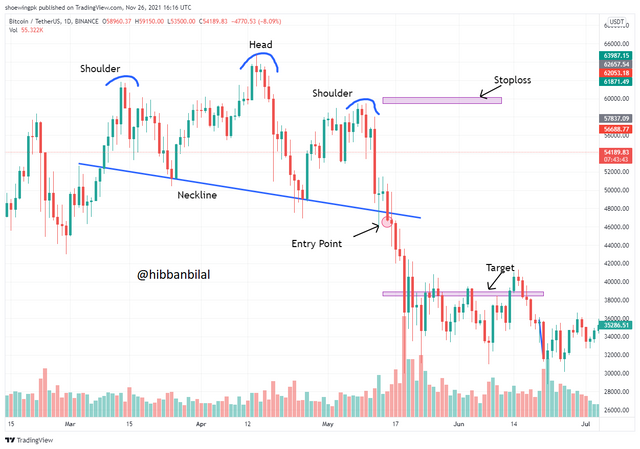
These are the steps that were followed while carrying out this trade using the Head and Shoulder pattern:
After identifying the pattern, draw a neckline by joining the low of the first shoulder with the low of the head. Keeping them joined, you can extend the line so you can identify the break of structure.
After the candle breaks the neckline, wait for it to close. If the candle closes below the neckline, meaning it breaks it, then you can take your entry at its closure point.
Calculate your target using the following formula and set your target accordingly:
Head peak point - Low point of any shoulder = Target Level
Now, once you have calculated your target, you will place a stop loss to manage your risk. You will place the stop-loss above the right shoulder.
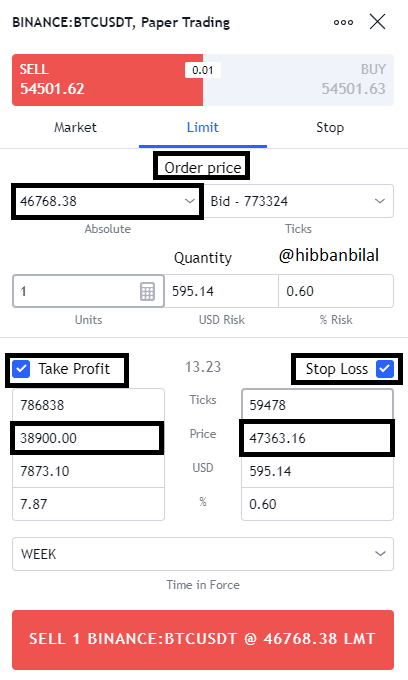
Following are the trade details for this trade:
Entry: 46768.38
Target: 38900
Stoploss: 47363.16
This is how we take a trade using a Head and Shoulder pattern.
We have a chart below of BTC/USDT on a 1-hour timeframe. A formation of an Inverse Head and Shoulder can be observed in the chart.
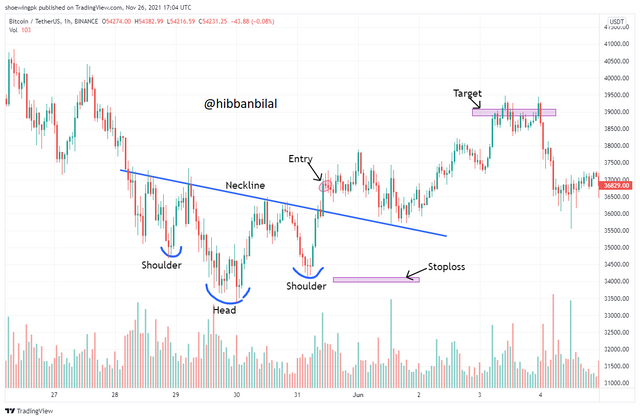
In order to carry out the trade using the Inverse Head and Shoulder pattern, you need to follow these steps:
You need to draw a neckline by joining the two highs, one formed after the left shoulder and the second one formed after the head.
Once you have drawn the neckline, you wait for it to break. If the candle breaks the neckline and closes above it, this confirms the breakout
Now, you set your target level by calculating it using the following formula:
Lowest Head peak point - High point of any shoulder = Target
Now, when you have calculated the target, you then place your stop loss to manage your risk. You will place the stop-loss above the right shoulder.
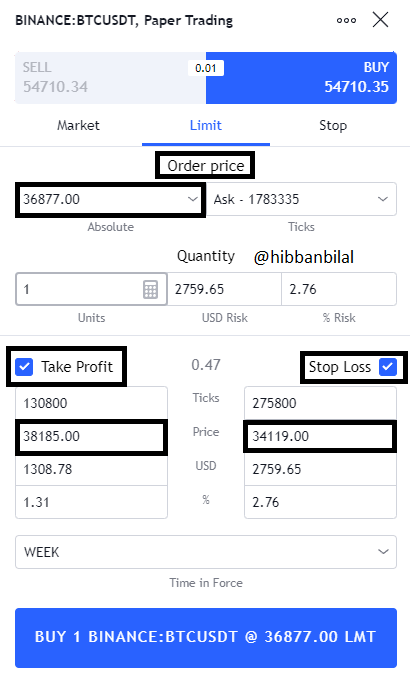
These are the trade details for this trade:
Entry: 38185
Target: 36877
Stoploss: 34119
This is how we carry trade using an Inverse Head and Shoulder pattern.
4. Place 1 real trade for Head and Shoulder(atleast $10) OR 1 trade for Inverse Head and Shoulder pattern(atleast $10) in your verified exchange account. Explain proper trading strategy and provide screenshots of price chart at the entry and at the end of trade also provide screenshot of trade details.(Screenshot needed.)
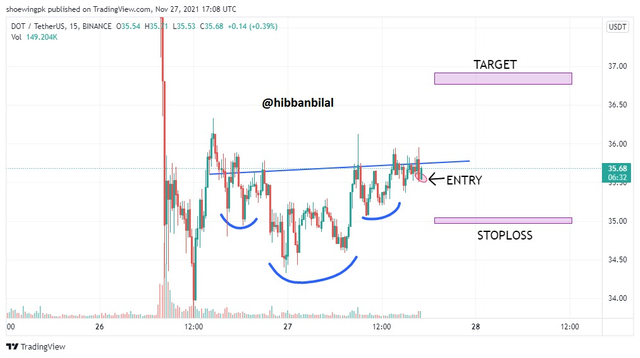
For this question, I chose the pair DOT/USDT as there was a formation of an Inverse Head and Shoulder on the 15 minutes timeframe.
In the chart below, you can see the formation of an inverse head and shoulder. The neckline had already been broken, so now I had to take the entry. But before taking the entry, I calculated my Target and marked it. After that, I placed a Stop-loss below the right shoulder. I noted down the Target and Stop-loss values.
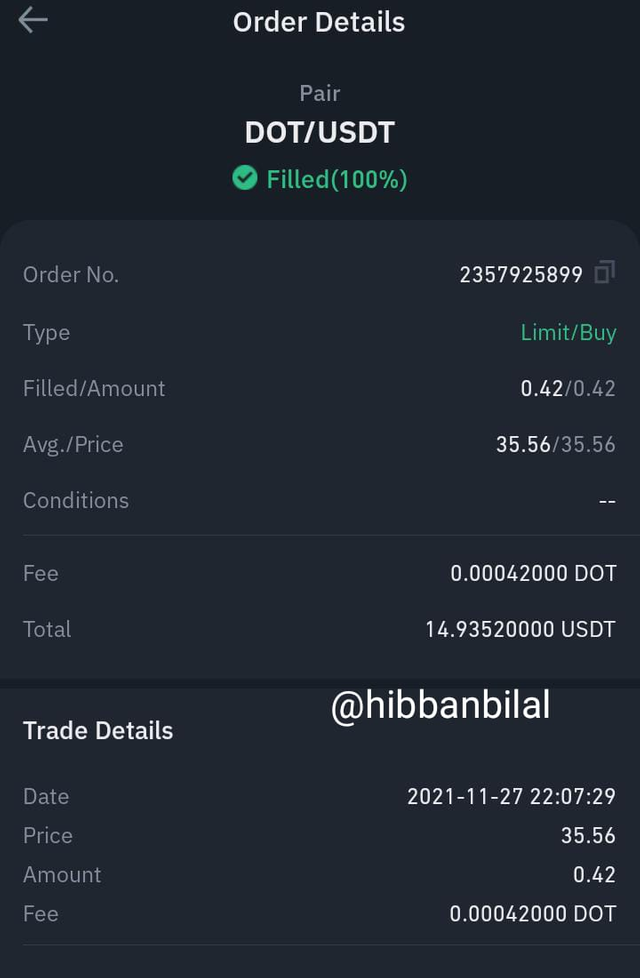
After that, I logged into my Binance account to buy DOT/USDT. I placed my buy order on the current value of the market, and therefore, it quickly got executed. The confirmation and the details of the order are shown in the screenshots below.
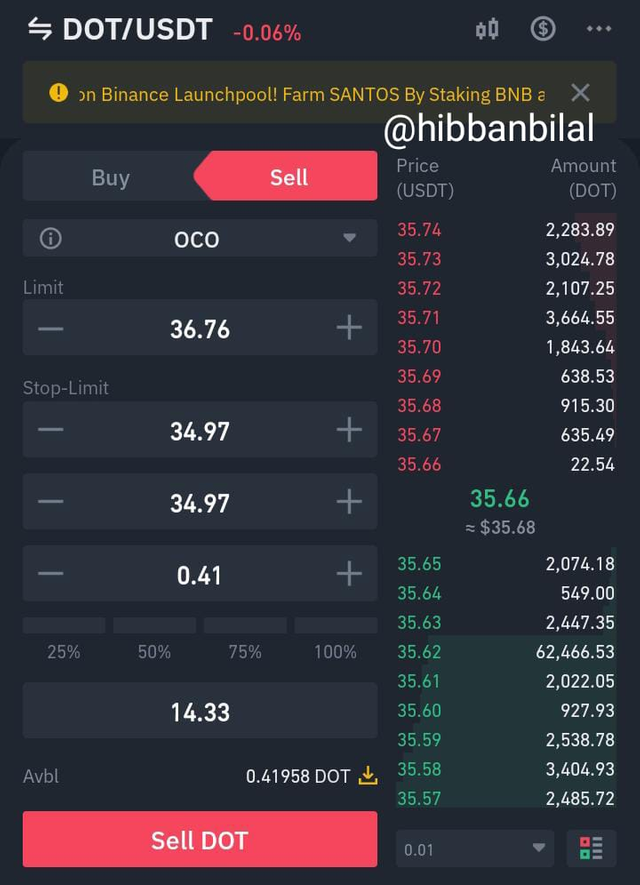
Then, I placed an OCO order. I set my target and the stop-loss limit. The details of the order are shown in the screenshots below.
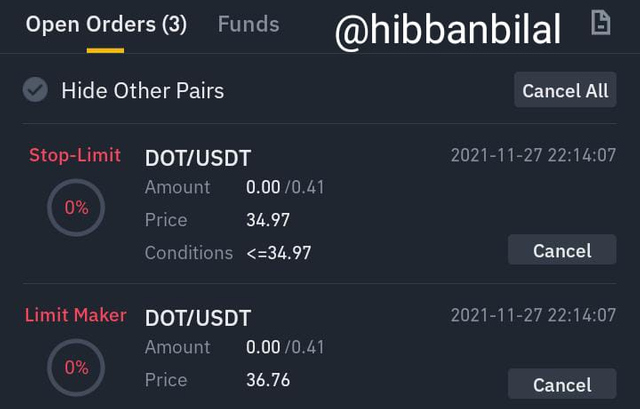
Following are my trade details:
| Details | Price |
|---|---|
| Entry | 35.56 |
| Target | 36.76 |
| Stoploss | 34.97 |
Patterns are an essential part of trading. These patterns, Head and Shoulders and Inverse Head and Shoulders are easy patterns to predict the market. The risk-reward ratio in the trade executed using this pattern is also good. Knowledge of these patterns can help you get good trades and, therefore, good profit, but you also have to manage your risk. I thank Professor @utsavsaxena11 for such an amazing lesson.
Trade Finished - Stoploss hit
The target did not hit but I had managed my risk so I did exit with minimal loss.
Chart Screenshot:
Trade Screenshot
Downvoting a post can decrease pending rewards and make it less visible. Common reasons:
Submit