 Image made from canva
I am glad to welcome every one of you to this post as well as professor @sachin08 for his class with us in this institution. This lesson is focused on Simple Patterns In Trading

Question 1: What is your understanding about Triangles in Trading. Explain all forms of triangles in your own words. (Screenshot required) 
A triangle in trading can be classified as a continuation pattern, also chart pattern is illustrated when trendlines are drawn in a line with the length of a price range approaching each other at a point, and this shows a break in the trend.
This pattern is named triangle because of the convergence of the upper trendline and the lower trendline at the acme right side which forms an angle. When these trendlines are connected at their beginning, the formation of the triangle is completed and the other two angles are formed. To form the upper trendline, the highs are connected while the lows are connected to form the lower trendline. Triangles can be described in relation to support and flags also, if the validity has been checked and proven, it can be a continuation reversal pattern. The ascending, descending and symmetrical triangles are the three different probable triangles that can be formulated with price action to perform a series of turns with pivoting.
Types of Triangles 
- Ascending Triangle
This category of the triangle is a breakout pattern and a bullish formation that is formed when the price joins the upper trendline which is horizontal joins with the increasing volume. In the ascending triangle, the upper trendline is expected to be a resistance level thereby give providing a horizontal line. Also, the lower trendline shows higher lows and eventually forms an increasing diagonal.
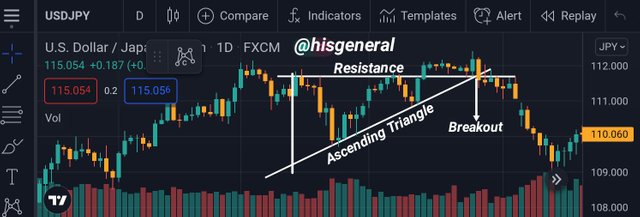 Ascending Triangle
From the above triangle, the lower trendline shows higher lows resulting from an increase in buyer's purchasing pressure but as investors surge in the asset above the resistance price level as they run out of patience, causing an increase in purchasing pressure as the uptrend continues. Consequently, the trendline now serves as support which formerly was resistance.
- Descending Triangle
When the ascending triangle is turned upside down, it gives the descending triangle which is perceived as a breakdown pattern. In this case, it is the lower trendline that is horizontal and joins close similar lows. Looking at the descending triangle, the upper trendline is in decreasing nature in the direction of the apex hence forming a diagonal.
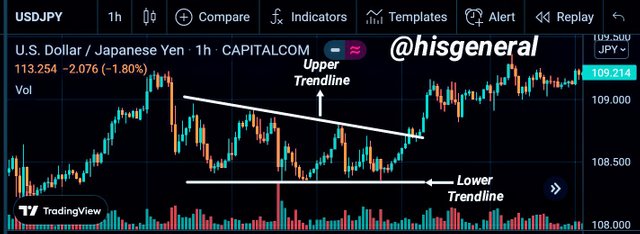 Descending Triangle
As soon as the declines through the lower horizontal trendline support, breakdown takes place resulting in downtrend continuation hence, the trendline becomes resistance which formerly was the support.
- Symmetrical Triangle
This type of triangle is comprised of a falling upper trend and a rising lower trend, all being diagonal. As the trend of price continues, it will either breach the upper trendline for a breakout as well as uptrend on increasing prices or breach the lower trendline constructing a breakdown as well as downtrend having declining prices.
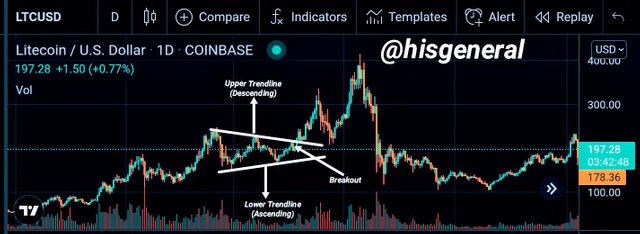 Symmetrical Triangle

Question 2: Can we also use some Indicators along with it Triangle Patterns? Explain with Screenshots. 
The triangle pattern can be used along with some other indicators one of which is Moving Average.
There isn't any understanding of how long a trend may last, therefore the concept of tracking stop-loss is that you track your stop loss and seize your gain as the market drives in your benefit.
The Moving Average as an indicator can be used to trail stop loss. You can track your stop loss with the use of the 50-period MA implying that you maintain your stand up to the time when the market will break and shut below the 50-period MA
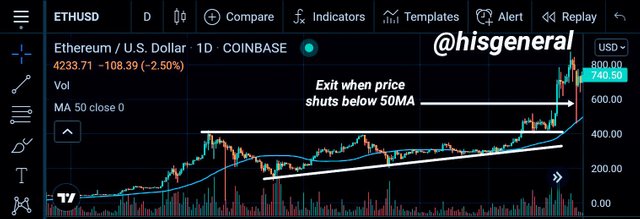

Question 3: Explain Flags in Trading in your own words and provide screenshots of both Bull Flag and Bear Flag. 
Flag derived its name from ifs appearances like a flag or flagpole. It is a price pattern that moves in the opposite direction of the price trend which is in a longer period of time on a price chart. When the market reduces having the opposite sides close in a range following a quick move, a flag chart pattern is constructed. Normally, flags are not large implying moderately small risk and fast gains or profits. The triangle that forms the flag pattern which is the consolidation is adjoined to the pole which is the big, swift move.
The move that comes in advance of the flag pole is usually a sharp one and almost vertical and evidently larger and quicker than the current price move earlier than it. This sudden and quick price movement indicates a great buying or selling pressure and the reason for a breakout from the flag formation.
Bull Flag
A bullish flag is one formed by duo trendlines separated that is not joined as a result of a short interval of retracement which is consolidation. The bullish flag pole is formed on a steep price sharp peak whilst sellers are taken by surprise by buyers, in that case, a pullback that has corresponding upper and lower trendlines forms the flag. The price action of the bull flag increases at the time of the incipient move of trend and concurrently falls through the area of consolidation. There is not always a high volume surge of the breakout but it suggests that the stock has been entered with refreshed excitement by investors and traders.
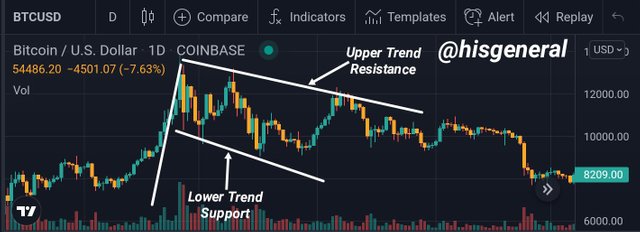 Bull Flag
Bear Flag
The volume in the bearish flag does not constantly fall for the period of the consolidation, the reason being that the downward movement of the trending price of the bearish flag is often propelled by the fear and tension of investors over declining prices. The more price declines are the more persisting investors require to take immediate action.
Consequently, rising volume patterns are what describe these moves. During the time that the downward movement of price is halted, there may not be a decline of the rising volume, contrarily, on the other hand, hold at a level, indicating a break in the level of uncertainty. Due to the already raised levels of volumes, there may not be enunciation of downward breakout as in the bullish.
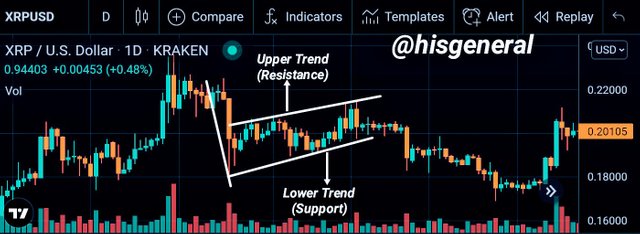 Bear Flag

Question 4: Show a full trade setup using these Patterns on any Cryptocurrency chart. (Ascending Triangle, Symmetrical Triangle, Bear Flag) 
Ascending Triangle Trade Setup
Trading with the triangle pattern requires a good level of attention and care. To take full advantage of the triangle the trend of the market ought to be bullish. When the upper trendline which is usually horizontal meets the resistance, the pattern is configured. The corresponding lower trendline is usually ascending, and these two trendlines are properly placed, the price can be expected to break through to the upside.
Entry is anticipated to be at resistance as soon as the trendline is broken and the stop loss appears at the lower trendline which is the support.
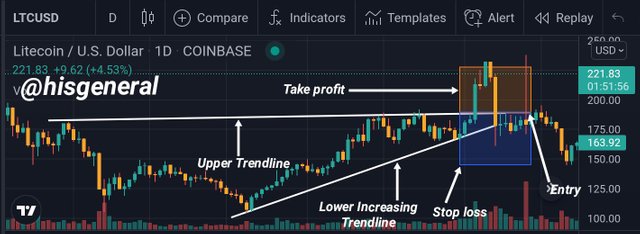 Ascending Triangle Trade Setup
Symmetrical Triangle Trade Setup
The symmetrical triangle is seen to range between the bull and bear trend hence can be said to be neutral this implies that it forms either of the duos but imperatively, the breaking area relies on the current trend, therefore, one should be able to ascertain the trend formed by the pattern.
For the symmetrical and in respect of the trend, there is usually a rally either up or down. When the pattern is bullish, the rally is upside hence the consolidation is expected to form the symmetrical pattern. As already stated, the pattern is formed by the trendlines. In this case, dissimilar to the ascending triangle, the upper trendline comes descending while the lower trendline is ascending and of course price break is anticipated once the trendlines are put in place.
Another point worthy of note is that the resistance line serves as the entry point and the stop loss is the descending lower trendline that comes below the support.
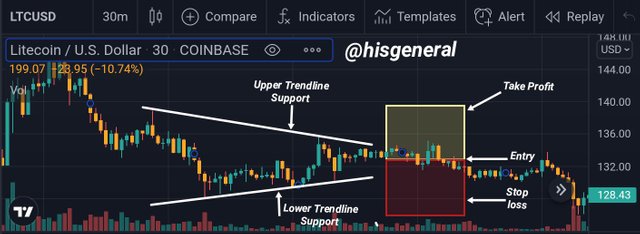 Symmetrical Triangle Trade Setup
Bear Flag Trade Setup
The flag pole has to be in place for trading to occur with the bear flag, this takes place in a bearish market and the coalition that sets the flag pattern will be expected as soon as the pole is set.
Trendlines ought to be drawn to engage the highs and lows as soon as there is the formation of the consolidation. When these trendlines are drawn, the next is to stay for the breaking of the lower trendline by the price to the downside. The support is where the entry is positioned while the stop loss is spotted higher than high.
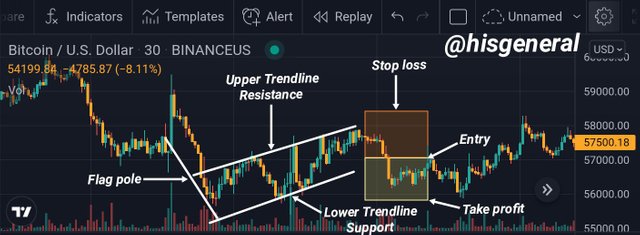 Bear Flag Trade Setup
Conclusion 
In trading, chart patterns are among the very important tools for technical analysis traders can rely on in making predictions or forecasts of price. This week's lesson, among the numerous pattern, took a tour on the triangle patterns and flags emphasizing ascending, descending, and symmetrical as the three main categories of the triangle pattern. While the ascending and descending triangles may be influenced, the symmetrical seem to be neutral and for the flag pattern, it can be either bullish or bearish, each occurring in its market.
A big thanks to you professor @sachin08 for the lesson, it was quite impactful.
Note: All screenshots except otherwise stated are taken from my TradingView app
Cc:
@xkool24