
INTRODUCTION
Greetings to all, It a wonderful opportunity to participate in this weeks lectures series. In this week, a topic based on "Technical indicator" has been discussed and presented by Professor @reminiscence01. Therefore, I will be giving answers to the questions that has been allotted in the homework task in this submission, Let's begin:

IN YOUR OWN WORDS, EXPLAIN TECHNICAL INDICATORS AND WHY IT IS A GOOD TECHNICAL ANALYSIS TOOL

In my own understanding, Technical indicators are tools of which has graphical or mathematically depiction used in analyzing and predicting of current and past market movement or behaviors by traders within the cryptocurrency market system. Literally, at first sight within the crypto market charts, it is complicated because of the combination of both the mathematically formulas and the quick change in chart movement of which cannot be easily explained or understood by a lay-man.
Hence, with the invention of technical indicators which are numerous and programmed, the possibility for a trader to understand a market chart as to the coins or token data analysis, price and volumes future and current prediction and movement are made available.
These technical indicators can be said to be a good technical tool for analysis because it offers identifiable signals to traders who are active on their game in opportunities which their as trader can enter the market with full confidence and of when the trader is expected to exit the market not to loss but make profit. it is also used to check up on activities made in trading and after evaluation provide trends of a chart behavior with a reflection from a price movement.

ARE TECHNICAL INDICATORS GOOD FOR CRYPTOCURRENCY ANALYSIS? EXPLAIN YOUR ANSWER

For me, the answer is yes
This is because technical indicators has been an effective mechanism by which traders analysis cryptocurrency data both in it trends, price movement, current or future past demands which would enable the traders to make profitable gains than loss during their trading duration. The technical indicators is also helpful when it comes to the management system of a traders trading decision all for it benefit and professional usage.
Shading more light on my preceding answer, tradable signals are one the key-function considered during a trading process or by a trader and as such, traders to their best and possible limit depend of the analysis provided by the indicators during the evaluation of the phycology in the market chart.

ILLUSTRATE HOW TO ADD INDICATORS ON THE CHART AND ALSO HOW TO CONFIGURE THEM (SCREENSHOT NEEDED)

In accordance with the instruction, for this illustration I will be using my favorite trading platform known as TradingView. Therefore in order to add indicators, I will be taking the following procedures below:
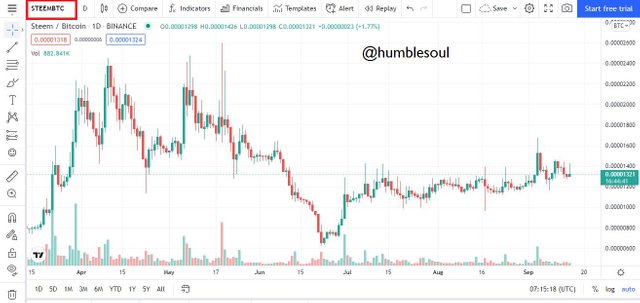
- After opening TradingView, I selected a coin pair of choice which is STEEM/BTC from the red shade below
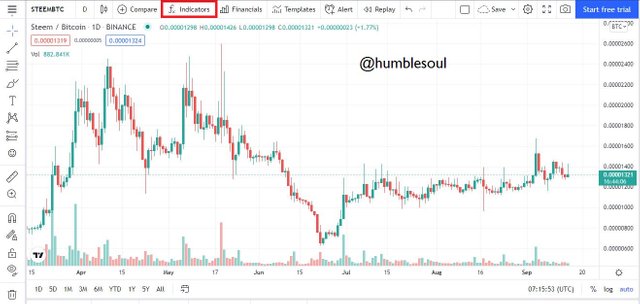
- Thereafter, I clicked on INDICATOR in the home chart image to add an indicator of choice, as you can see below
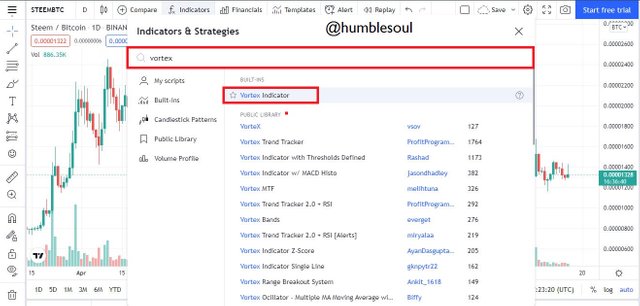
- Next, a dialogue box will appear with a space to select or search for any indicator in need or for use and as you cans see from the image below, I will be selecting Vortex Indicator
- After the selection, exist the dialogue box and from the image below the selected indicator (Vortex Indicator) is seen below the chart board.
- To configure the indicator, I select the red shade box found below to proceed
- Following the previous step, a box will appear which contents the Input, Style and Visibility. so from the section under Input I change it length to 14
- For this section, I changed the colors from default t black and red colors, as you can see from the image below
- While for this section, I balanced it setting to fit in to my current trading need

EXPLAIN THE DIFFERENT CATEGORIES OF TECHNICAL INDICATORS AND GIVE AN EXAMPLE OF EACH CATEGORY. ALSO, SHOW THE INDICATORS USED AS AN EXAMPLE ON YOUR CHART. (SCREENSHOT NEEDED)

Here are the following technical indicator that will be explained along with it examples:
- Trend based indicator
- Volatility Based Indicator
- Momentum Based Indicator
TREND BASED INDICATOR
Trend based indicators deals on evaluation of market chart or trend directions or movement. In this, charts moves like waves of which do take place as a bullish or bearish phrase or trend and with this indicators a trader would be notified of a coin price chart movement thus been alert of it behaviors during any trading or investment period.
An example of a trend based indicator is Ichimoku Cloud (Ichimoku Kinko Hyo) and from the image chart below, a STEEM graph has been plotted and from it we can see the movement of a downtrend and uptrend that has taken place in the past and currently, all from the effect of the indicator that has been applied
VOLATILITY BASED INDICATOR
Volatility based indicators centers on price volatility of a coin chart during a particular period of time. Since a coin or token price is not certain to be in a stable condition, This indicators helps to provide alert or notification to traders of when a price is low or a price of a coin is at high rate and can be sold out to make profit instead of loss. More to that, the indicator is meant to position a trader at the possible right stand during a trading process to avoid pitfalls.
An example of volatility based indicator is Bollinger bands. From the chart below, the said indicator has been implemented on the STEEM /BTC graph and the chart shows the price rate of the coin movement
MOMENTUM BASED INDICATOR
Momentum based indicator deals on the raise or fall of a particular coin price. Since a coin in the market do raise and at such time is said to be in a bullish period, the possibility of a bearish period to occur is seen thus with the use of this indicator the evaluation of the weak point or it strong phrase can be analyzed. Through such means, a trader will be able to sell-off it coins to make profit or better still enter the market to accumulate coins or invest for possible future benefit.
An example of a momentum based indicator is Relative Strength Index (RSI). From the chart below, the graph for STEEM/BTC shows how high the coin has raised and at some point where the coin has fallen which serves as aid tool to traders during consideration of trade process.

BRIEFLY EXPLAIN THE REASON WHY INDICATORS ARE NOT ADVISABLE TO BE USED AS A STANDALONE TOOL FOR TECHNICAL ANALYSIS

Indicators are programmed by man and can be said to be man-made of which should not be given complete trust or reliance. Therefore, there is an essential need to backup or support any indicator chosen for a particular trade because one indicator when not properly supported with another, might due to it imperfect stake drop bad signal to a trader thus which would make the trader to loss or have a bad management of the coins invested on.
Hence, for an analysis to be done with a close perfection of 98% during each trade, the combination or usage of different indicators that fit the current need will be a wise-thoughtful idea by any good trader.

EXPLAIN HOW AN INVESTOR CAN INCREASE THE SUCCESS RATE OF A TECHNICAL INDICATOR SIGNAL

As an investor, gaining a well-grounded knowledge of different indicators usage is need, it is also required that an inventor to at each point of usage of any indicator to arrange or configure the indicator into the format that will suit with the current trade in order to produce a good management system thus, bringing profit to the investor.
An investor is also expected to evaluate the chart movement and implement some alert notice to each trade duration with use use of the technical indicators to enable them analysis the market price movement at each time.

CONCLUSION
As every skills has it tool for an effective production. Similarly, as a trader or investor, technical indicators are tools of which can be used to have an effective trading process, therefore the need for those indicators can not be overly emphasized because much as been said during the course of this lesson. Thank you professor @reminiscence01 for the way you delivered and explained the lesson for me, I hope to learn more from you next time.


Downvoting a post can decrease pending rewards and make it less visible. Common reasons:
Submit