I feel very glad to be doing this again. I hope you're all doing good. I want to say a big thank you to Professor @imagen, for a very superb lecture. And of a truth, I learned a lot from your lecture. Here are my answers to your questions
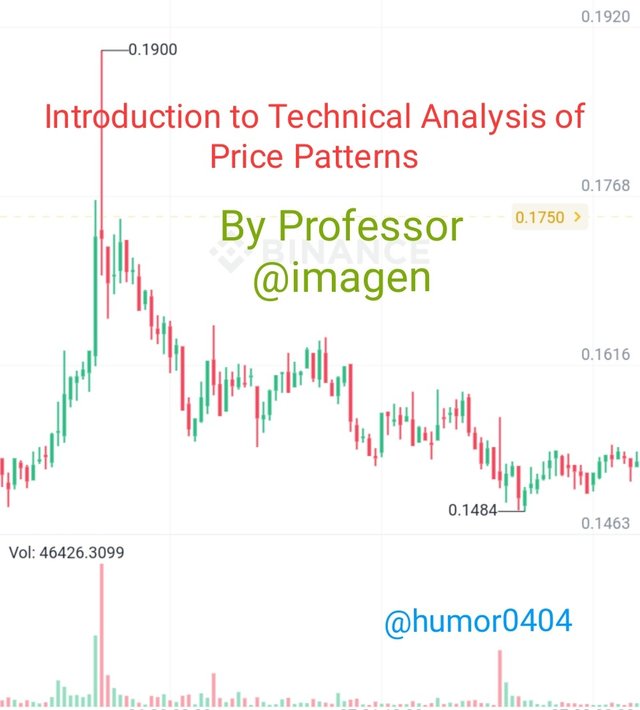
Screenshot of Binance

Perform the staking on a platform of your choice
I am choosing to perform staking using the Pancakeswap exchange. I'll also be using the trust wallet in this regard as well
Why did I choose Pancakeswap exchange and Trust Wallet?
The reasons why I chose to perform staking using this exchange is -
It is a decentralized exchange
Several services are available on this exchange, such as staking, liquidity providing, farming, Swap etc
It actually belongs to Binance. And as you may know, Binance is one of the biggest and most reliable platforms in the world.
The reasons why I chose to perform staking using this wallet are -
- It is a decentralized wallet
- It is a multi-coin wallet, having so many coins
- It also belongs to Binance. And that gives it a lot of reliability.
How to stake on pancakeswap exchange
- The first thing to do is to have Trust Wallet installed in your device. If you don't already have it, then download it here
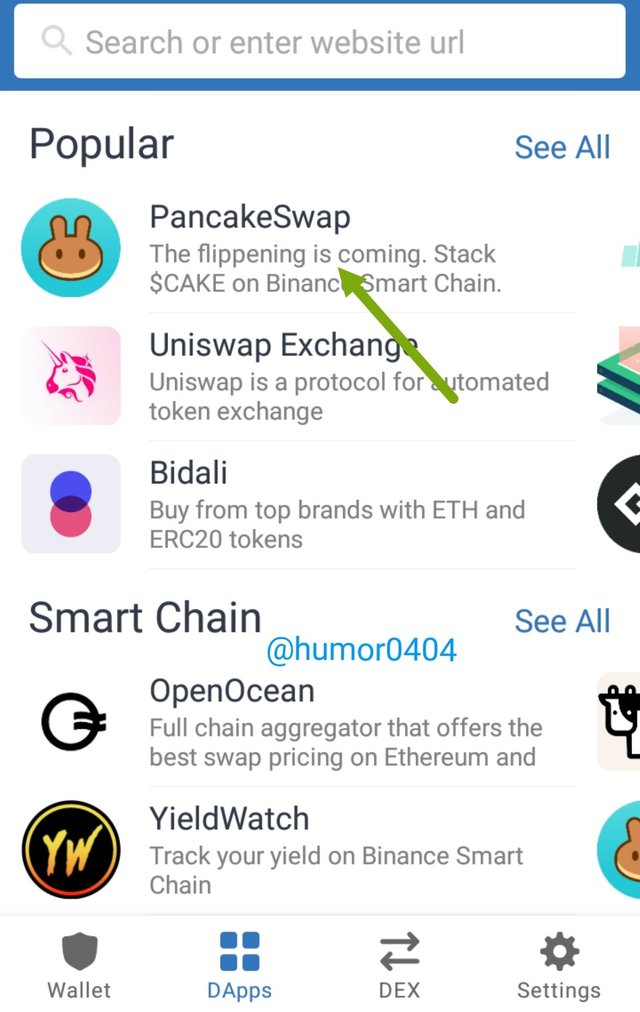
When you've downloaded and entered your Trust Wallet, you should click on DApps and it would take you to the image above.
Then you search for pancakeswap, and you should click on it. It would lead you to the image below
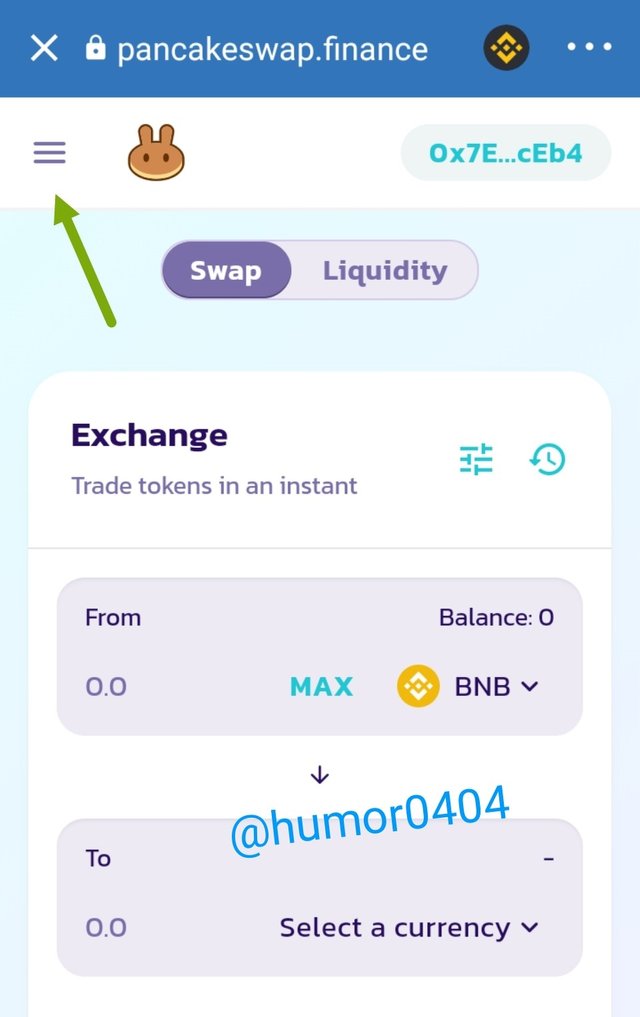
- Then you click on the 3 dashes that I indicated
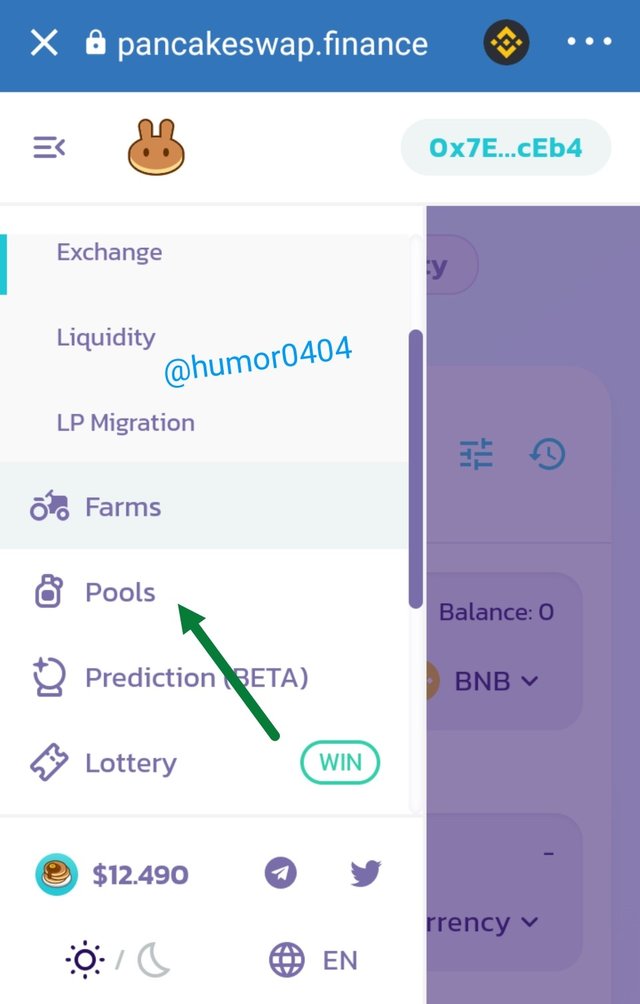
- From the options you see, click on pools
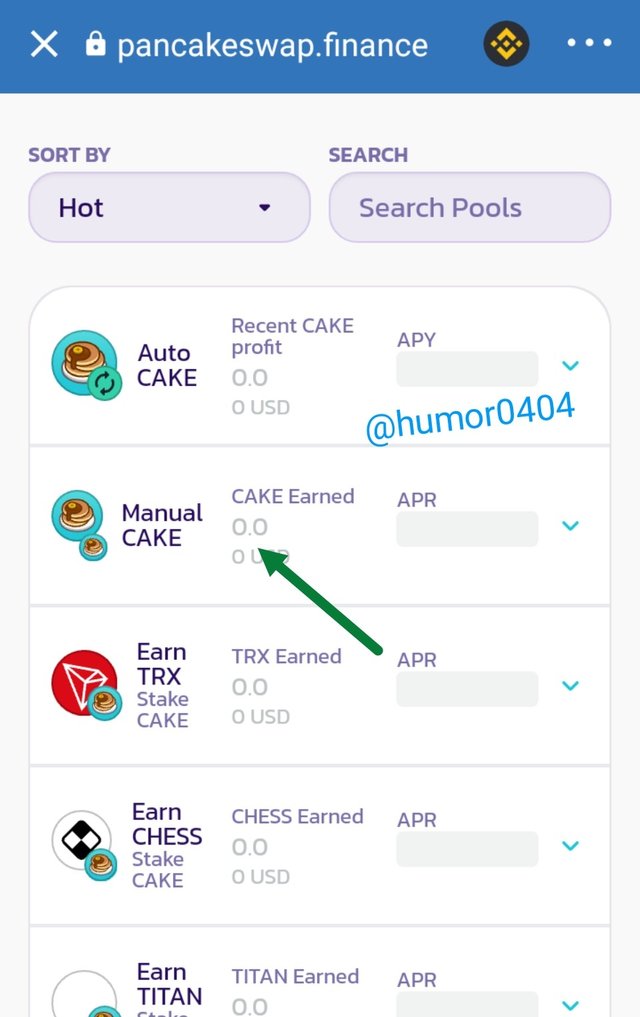
- There are several cakes that you can stake. But for this homework, I'm staking Manual cake. After clicking on the cake you want to stake, you'll see an option for you to unlock your wallet. Then you click on it

- As you can see above, there are many wallets that you can connect to the pancakeswap exchange. Then you stake as much as you want to.
Annual Percentage Yield (APY) of Manual Cake is 71.1%. A staking of 0.426 cake ($5.75) was made. In one year, that would earn ( 71.1/100×0.426 = 0.303 cake). That's about $4.09 yield. (Taking current market value of 1cake = $13.49)

Pick 3 cryptocurrencies and perform a 7-day and 30-day technical analysis. Draw trend lines and describe whether the coins are in a continuation or reversal pattern. Take screenshots.
Cryptocurrency 1
Screenshot of Binance
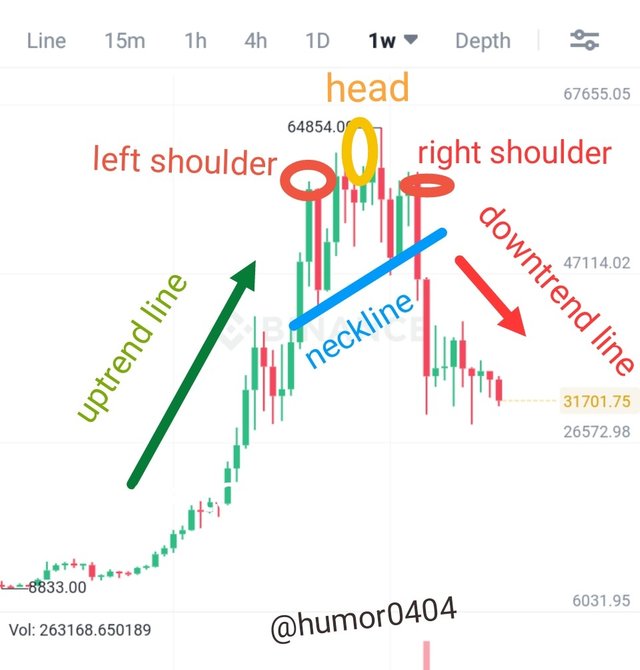
From the 7-day BTC/USDT chart technical analysis, you can see that there was first an uptrend line, showing that investors were heavily investing or buying the asset. Then a reversal pattern came up, representing as a head and shoulders. I also showed the neckline. Followed by a downtrend line.
The chart above shows that the market is in a continuation pattern. As the direction of price is heading down in the downtrend line.
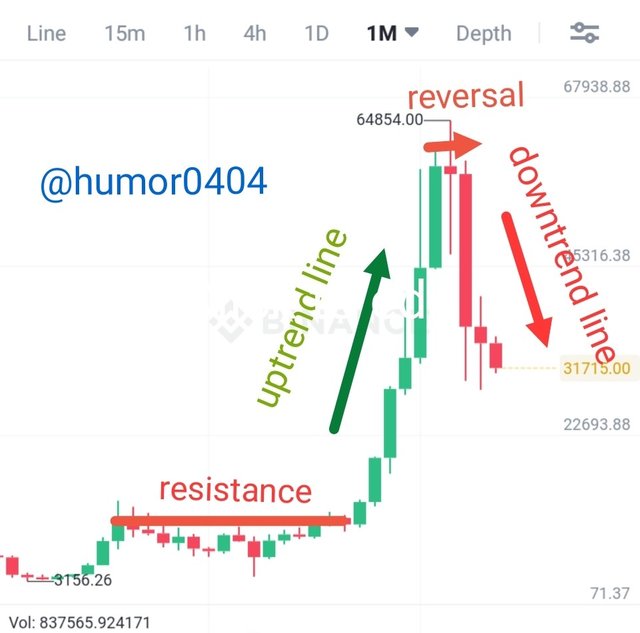
From the chart above, you can see that first there is a line of resistance, which can also be said to be the accumulation phase. Followed by an uptrend. Then a reversal, as price changes direction and starts coming down, which appears as finally a downtrend line.
The chart above has finished reversal, and is on it's way down. Therefore, it's a continuation pattern.
Cryptocurrency 2
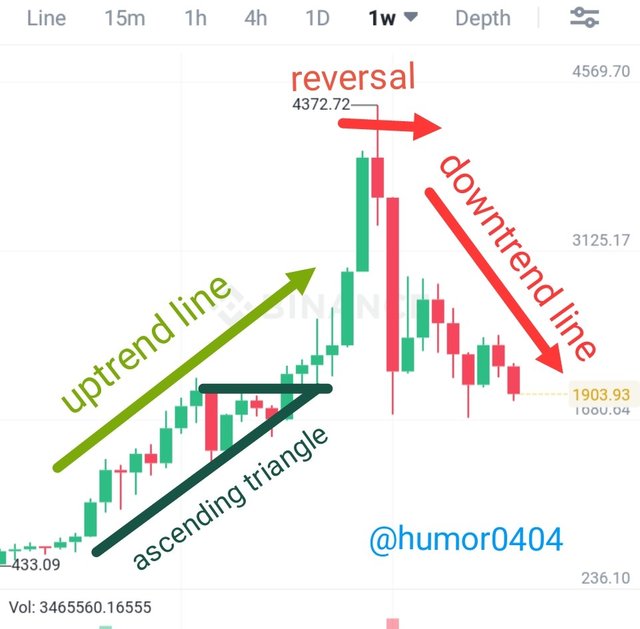
From the above chart we can see an ascending triangle, which is used to predict break out point in a continuation pattern. At the breakout point, you can enter your trade. An ascending triangle appears on an uptrend. I also drew an uptrend line, then a reversal and followed by a downtrend line.
From the chart we can see that the coin is in a continuation pattern.
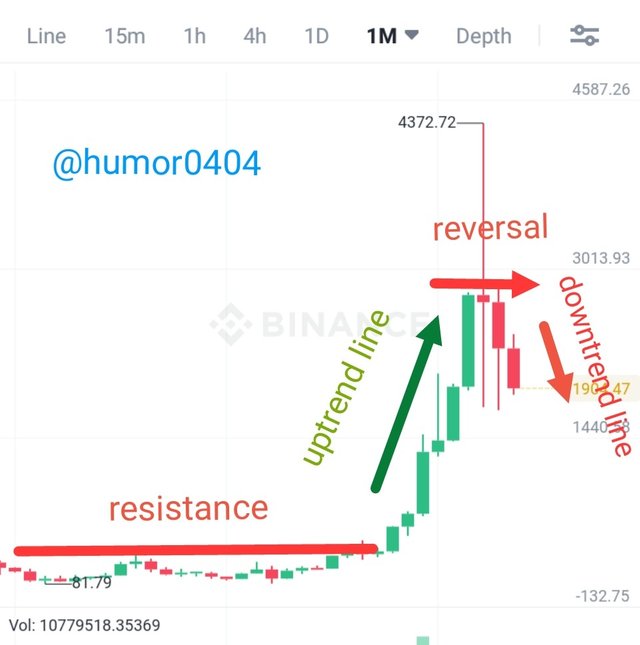
First, I drew a line of resistance, as seen in the chart above. At this point heavy investors were accumulation. Then the uptrend, as a result, I drew the uptrend line, followed by the line of reversal. And then the downtrend line.
From the 30-day ETH/USDT chart, one can say that the coin is still in reversal pattern.
Cryptocurrency 3
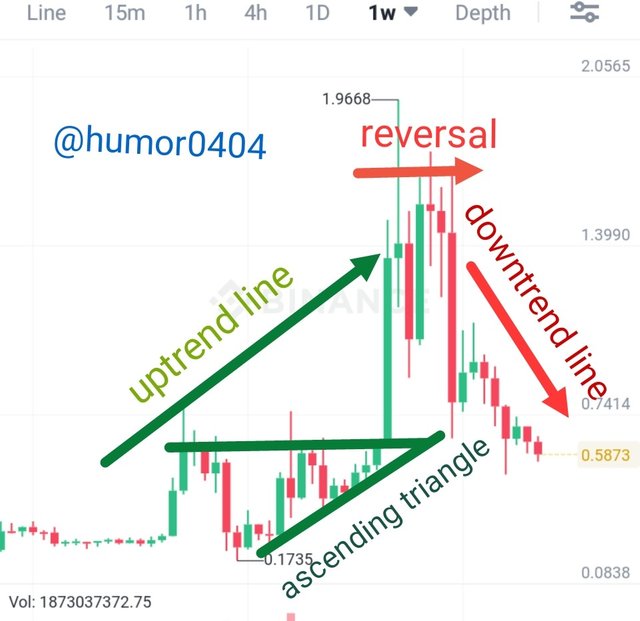
From the chart above, you can see that I drew an uptrend line, indicating that it was bullish at the time. Then you can see the ascending triangle; which as I mentioned is very good in predicting break out points. I also drew a line of reversal at the top, and then a downtrend line.
From the analysis, we can say that the coin is in a continuation pattern in a down trend.
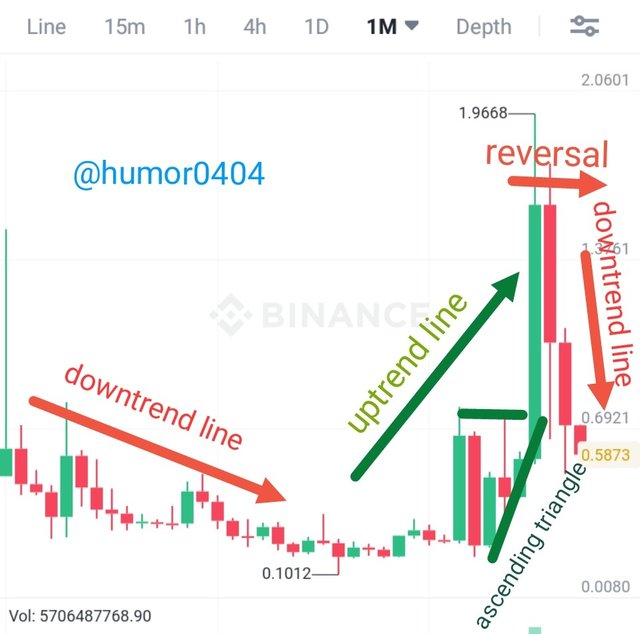
From the chart above, we can observe that at the early stages, there was first a downtrend line, signalling that the market was bearish. Then there was an uptrend, for which I drew an uptrend line. Again, we see the ascending triangle. And next was a reversal line, followed by a downtrend line.
From the above chart, we can say that the coin is in a continuation pattern in a downtrend.

How can we differentiate a bearish season from a bullish season in the market?
Bearish season
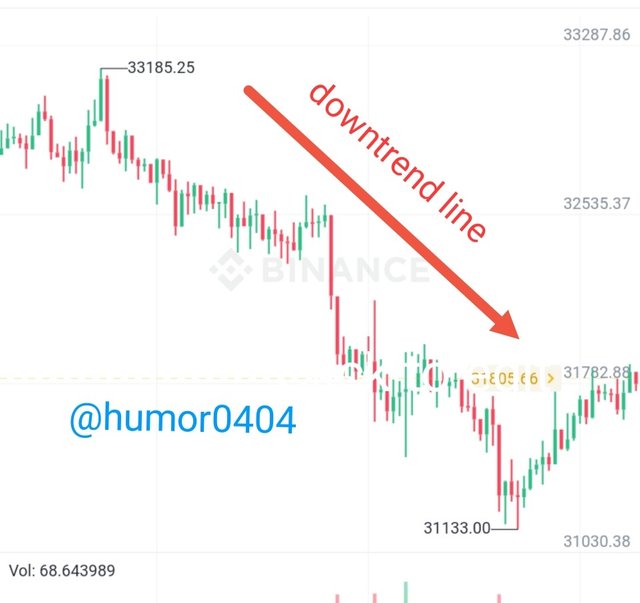
A bearish season can be seen by simply looking at the charts. You'll noticed a consistent decrease in the value of the asset. At intervals, the market may pull back shortly, but then continues in it's downward movement. You will find longer downtrend lines, in a bearish season.
By observation, you'll see that in a bearish season, price makes lower highs and lower lows. What causes this is the fact that investors are continuously selling this asset. And that pushes the value down, as there's more supply than demand.
Bullish season
A bullish season can be seen by observing the price movement. If the price is consistently increasing, and the price is forming an uptrend, then you're in a bullish season. You may see short pull backs in the downward direction, but then reverses and continues going up, this is called a continuation. In bullish season, you generally see longer uptrend lines.
You will also see higher lows and higher highs. The price of an asset goes up or becomes bullish when investors are buying the asset. Hence, the value of the asset increases. In a bullish season, demand for the asset is greater than the supply. So value increases.
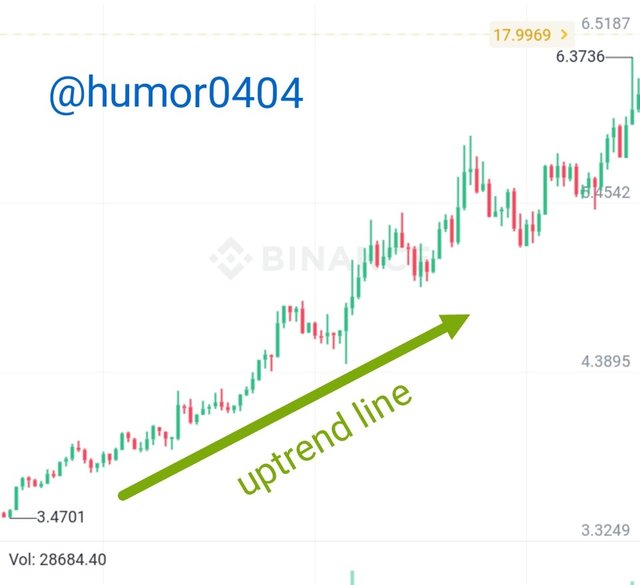
Basically, we can differentiate between a bullish and bearish season by observing the price action. If the price is going up consistently, we're in a bullish season. And if the price is going down consistently, we're in a bearish season.

Conclusion
Learning how to stake is very important in the crypto space in order to make some good passive income for yourself.
Understanding technical analysis can really improve your success rates as an investor in the markets.
Although there are different trading strategies. But there's an old saying that the trend is always your friend. Understanding when it's a bullish season and when it's a bearish season; and capitalizing on them, can really help you make more profits from the markets.
Thank you for participating in the Third Season of the Steemit Crypto Academy.
Congratulations, you made a great work.
Continue to strive, I look forward to continuing to correct your next assignments.
Downvoting a post can decrease pending rewards and make it less visible. Common reasons:
Submit
Thanks Professor!
Downvoting a post can decrease pending rewards and make it less visible. Common reasons:
Submit