Hello everyone, how are you all? Finally, after a break that seems like it lasted forever, we are back again in the first week of season 5 of CryptoAcademy, and today we learned about the ATR Indicator which is taught by professor @kouba01 so let's begin.

Q1. Discuss your understanding of the ATR indicator and how it is calculated? Give a clear example of calculation
ATR INDICATOR
The importance of Technical indicators in the crypto market has been emphasized over and over again in my previous assignment tasks as well as the professor's lectures. We have learned about indicators that help us in the trading market by demonstrating buying and selling pressure such as the Chaikin Money Flow Indicator. We have also been taught about indicators that determine the momentum of the market such as the Williams %R.
The Average True Range is a volatility-based indicator made by J. Welles Wilder Jr, which helps us in determining the volatility of a trading market. Before we move on further with the ATR explanation let me first give you a brief idea of what does volatility in the crypto market means. Volatility basically is a term used when we see the price of an asset making quick highs and lows in the market. It means that the price is not stable rather volatile. So the ATR Indicator helps us in measuring the volatility of the market.
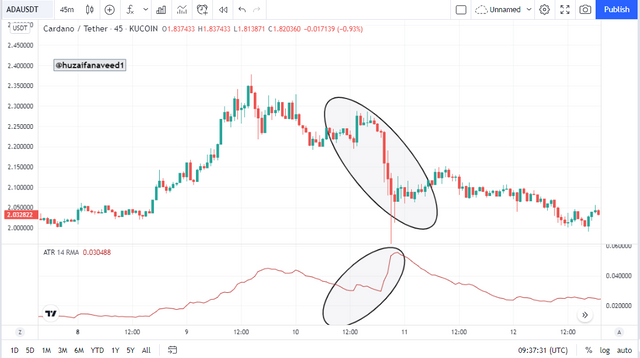
In this demonstration above of ADA/USDT we can see that the ATR indicates prominent changes whilst the price is volatile.
Apart from measuring the price movement, ATR also helps traders in the market to set up their risk management strategies. The ATR helps traders in setting up good stop losses and take profits through which the traders can have good entry and exit points in the market.
Calculation
ATR literally stands for Average True Range so for calculating ATR we'd first need to calculate the True range.
True Range: For determining the True Range we have to take out three values and whichever of those values is the highest, that value is considered. The true range indicates the volatility in the market.
The three calculations for TR are as follows:
TR(1) = Current High - Current Low
TR(2) = Current High - Previous Close
- TR(3) = Current Low - Previous Close
But one might think why are we having these calculations? Well, the answer was provided by the professor himself and I will elaborate it a bit further.
- The first calculation comes in handy when the current price candle is wider than the previous day's price.
- 2nd calculation is used when the current price bar closes higher than the previous candle.
- The third calculation is used when the current candle closes lower than the previous close.
Through this elaboration, we get an idea that if the range of the candles is higher the ATR will be higher as well.
In calculating the ATR a default period of 14 is taken. This 14 period could be the values over the last days, weeks, or months.
Now for calculating the value of the current ATR, the mathematical expression is as follows:
- Current ATR = [Prior ATR x (n-1) + Current TR] / n
- Where;
n is the number of periods, which by default, as I mentioned is set to 14.
- So if we were to now compose the final formula of ATR, it would be:
Current ATR = [Prior ATR x (13) + Current TR] / 14
- For example;
The previous ATR is 10 and the highest value of the True Range is 8, then the ATR would be;
Current ATR = [10 x (13) + 8] / 14
= [130 + 8] / 14
= [138] / 14
= 9.8
The current ATR value is calculated to be 9.8

Q2 What do you think is the best setting of the ATR indicator period?
Choosing the best settings varies from trader to trader. It's what you're most comfortable with. Whenever you decide to go for a setting in whichever volatility-based indicator, you are basically deciding how much noise you are ready to face in the market. If you are an intraday trader you'd probably go with low Settings as they tend to give early signals. For Long-term trading, you could use high settings as high settings are sensitive to prominent changes in the assets price
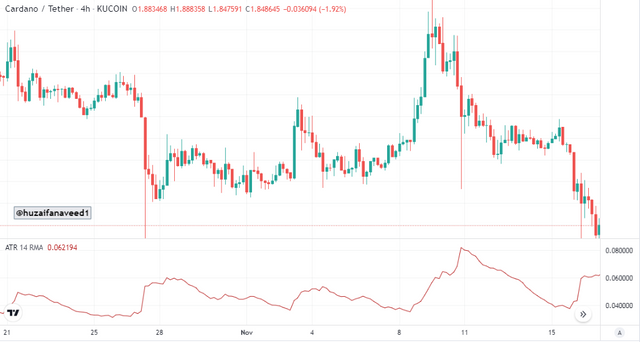
The ATR indicator gives us good signals by giving us the different conditions in the market. I would prefer to go with the default settings of 14 periods, which would signify a period of 14 hours for a 1-hour chart and so on, as it would give me good market signals conditions as well as good entry and exit points. The reason is that the low settings would fluctuate more. While higher settings would give fewer entry opportunities due to longer signals. So a mid-range period is best suited to my style.
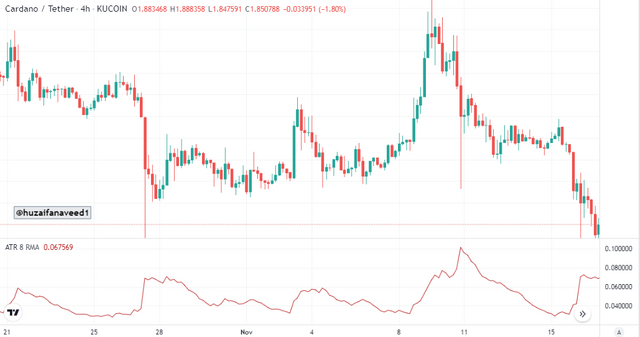
If we were to look at the ATR Indicator with different parameters in a chart we'd better understand what I have mentioned above.
- 8 Period
- 14 periods
- 28 Period
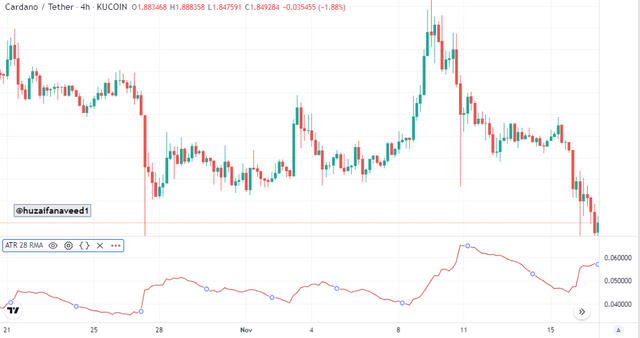
In this demonstration above we can have a clear look at how the settings affect the sensitivity of the ATR Indicator. When the ATR was set at 8 period we had a very fluctuating indicator, while on the highest period of 28 period the indicator significantly smoothened. But as I also mentioned above, I would like to trade in the market with the 14 period as it perfectly suits my style by giving me good signals.

Q3 How to read the ATR indicator? And is it better to read it alone or with other tools? If so, show the importance. (Screenshot required)
The ATR indicator comes in very handy to measure the volatility in the market. When there are bigger candles in the market which means that the volatility of the market is on a rise, then the signal from the ATR is given by a large volume of the indicator. Similarly, if there is less volatility in the market, it is characterized by a low value of the ATR Indicator. It is very easy to use if you know how to grasp the signals from this useful indicator.
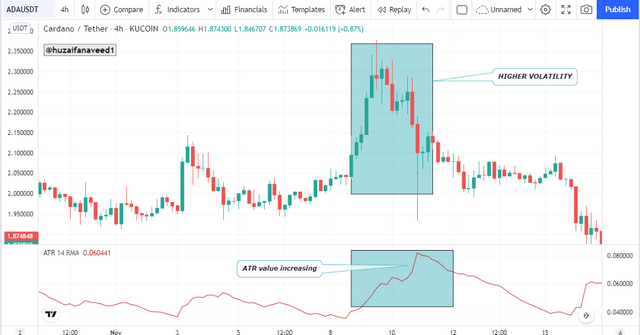
In this demonstration above of ADA/USDT we notice a bearish volatile market where the volatility in the price is perfectly signaled by the ATR Indicator. The value of the ATR increased which signified a volatile market.
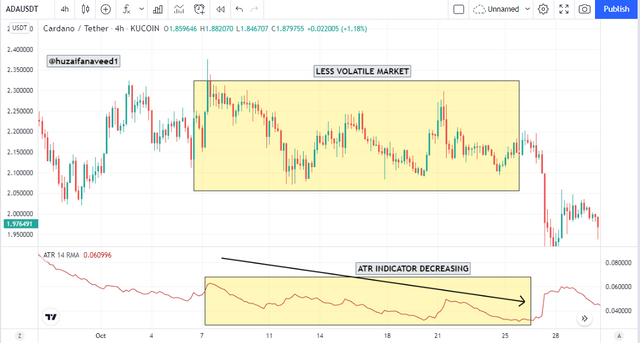
In this demonstration, we noticed the price wasn't volatile as there was so significant fluctuation in the market. This low volatile market is characterized by a decreasing value of ATR. So through the ATR Indicator we can have some really good signals in the market.
ATR with other Indicators
Trading in a crypto market with the aid of more than one indicator is never a bad idea. When you trade with more than one indicator you are basically increasing the chances of having good trades for yourselves. From this lecture, we learned that the other indicators which work best with ATR are Parabolic SAR, CCI, etc. For the demonstration, I decided to go with Parabolic SAR as it is best suited to me.
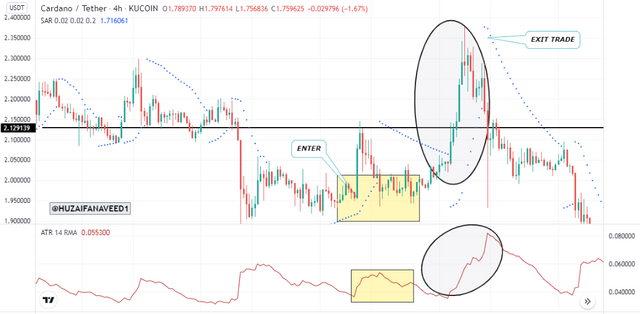
In the demonstration above of ADA/USDT we notice a quick breakthrough of the price from the resistance and the volatility was Indicated by the ATR. The Parabolic SAR is below the candles which indicates a good entry point. The price kept on rising and when the Parabolic SAR gets below the price, exit from the trade could be done. By using the ATR and Parabolic SAR, we were able to capitalize on a good trading opportunity.

Q4. How to know the price volatility and how one can determine the dominant price force using the ATR indicator? (Screenshot required)
Price Volatility and ATR
till now we all have an idea that the volatility and in the market is characterized by the movement of the ATR Indicator. The larger the volatility, the larger the increase in the value of ATR Indicator we would notice.
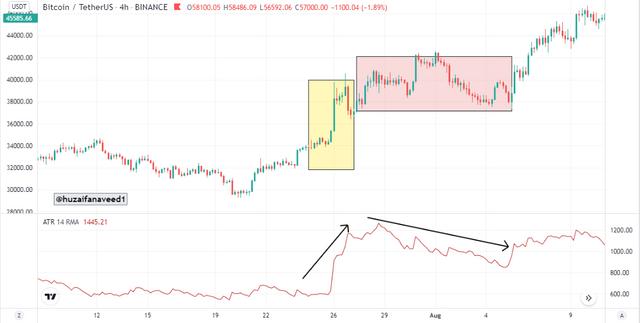
In the demonstration above of BTC/USDT we see an excellent example of price volatility and the AtTR indication. The price depicts volatility as it rises from $32k to $40k. The price candles are also seen to be larger and the ATR Indicator line value increases.
After the sudden volatile rise in the price, a consolidation is observed, marked as a red box by me. The candles are comparatively way smaller and the ATR value conforms to the price movement as it decreases. So from the demonstration, we understand what the professor taught that after a volatile movement, a trend reversal could be noticed.
Dominant Force with ATR
We usually notice on the chart that when the price is dominant be it bullish or bearish it would be characterized by a movement of the indicator as well. If there is volatility in the price, the ATR indicator value would increase as well, and if there is less volatility, the ATR indicator would show little movement, and its value would decrease as well.
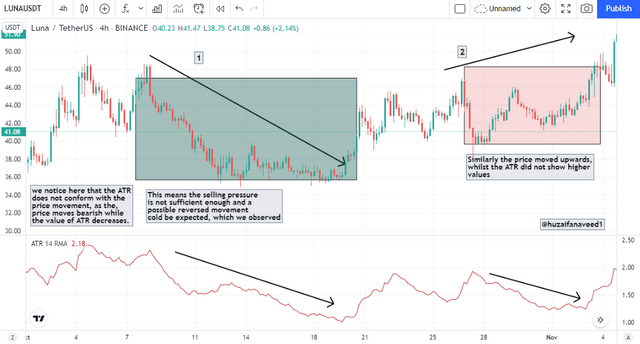
In this demonstration of LUNA/USDT above, we noticed two scenarios:
- The price moved downwards, but the ATR didn't show much volatility and showed a decreasing value. This shows that the bearish movement of price does not correspond to the dominant force on the price.
- The price moved upwards, but the ATR didn't show much volatility and showed a decreasing value. This shows that the bullish movement of price does not correspond to the dominant force on the price.
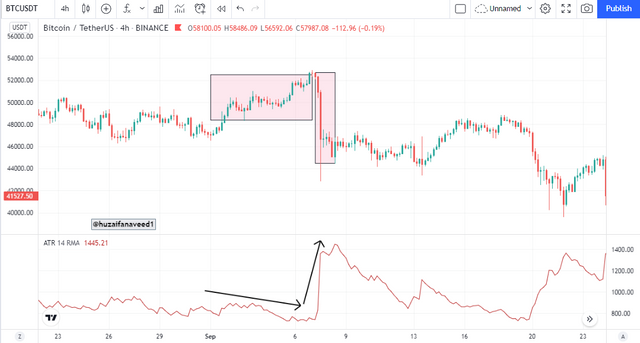
If we look at another example above which is of BTC/USDT we'll notice that the ATR Indicator conformed with the price movement as the price showed a sharp downward movement, the ATR Indicator also showed much-increased volatility. This shows that the dominant force is of bearish sentiment, as the price reversed immediately conforming to the indicator.

Q5 How to use the ATR indicator to manage trading risk ?(screenshot required)
The importance of risk management while trading cannot be emphasized enough. We have had plenty of lectures on it in the academy as well. There are plenty of factors included in risk management. Such as knowing when to enter the trade, when to exit. Analyzing the phases of the market and setting up Stop Loss and Take profits
Where some indicators only help you in analyzing the market, ATR steps up further and helps in proper risk management as well. Let's see how:
- Take Profit using ATR
A take-profit level is placed in the market where you want to exit, by taking home profits. It is a pre-set level in which the trader can be at rest knowing that if the market follows his desirable direction he can have profits.
Take profits level can be set at different risk-reward (R : R) ratios depending upon the strategies of traders. I usually prefer a 1:1 Stoploss/Takeprofit
Now let's understand how ATR Indicator helps us in setting up a take profit. The formula for using a take profit using ATR is:
- Take Profit = Entry Price ± (3 x ATR value)
Let's understand this from a real-life pair example
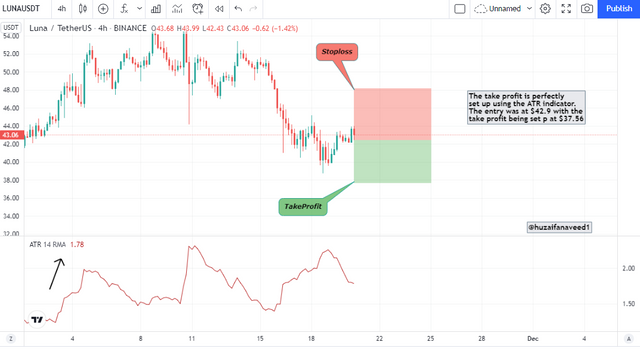
In the demonstration above of LUNA/USDT I have a sell trade entry at $42.9 and the value of ATR is 1.78
- Take Profit = $42.9 - [3 x 1.78]
= $37.56
- Stoploss Using ATR
A stop loss is placed in a market to secure yourself in case the price doesn't follow your desired direction. If the price hits the stop loss, an automatic trade gets triggered which helps you in exiting the market with minimum loss. The formula for using a stop loss using ATR is the same as above
Stoploss = Entry Price ± 3x ATR value
Let's understand this from a real-life example on a crypto pair:
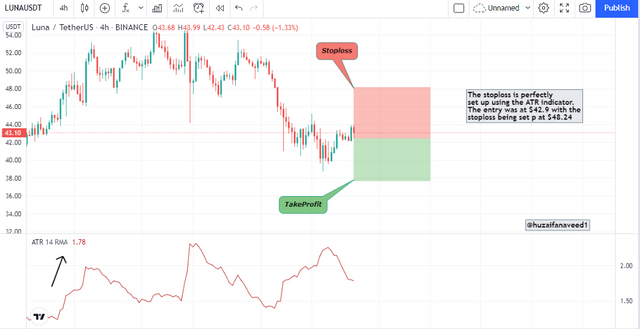
In the demonstration above of LUNA/USDT I have a sell trade entry at $42.9 and the value of ATR is 1.78
Stoploss = $42.9 + [3 x 1.78]
= $48.24
In the demonstration above the stop loss and the take profit was placed using the value on the ATR indicator. From these examples, we get to know the importance of ATR in risk management.

Q6. How does this indicator allow us to highlight the strength of a trend and identify any signs of change in the trend itself? (Screenshot required)
The strength of any market is characterized by a strong movement of the price in the direction of the trend, be it bullish or bearish. The movement of price in a market is characterized by a change in the indication of the ATR value. If there is a break in the resistance by price an increase in the values of ATR is indicated. And similarly, if the price breaks strong support and a strong bearish trend starts, ATR value would indicate a higher value.
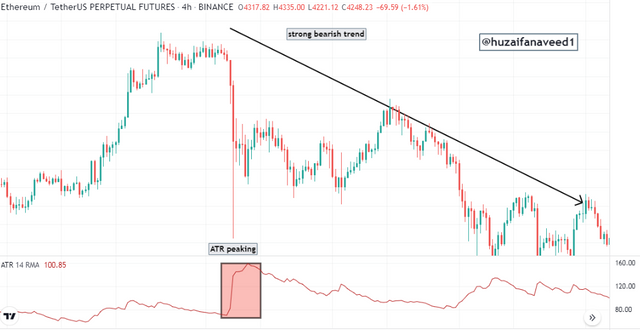
In this demonstration above we can observe how the indication of this major bearish movement was Indicated on the ATR Indicator. The indicator value increased the price showed a bearish movement, indicating a strong position of sellers in the market.
Trend Reversals Using ATR Indicator
The momentum of a trending market is destined to break at some point. It is at that point that we notice a short consolidation of price and then usually a trend reversal. When we are using the ATR Indicator, we can sort out this moment by seeing a decreasing value of the indicator. After the value of ATR has decreased a trend reversal is expected.
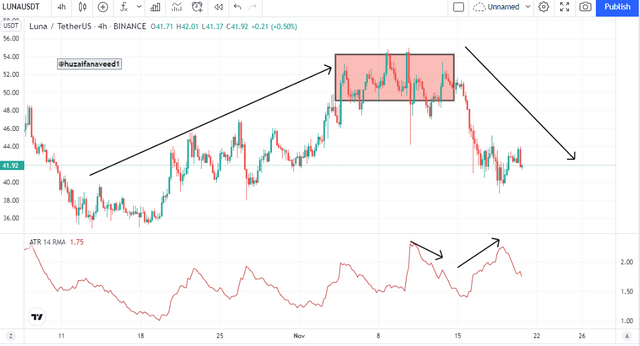
In the demonstration above of LUNA/USDT we noticed a bullish movement of the asset and the value of ATR was increased as well. After that, we saw that the price consolidated for a while before moving into a strong bearish direction. The trend reversal was confirmed by the ATR indication.

Q7. List the advantages and disadvantages of this indicator:
Advantages
- ATR indicator very simple indicator to use and doesn't need any beforehand expertise for its use.
- it can give you good signals based on volatility in the market.
- It has an amazing advantage of letting you trade with proper risk management as we learned how we can place stop loss and take profits.
- it can be used with other indicators for better results.
Disadvantages
- ATR doesn't give you a signal for entering and exiting the market.
- It is not 100% accurate and needs the aid of other indicators as learned.
- we have learned about different indicators before from professor kouba01 which give excellent trend reversal signals. It's not the same with ATR as it measures only volatility.

Another addition of indicator in my list of indicators taught by professor @kouba01
ATR is an excellent tool for measuring the volatility of the market. By using ATR you can set up your take profits and stop losses more efficiently. It can be used with other Indicators as well such as the Commodity Channel Index, Parabolic SAR etc.
It was an interesting assignment to do, thank you professor @kouba01 for yet another informative lecture.

Ps: all pictures are taken from Tradingview
Regards,
@huzaifanaveed1

Hello @huzaifanaveed1,
Thank you for participating in the 1st Week Crypto Course in its 5th season and for your efforts to complete the suggested tasks, you deserve a Total|8.5/10 rating, according to the following scale:
My review :
Work with good content, because you have taken every question seriously, allowing you to get answers that are precise and in-depth in its analysis and clear in its methodology. And here some notes :
A good interpretation of the ATR indicator, it was possible to rely on a graph to confirm the results obtained in calculating the value of the indicator at the instant t.
It would have been possible to go in more depth to explain the difference between an increase or decrease in the value of a period and to have clearly stated your personal choice.
Your answer to the third question was clear and successful.
You did well to answer the rest of questions, both in theory and in practice.
Thanks again for your effort, and we look forward to reading your next work.
Sincerely,@kouba01
Downvoting a post can decrease pending rewards and make it less visible. Common reasons:
Submit
Thank you professor for your kind remarks
Downvoting a post can decrease pending rewards and make it less visible. Common reasons:
Submit