Hello everyone, a very warm welcome to you all. I am here, after a rather long break from the crypto academy due to my exams, to submit my assignment. Starting the new year with the assignment of one of my favorite professors, ie, prof @kouba01. The topic of the assignment is Crypto Trading With SuperTrend Indicator. Let's begin.
Q1. how your understanding of the SuperTrend as a trading indicator and how it is calculated?
Blockchain technology brought many things with us, one of the most important things in this technology was cryptocurrencies. Cryptocurrencies are currencies that are not regulated by any bank or do not have any boundaries, moreover, they don’t have any physical shape. With cryptocurrencies, trading has also come. Trading of cryptocurrencies is not only popular but for many people, it's their full-time job.
But trading isn’t simple. Though it's simpler than stocks trading because price charts do follow trends in this market. While in stocks or forex, price charts are also based on many other factors. As the price follows trends, traders use trend indicators to buy and sell and make a profit.
Among those indicators, there is an indicator that is our today’s assignment topic. Super Trend Indicator. It is an indicator solely based upon trends of the price chart, ie, it will follow the ongoing trends in the market and measure the degree of volatility going on. One can easily find with the help of this indicator, whether the price is bullish or bearish. Let's find out how.
- BULLISH TREND
A bullish chart or bullish trend is indicated by this indicator by turning the chart color into green and forming weak support below the price. This indicates the bullish trend, and the prices will go up.
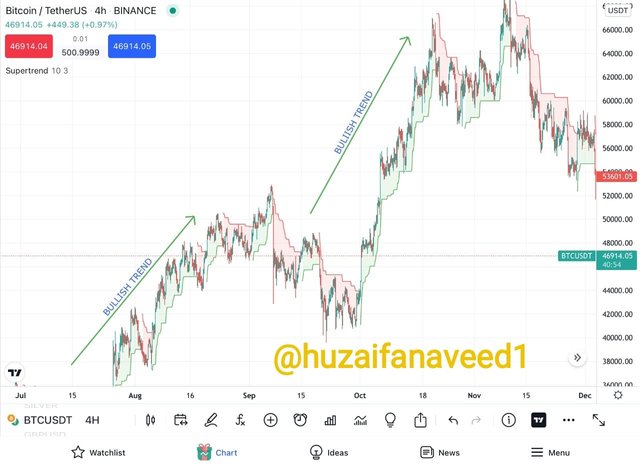
This screenshot of the price chart of BTC/USDT on Binance, having a time frame of 4H. We can see that the bullish trend is indicated by this trend and also weak support is formed just below the price.
BEARISH TREND
A bearish trend is indicated by this indicator by turning the chart price into red and forming a weak resistance above the price. This indicates the bearish trend, and the prices will go down
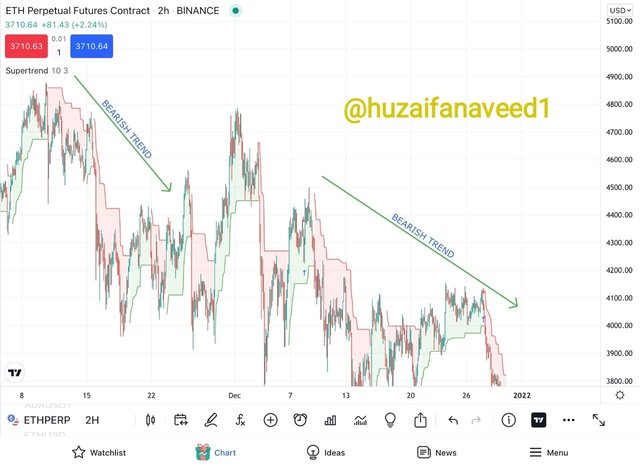
In this screenshot of ETH Futures on Binance, having a time frame of 2H, we can see that the bearish trend is indicated by this trend and also a weak resistance is formed just above the price
Now, as emphasized by the professor again and again, that the calculations of any indicator under study are extremely impotant. So for that, I will shed some light on SuperTrend's Calculations.
- CALCULATIONS
To understand the calculations of supertrend we must dive into its understanding.
To calculate, we must need three things
- Average of high and low (high+low/2)
- Multiplier
- ATR(Average True Range)
- FORMULAE:
BULLISH FORMULA = High+Low/2+Multiplier * ATR
BEARISH FORMULA = High+Low/2-Multiplier * ATR

Q2. What are the main parameters of the Supertrend indicator and How to configure them and is it advisable to change its default settings? (Screenshot required)
For this question, you can use the help of any trading platform. I will be using Tradingiew
- open any chart of your choice and click on the fx option. fter that type Supertrend and click on the first suggested option as shown in the screenshot below.
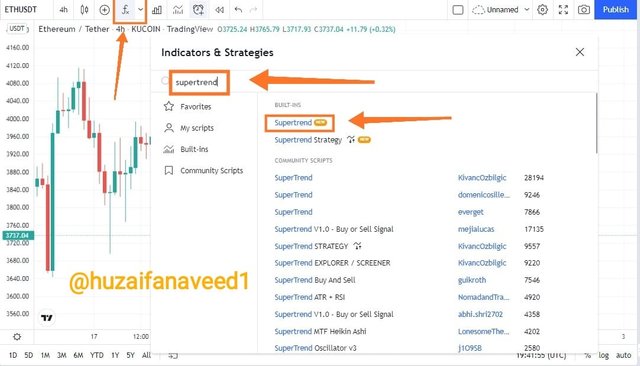
- click on supertrend's settings as shown in the screenshot below.
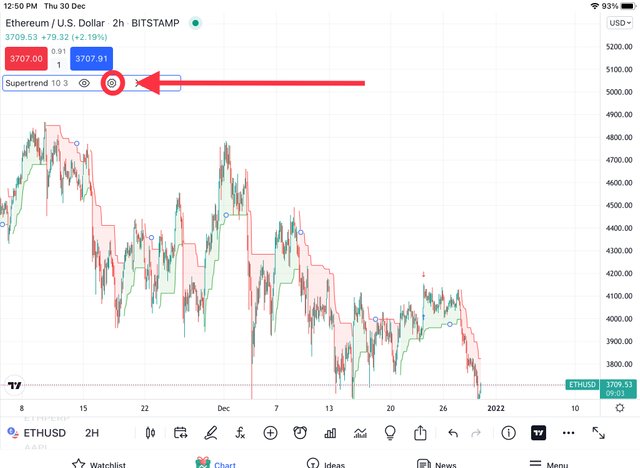
Here we can see that there are these two parameters:
- ATR Length
- Factor

- ATR LENGTH
ATR stands for average true range. True range is basically the highest value among the three following values
- Current High-Previous close
- Current low-Previous close
- Current high-Current Low
the average of the true range is called ATR
FACTOR/MULTIPLIER
Factor/Multiplier is a very important feature of supertrend. It is the value multiplied by ATR. The higher the value of the factor/multiplier, the lesser the signals will be generated. Likewise, the lower the value of the factor/multiplier, the higher the signals will be generated. So some might be thinking, it's good to keep the factor as low as possible, well, frankly no, why? Because having low factor/multiplier though increase the frequency of signals but usually those signals end up being false signals. Therefore you have to be careful with that if you are not doing intraday trading.
Let’s see what happens by changing the features:
CHANGING ATR LENGTH
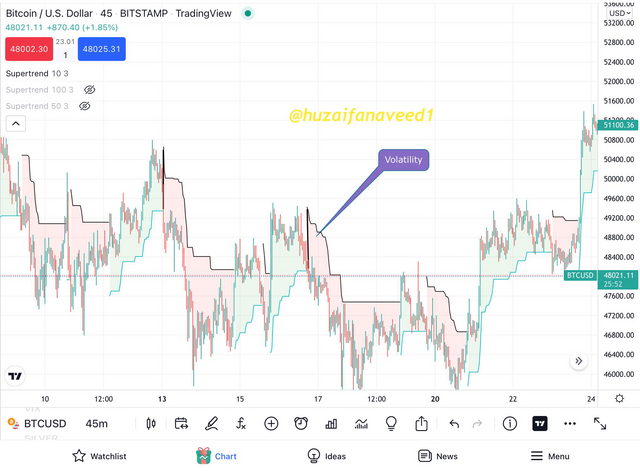
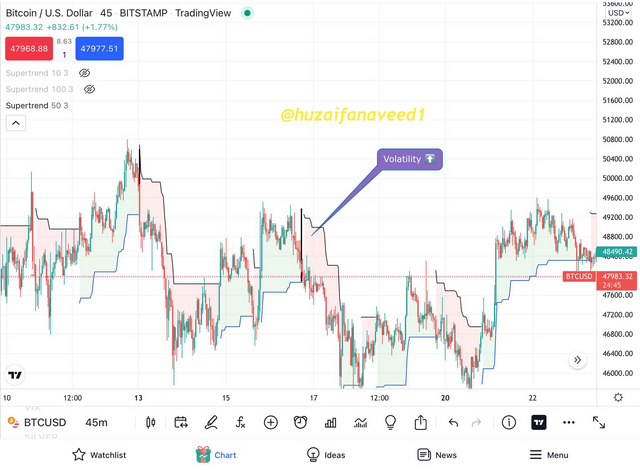
Though it depends on chart prices, what will happen when the ATR length changes in this indicator. But the following screenshots of ethereum price chart will be a pictorial example
LOW VOLATILITY
HIGH VOLATALITY
HIGHER VOLATALITY
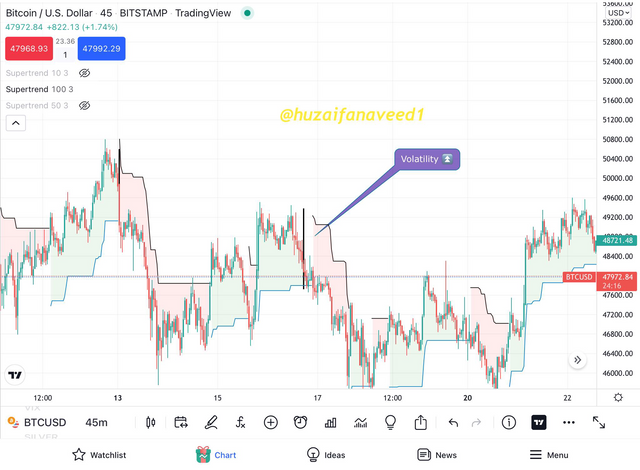
What can we observe is that by changing ATR length, overall the volatility indication changes. This super trend indicator also explains the volatility of the price chart. It does not really concern intraday traders. But those traders who keep coins for months can really use it. For those traders who stake or hold coins for months, it is advisable to keep the ATR length high
- CHANGING FACTOR
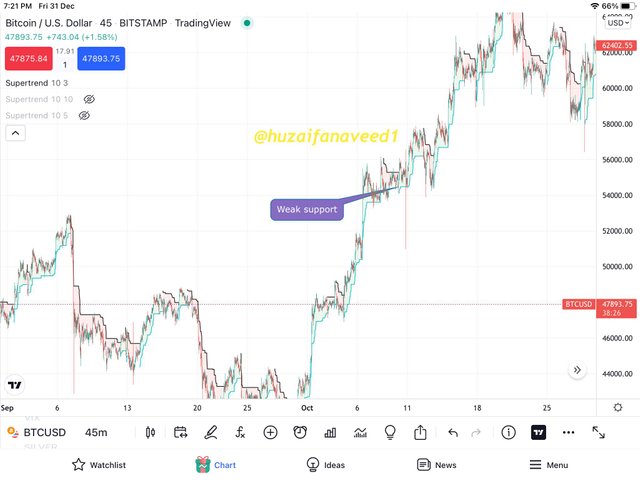
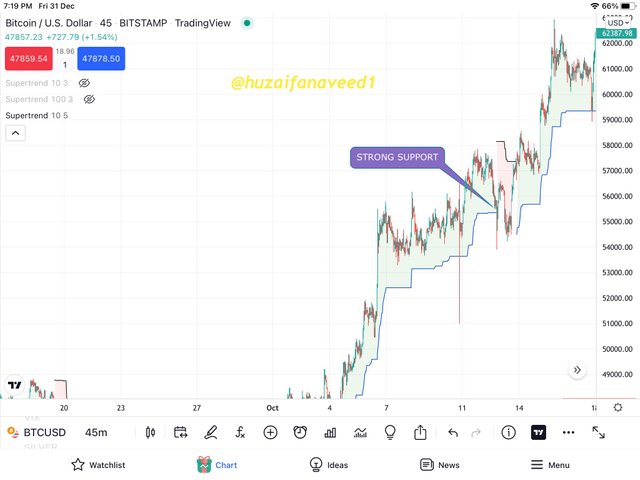
The changing of factor or multiplier changes the dynamic resistance and dynamic support. Can it help traders in any way? I think yes. But first, let’s see a pictorial example of what I’m trying to say.
WEAK SUPPORT
STRONG SUPPORT
STRONGER SUPPORT
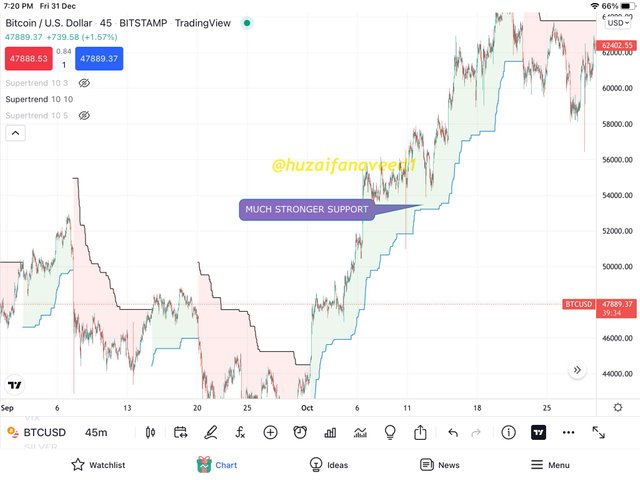
As you can see in these screenshots of Ethereum price charts, by changing the factor, the dynamic support and resistance are changed. Higher the multiplier, the stronger the support or resistance will be formed and vice versa. Now the question is how to use it for our best use. As it forms strong support and resistance, there are two things clear, if the resistance gets broken by the price the trend will be bullish for quite a long time, according to the chart. And if the support gets broken then the trend will be bearish for a long time, according to the chart.
That means if you are an intraday trader then you have to use factors in the low range. And if you are planning to make an investment for a long time then you can pick a higher numerical factor value.
- IS IT ADVISABLE TO CHANGE SETTINGS?
Well, it depends upon how is the trader trading. Does the trader an intraday trader, or make investments on long terms.
- FOR INTRADAY TRADERS:
For intraday traders, it is not advisable to change the settings. If they want to change then they can make a quicker super trend chart but I don’t think there is any need for that
- FOR LONG TERM INVESTORS:
As I explained, they need to change the ATR and Factor. To keep the track of strong movements of the price within the strong volatility range and strong support and resistance. I myself is not a long term investor trader but in my opinion, these settings will suit them
- ATR Length=100
- Factor=10

Q3. Based on the use of the SuperTend indicator, how can one predict whether the trend will be bullish or bearish (screenshot required)
Supertrend, as I previously explained is very good at catching trends in the market. It indicates not only running trend but also trend reversal and can also indicate the ranging zone
BULLISH TREND
Identifying a bullish trend with a super trend is super easy. When the green line of support comes below the price, that means it's a bullish or upward chart and the price will go upward according to the trend. As long as the support doesn’t get broken, a bullish trend is continuing.
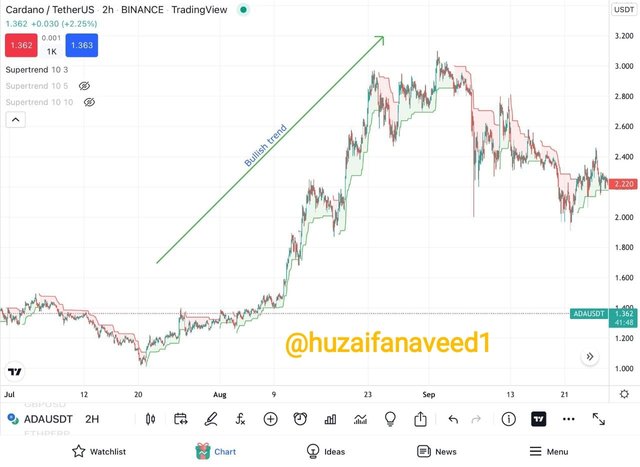
In this bullish chart of ADA/USDT on Binance, having time frame of 2H, we can see that supertrend indicated a bullish trend and continue it. However, it contain some other selling signals which were false. Investors who invest their money for a long term, can filter these either by using other indicators such as donchian channels or they can shift their chart factor just like this;
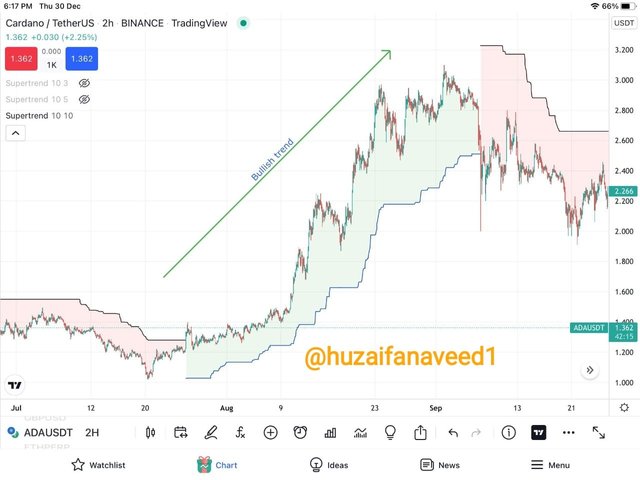
n this chart of ADA/USDT on Binance having a time frame of 2H we can see that however the buy signal was a bit late but there was no false selling signal. But it also doesn’t end up having a maximized profit amount as you can see, they still miss very much because their support was too strong. For those traders who want to invest for a long time, this is better, to cut a small amount of profit and filter false signals
BEARISH TREND
Identifying a bearish trend with super trend is super easy. When the red line of resistance comes above the price, this means that it's a bearish or downward chart, and the price will go down according to the trend. As long as the resistance doesn’t get broken, a bearish trend is continuing.
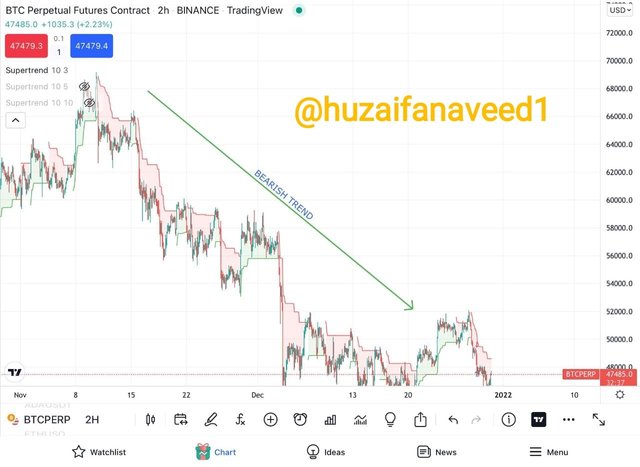
In this bearish chart of BTC Futures on Binance, having a time frame of 2H, we can see that the super trend indicated a bearish trend and continue it, however, it contains some other buying signals which were false. Investors, who invest their money for the long term, can filter these either by using other indicators such as Bollinger bands or they can shift their supertrend factor just like this
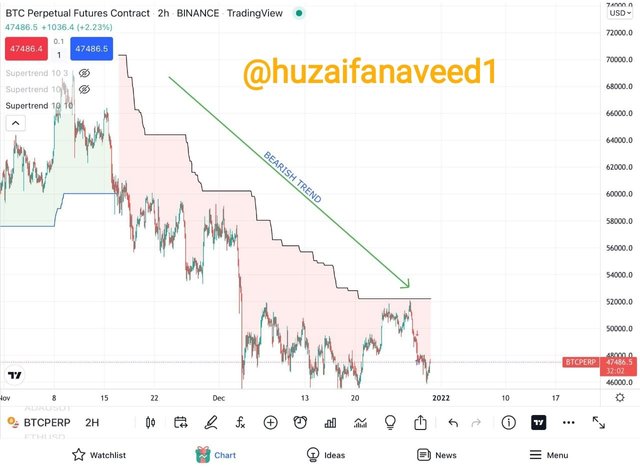
In this chart of BTC/USDT on Binance having a time frame of 2H, we can see that however the sell signal was a bit late but there was no false selling signal. But it also doesn’t end up having a maximized profit amount as you can see, they still miss very much because their resistance was too strong. For those traders who want to invest for a long time, this is better, to cut a small amount of profit and filter false signals

Q4. Explain how the Supertrend indicator is also used to understand sell / buy signals, by analyzing its different movements.(screenshot required)
It is easy to identify the trend using supertrend indicator, but it is also easy to get signals from this strategy. Why is that? Because this supertrend indicator has resistance and support. The work of resistance and support is simple, to keep the price in range. And if the resistance or support gets broken, it means that the price is not going to be in that range, therefore smart traders see this opportunity and invest their money according to the breaking of resistance/support.
Supertrend works similarly. As soon as the resistance/support gets break you have a signal that the trend is going to change. But traders have to beware of this, either use it with the configuration that suits their trading strategy most or use any other indicator with it.
BUY SIGNAL
Buy signal is generated whenever the resistance line, red line, or upper line is infiltrated by the price. It is the signal that the trend is going to be bullish. For a smart trader who is using the indicator according to its strategy, it's a buy signal.
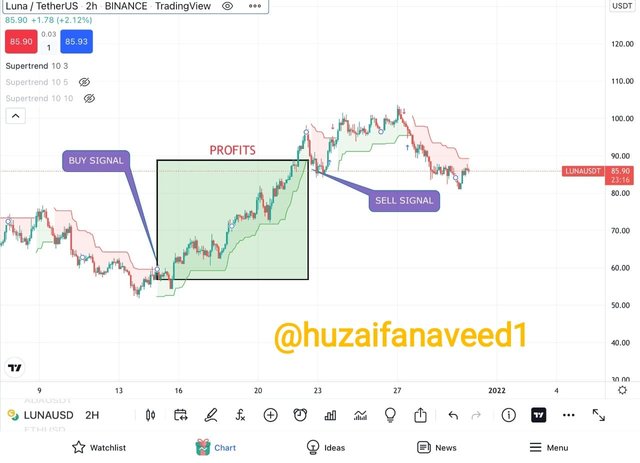
In this screenshot LUNA/USDT of Binance, having a timeframe of 2H, as soon as the resistance got broken by the price, dynamic support comes below the price, and the price started to move upward. As the breaking of resistance is the signal for a long trade entry, there should be an exit signal too. The exit signal is when the dynamic support, that comes to existence after breaking of resistance gets infiltrated by the price as mentioned in the screenshot. The rectangular area is the profit that a trader can make by this signal.
SELL SIGNAL
Sell signal is generated whenever the support line, green line, or below the line is infiltrated by the price. It is the signal that the trend is going to be bearish. For a smart trader who is using the indicator according to its strategy, it is a sell signal
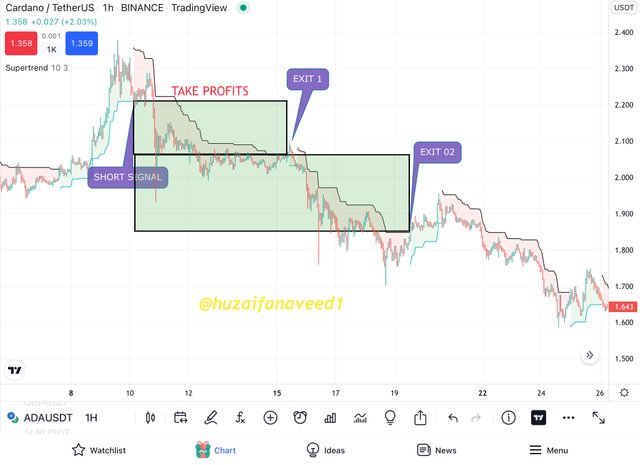
In this screenshot of ADA/USDT of Binance, having a timeframe of 1H, as soon as the support got broken by the price, a dynamic resistance comes above the price and the price started to move downward. As the breaking of support is the signal for a short entry, there should be an exit signal too. The exit signal is when the dynamic resistance, that comes to existence after breaking of support gets infiltrated by the price as mentioned in the screenshot. The rectangular bars are the points that a trader can make exit.
Supertrend indicators give signals of buying and selling easily. If you don’t use it according to your strategy, you can get wrong signals easily too. It will always be my advice to use any indicator first on demo trades several times according to your trading strategy. Moreover to filter out wrong signals, one must use other indicators with it too

Q5. How can we determine breakout points using Supertrend and Donchian Channel indicators? Explain this based on a clear examples. (Screenshot required))
To determine the breakout points with any indicator or strategy we must know the indicator or strategy totally. We have already discussed the supertrend in detail and we know its breakout points too. Let’s talk about breakout signals by donchian channels.
BREAKOUT POINTS BY DC
Donchian channel is an indicator of the 90s but it works accurately still on the cryptocurrency market. It contains three lines;
- Upper Blue Line
- Average Line
- Lower Blue Line
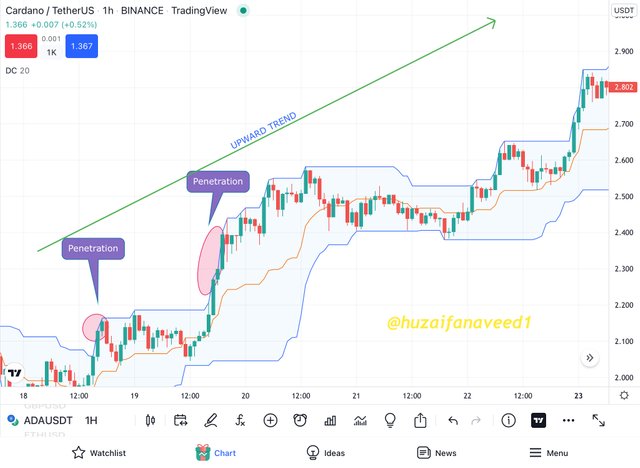
SIGNAL FROM UPPER BLUE LINE
A breakout signal is generated by the upper blue line when it get penetrated. It is always best to wait for two consecutive green candles to break the upper blue line. The penetration of these two candles is a signal of a breakout from donchian channels
SIGNAL FROMM AVERAGE LINE
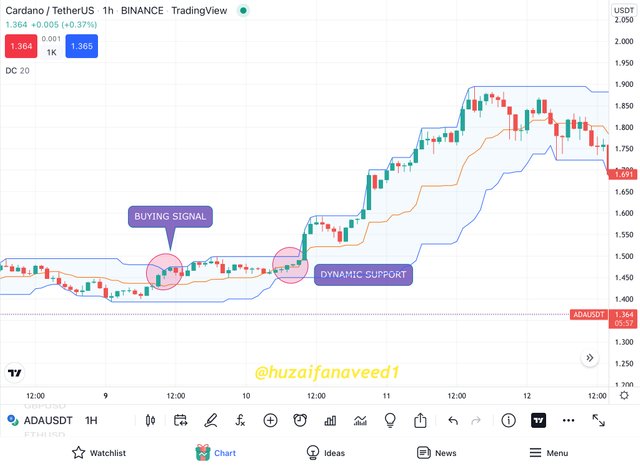
Average line doesn’t really produce any signal, but once a bullish trend starts its act as a dynamic support. And whenever a bearish trend starts it act as a resistance. It is the average of the upper band and lower band, therefore it is very helpful in maximising the profit and to look out any trend reversal.
SIGNAL FROM LOWER BLUE LINE
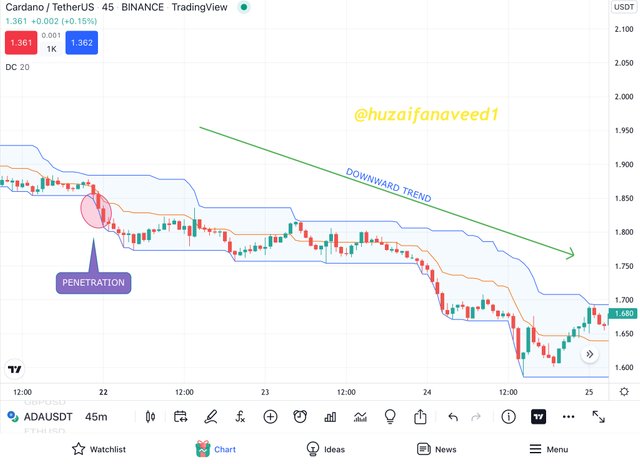
A breakout signal is generated from the lower blue line when it gets penetrated. It is always best to let two red candles break the lower band first, before investing. The penetration of these two candles is a signal of a breakout from donchian channels
BREAKOUT POINTS BY SP AND DC BOTH
As both indicators are really good in identifying the breakout points and upcoming trends, we can use them combined to filter out any false signals. Here’s how we will find the breakout points by a combination of both.
BULLISH BREAKOUT
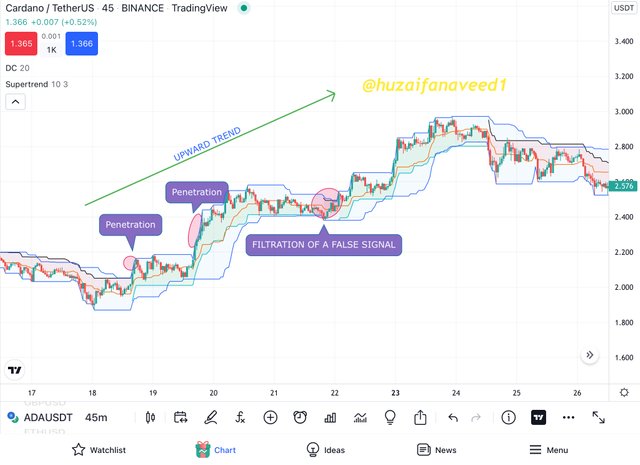
In the above screenshot of ADA/USDT from Binance, having a timeframe of 45m, we can see that the first signal from donchain channels and the signal from super trend were at the same time. However, donchian generated another signal too. Moreover, there was a false signal too by supertrend, which was filtered by donchian channels.
BEARISH BREAKOUT
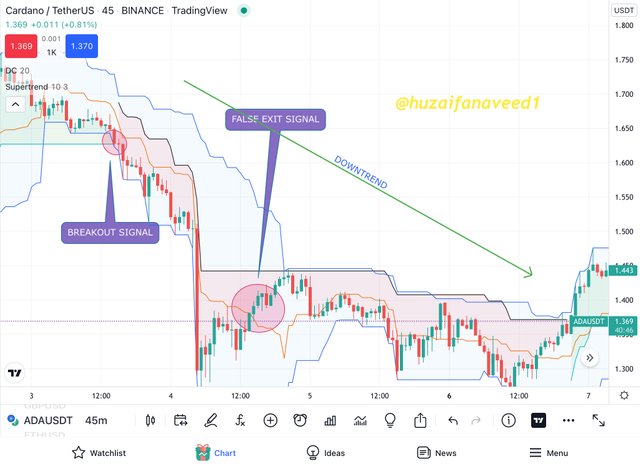
In this screenshot of ADA/USDT from Binance, having a timeframe of 45m, we can see that the break out bearish signal from donchian channels was generated with the signal of bearish breakout of supertrend. However, there was a false signal from donchian channels which was filtered by supertrend.

Q6. Do you see the effectiveness of combining two SuperTrend indicators (fast and slow) in crypto trading? Explain this based on a clear example. (Screenshot required))
As any indicator with anytime frame can generate a false signal so a trader must be cautious with the indicator. To filter out false signals the professor combined the two super indicators. One is pacy and fast while the other one is comparatively bit slow. Let me explain pictorially with the examples how it is useful to filter false signals, but first, lets dive into the settings of these two super trends
SETTING OF FIRST SUPERTREND(default)
- ATR Length= 10
- Factor= 3
SETTING OF SECOND SUPERTREND
- ATR Length = 21
- Factor = 2
BULLISH SIGNALS
A bullish signal is generated by using both supertrend in such a way when both supertrends, faster and slower, give a buying signal. Even when they aren’t together, the signal from the fast one can be the initiation and the signal from the second one can be the confirmation. Likewise, whenever a sell signal comes in and a trader has to exit from the market, a trader should wait for the 2nd supertrend signal, the slower one. In this way, traders may lose some amount of profit but it’s worth the loss
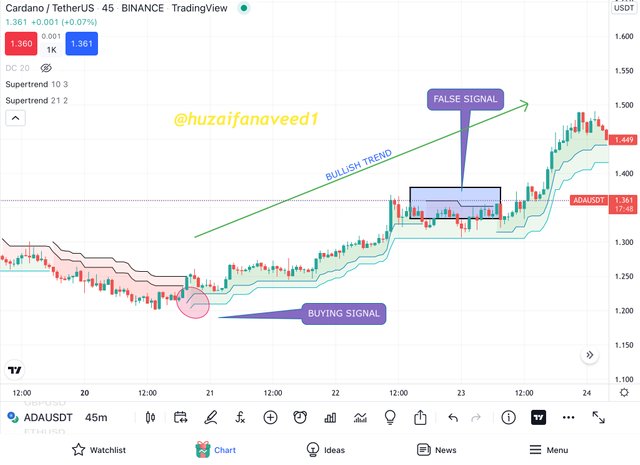
In this screenshot of ADA/USDT from Binance, having a timeframe of 45m, we can see that the supertrends, both, give buying signals together, therefore, it's a confirmed buying signal. And both dynamic supports appeared. However, the faster super trend gave a wrong/false signal, which did not confirm by the other, slower supertrend. Therefore it's proven to be a false signal and the next bull in the price can be seen.
BEARISH SIGNAL
A bearish signal is generated by using both supertrends in such a way when both supertrends, faster and slower, give a sell/short signal. Even when they aren’t together, the signal from the fast one can be the initiation an the signal from the second one, the slower one can be the confirmation. Likewise, whenever a buying signal comes in a trader have to exit from the market and close the position, but the trader should wait for both supertrends buying signal to filter out the false signal. In this way trader may lose some capital from its portfolio, but comparable to what he can gain, it's worth the risk.
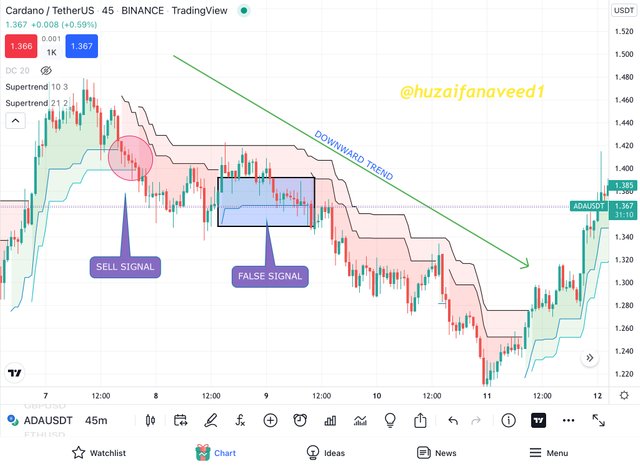
In this screenshot of ADA/USDT from Binance, having a timeframe of 45m, we can see that the supertrends, both, give buying signals almost together, therefore, it's a confirmed short signal. And both dynamic resistance appeared. However, the faster supertrend gave a wrong/false signal, which did not confirm by the other slower supertrend. Therefore it's proven to be a false signal and the next bearish price can be seen.
In this way by using two supertrend with different configuration traders can filter out the false signals generated by this indicator. But we must bear in mind that one must be faster and one must be slower. For intraday traders, the setting professor used and I demostrated is best according to me.

Q7. Is there a need to pair another indicator to make this indicator work better as a filter and help get rid of false signals? Use a graphic to support your answer. (screenshot required)
It is always advisable to use other indicators and strategies with any indicator. It helps in filtering out signals. Moreover, it helps in getting the best from any trade, and keeps your portfolio green as grass.
WITH SUPERTREND
As a supertrend indicator is a trend indicator, which means its best in catching trends, pairing oscillators with this indicator will be better. The oscillator, if properly configured according to a specific strategy, can tell you the market's current direction. There are many which can be used such as MACD, RSI, Stochastic, etc. However as the professor paired it with and I earlier paired it with DC (donchian channels), it prove to be very brilliant too. Therefore indicators like Bollinger bands (because they tell volatility) and EMA (because they tell the averages) can be very useful too.
COMBINING SP+STOCHISTIC
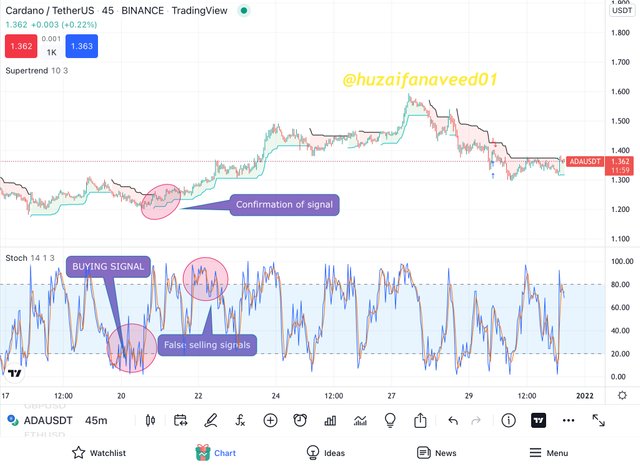
In this combination, we can see that the Stochastic signal was confirmed by super trend, and a bullish chart appeared. However, a false signal was also generated by Stochastic, rectified by super trend. The exit point from supertrend, however, was not fully profitable therefore stochastic filtered it and the chart still got bullish for some time.
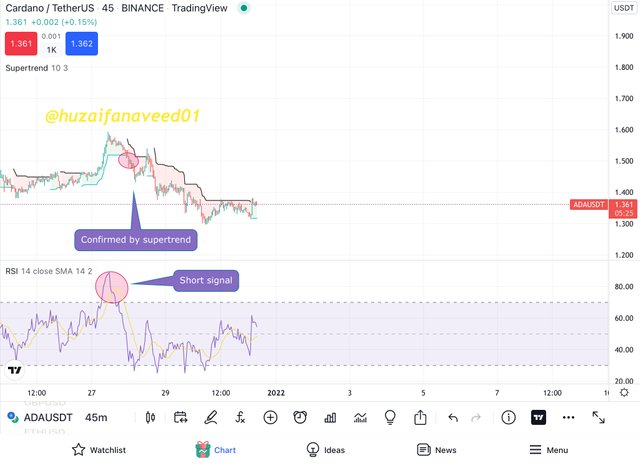
COMBINING RSI+SP
RSI is another kind of oscillator. In this combination, we can see that a short signal is generated by RSI and confirmed by SP. After that, the price went bearish continuously and a bearish trend appeared.
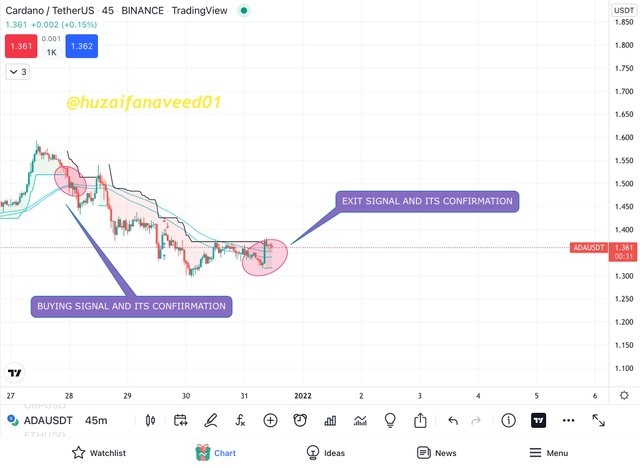
COMBINING SP+MA LINES
Here in this combination I used the same chart and the same spot as the previous one and try moving averages in it. These moving averages are configured to work in Puria Indicative Strategy. However they work with MACD to filter the signals, I used them with super trend to filter false signals. However, it didn’t give any false signal but it worked superbly. At first, the supertrend gave the signal of buying, and moving averages confirmed it, then the moving averages gave a sell signal which did get approved by super trend too but for only one candle. It was a false signal by both but not much serious. However, it gave a buy signal too and its confirmation is done by the supertrend.

Q8.List the advantages and disadvantages of the Supertrend indicator:
ADVANTAGES
- The first and the foremost advantage of supertrend would be its easy nature of being readable and comprehensible on the chart. It is extremely easy to use for me.
- An excellent tool for long term traders as it lets you have a clear direction of the trends
- It can be very easily combined and used with other indicators to give off profitable trades
DISADVANTAGES
- First things first, The Supertrend indicator cannot be used in the ranging markets as it is used for markets following strong trends only.
- Using supertrend indicator alone without the aid of other indicators can make your trades fall in losses. So you are actually kind of bound as you will have to use it with other indicators.

Another important indicator makes it to my list. Thanks to professor @kouba01 of course. It is always fun to attend your lectures prof, as we get to learn about more and more useful and new indicators.
Through Supertrend indicator, you can use the ongoing trend in the market to be in your favor if you know how to properly use this indicator as this indicator makes it really easy for you to analyze the movement of the price in the market, giving off a good buy and sell positions. But like every other indicator, the ST indicator should be used with other indicators to keep you safe from false and late signals. A very good example of that was given in the explanation above, ie, donchian channels.
Once again, thank you professor for this insightful lesson. I learned a lot from it. Looking forward to your next lectures.

PS: all screenshots are taken from Tradingview while the grammar has been checked by grammarly
Regards,
@huzaifanaveed1
