What is the importance of technical knowledge in trading? Describe the key components and information you can gather from a technical chart. |
|---|
Wherever I teach, whether it be in a school or a coaching center, it's my habit to start off with an example to help students clear their concepts. In this assignment, I'll do the same. Imagine you're in the middle of a desert and you have no idea where to go next. You don't see a person for miles and miles ahead of you. You don't know where to go, and you don't even have a map. But just imagine for a moment that you had a map with you. You would know where to go. This is what technical analysis means in the crypto market.
Technical analysis involves determining the direction and movement of the market using various tools such as charts, support and resistance levels, indicators, trends, and price action.
There are two types of analysis that are very important when trading in the crypto market:
- Technical Analysis
- Fundamental Analysis
In this question, I'll delve into Technical Analysis in depth.

Technical Analysis |
|---|
Technical Analysis refers to trading in the market by utilizing information such as charts, trends, trend lines, price action, and indicators. It helps traders determine price movements by analyzing previous prices and trends. This approach relies heavily on studying charts and indicators, as well as historical price data and trend movements.
Technical analysis is pivotal for traders aiming to predict future price movements based on historical data. By examining patterns and trends in price charts, traders can identify potential buying and selling opportunities. Various tools and indicators, such as moving averages, relative strength index (RSI), and Bollinger Bands, Ichimoku Kinko Hyo etc (all of these mentioned indicators have been taught in the crypto academy by professor @kouba01) are used to assist in making informed decisions and calculated risks.
One of the fundamental goals of technical analysis is to execute profitable trades. This involves knowing when and where to place buy orders and set stop losses. By carefully analyzing the data and recognizing patterns, traders can make more accurate predictions about market behavior. This helps them to enter trades at optimal times and protect their investments with strategic stop losses.

Components |
|---|
Technical Analysis is compromised of a lot of things, I'll discuss each on of them in depth here.
Charts |
|---|
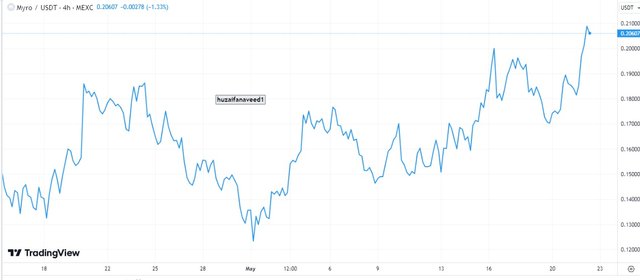
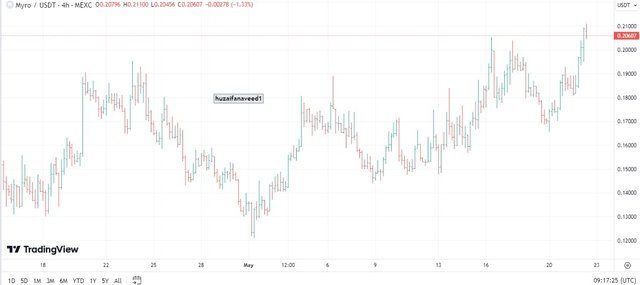
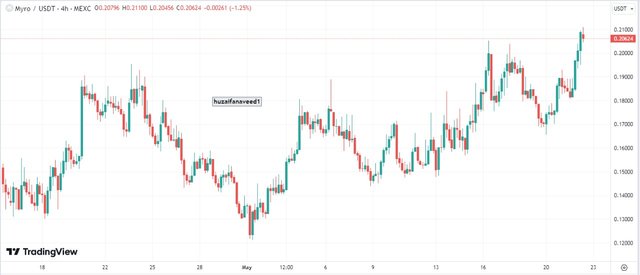
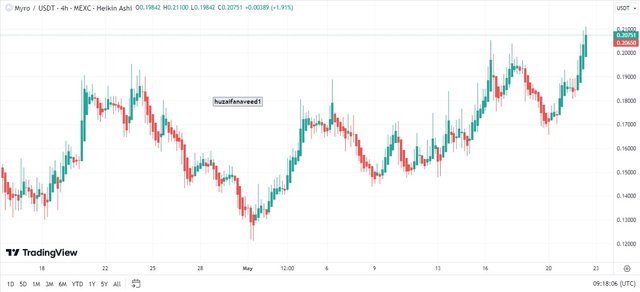
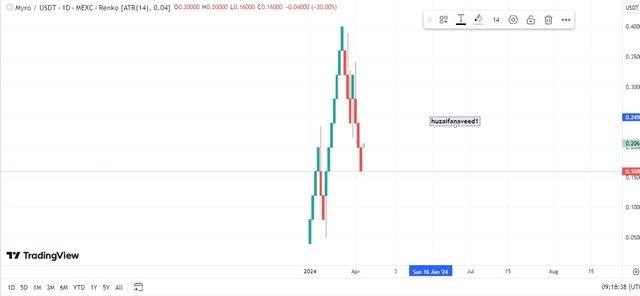
Charts provide a graphical representation of an asset, enabling us to assess price movements and historical data for any crypto asset in question. By analyzing charts, traders can identify trends, patterns, and potential future price movements, which are essential for making informed trading decisions. Numerous types of charts are available in trading, each offering unique insights and perspectives. Common types include line charts, bar charts, candlestick charts, and more specialized ones like Renko and Heikin-Ashi charts. Each chart type has its advantages, helping traders to visualize data in different ways, perform technical analysis, and develop strategies.

Line Chart |
|---|
Bar Chart |
|---|
Candlestick Chart |
|---|
Heikin Ashi Chart |
|---|
Renko Chart |
|---|
all Screenshots are taken from tradingview

Volume |
|---|
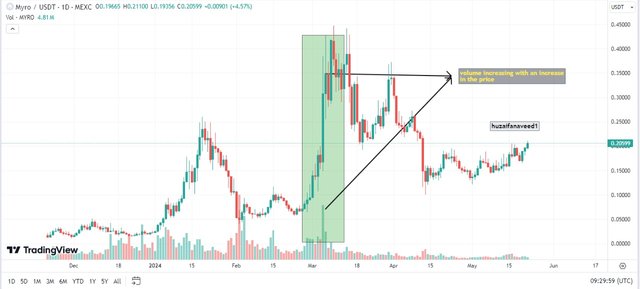
Volume of an asset is one of the most important component of technical analysis. It is used to determine the market emotional and financial sentiments in order to open the perfect buy and sell positions for ourselves.

Technical indicators |
|---|
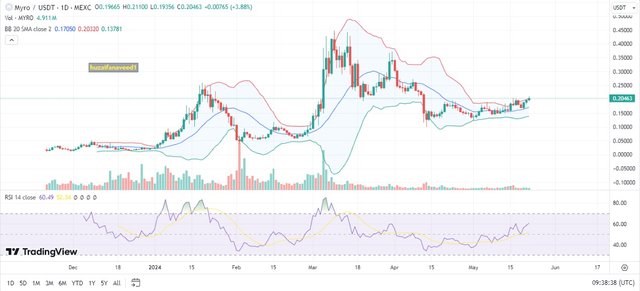
This by far is the most important thing for me in technical analysis if only you know how to use the indicators while trading. Indicators help you in analysing the market, identify important levels, identify support and resistance levels as well as presenting with good buying and selling oppurtunities if used in the correct configuration.
There are a lot of technical indicators that I like to use but my favorite ones are the simpler ones such as the
RSI
MA lines
Aroon
Bollinger Bands etc


Importance of Technical Analysis |
|---|
I'm sure by now you might already have an idea about the importance of Technical Analysis but I'll still list them down for you:
Gives us buying and selling points
Helps in determining historical price movement of an asset
Helps in predicting the future market price of an asset
Helps in determining the maket sentiment such as bullish or bearish sentiment
Helps in determining bullish and bearish divergences
Helps in identifying important Support and resistance levels.
Minimizes losses and maximizes profits for a trader
- Assists in Risk Management
- Helps in Trend Identification
In this question we discussed in depth about Technical Analysis, it's components and importance in detail. All the screenshots are taken from tradingview

Explain how to read candlestick charts and the significance of different time frames in trading. |
|---|
Before we delve into the depth of a candlestick chart, let me first explain what a candlestick really is. In the crypto market, the Japanese Candlestick chart is the most commonly used charting method by traders. A candlestick provides a visual representation of price movements within a specific time frame, which can be as short as a minute or as long as a day, week, or even month, depending on the timeframe chosen by the trader.

Real Body |
|---|
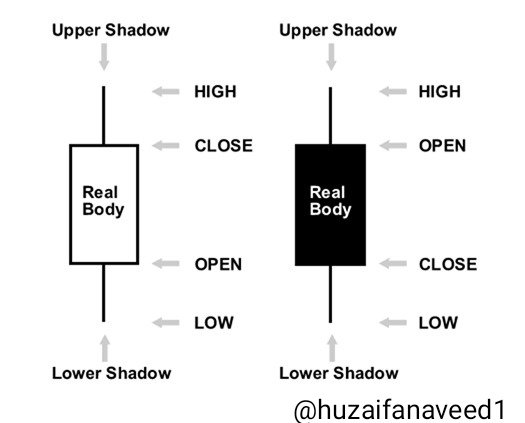
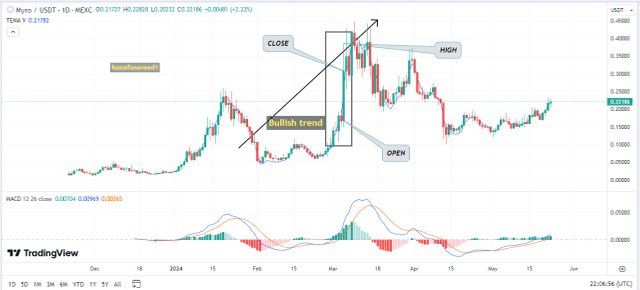
The real body is the main part of a candlestick and is typically colored green or red in most charts. A green body indicates that the closing price was higher than the opening price, signifying a bullish period, while a red body shows that the closing price was lower than the opening price, indicating a bearish period. The real body represents the range between the opening and closing prices for the selected timeframe. It is flanked by wicks or shadows, which depict the highest and lowest prices during that period. Together, the real body and wicks provide a comprehensive view of price movements.
High |
|---|
The top portion of the candlestick represents the peak of the price movement within a specific period. The highest point of this movement is indicated by the top of the upper shadow, also known as the wick. This high point is situated above the real body of the candlestick and shows the maximum price reached during that timeframe. Understanding this high point is crucial for traders as it helps them identify resistance levels and potential price reversals in the market.
Open |
|---|
As the name suggests, the candlestick open represents the opening price of the candlestick for the chosen timeframe. This price marks the beginning of the trading period and sets the initial value from which the price will fluctuate, providing a starting point for analyzing market movements.
Close |
|---|
The closing price of a candlestick represents the final price at the end of the selected timeframe. Analyzing the close is crucial as it helps traders asses market sentiment and predict future trends. A closing price higher than the opening suggests bullish momentum, while a lower closing price indicates bearish sentiment.
Shadow |
|---|
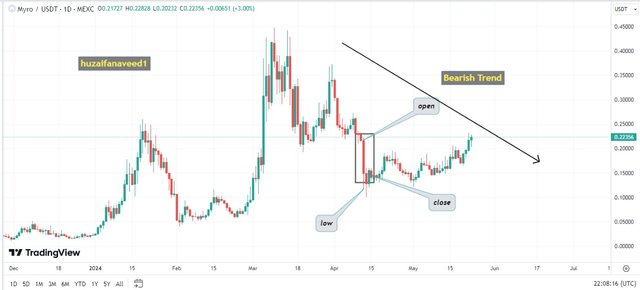
The small line above or below the real body of a candlestick is called a shadow or wick. Shadows indicate price levels where the market briefly traded before returning to the opening or closing price. They represent price levels that were tested but couldn't be maintained.
Low |
|---|
As the name suggests this part of a candlestick represents thr minimum price of an asset in a certain time period.
Bullish Candle |
|---|
A bullish candlestick, rising in the market, signifies upward momentum as its opening surpasses the closing, indicating an uptrend. In a succession of bullish candlesticks, an upward trajectory forms, heralding an uptrend or a bullish market sentiment.
Bearish Candle |
|---|
Bearish candlesticks, moving down in the market, signify a downtrend with their closing below the opening, indicating downward momentum. In a series, these candlesticks form a downtrend or a bearish market

High Timeframe (HTF) |
|---|
A high timeframe basically means the charts where the candles represent daily, weekly or monthly movements of the asset in question.
Significance |
|---|
Using a high timeframe is crucial for traders aiming to identify long-term trends of an asset. This approach provides a clearer picture of the overall market direction, filtering out the noise from short-term fluctuations. By analyzing data over extended periods, such as months or years, traders can better understand the asset's long-term movement. This is particularly useful for strategic planning and investment decisions, as it helps in recognizing sustained trends and potential reversals. High timeframe analysis is essential for those focused on long-term gains and minimizing risks associated with short-term volatility.
Low Timeframe (LTF) |
|---|
Low Timeframes are usually that span ove 15 minutes, 1-Hour, 4H etc charts were we can analyze the price of an asset in a shorter period of time.
Significance |
|---|
A low timeframe is used by traders who engage in scalping and opening swing trades. This shorter duration analysis allows them to closely monitor and capitalize on the short-term volatility of an asset. Scalpers typically hold positions for very brief periods, sometimes just minutes, seeking to make small profits from minor price fluctuations. Swing traders, on the other hand, may hold positions for several days, aiming to profit from expected short to medium-term price movements. By using low timeframes, these traders can identify precise entry and exit points, react quickly to market changes, and optimize their trades for profitability. This detailed, real-time analysis is essential for maximizing gains in fast-moving markets where timing is critical.

Define chart patterns and differentiate between continuation patterns and reversal patterns. How can chart patterns be utilized to set effective stop-loss orders? |
|---|
If you've mastered the art of reading a chart pattern, you've mastered trading, that's what I believe in. There are high and low points in each market chart pattern and each point indicates us the oppurtunities of buying and selling.
There are usually three chart patterns:
Uptrend Pattern
Down trend Pattern
Consolidating (Sideways) Pattern
Uptrend Pattern |
|---|
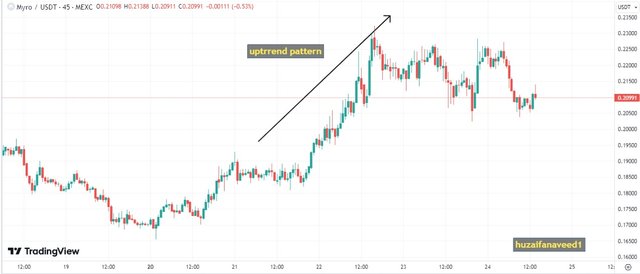
An uptrend pattern in a chart is characterized by the continuous upward movement of an asset's price, marked by a series of higher highs and higher lows. This indicates that each successive candle is higher than the previous one, and each subsequent trough is also higher than the prior one. Such a pattern reflects sustained buying interest and growing bullish sentiment in the market.
Downtrend Pattern |
|---|
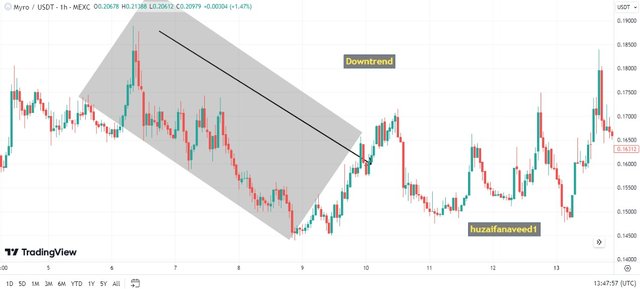
A downtrend pattern is when the subsequent candles make lower highs and lower lows indicating a drop in the marke price signifying the increased bearish sentiments in the market.
Consolidation (Sideways) Pattern |
|---|
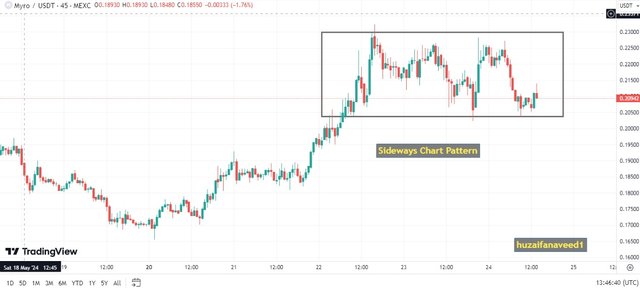
This pattern is observed when neither the buyers nor the sellers are in complete dominance and the price moves in a sideways directions with minor swing movements yet nothing major movement of any sort.
all pictures are taken from tradingview

Continuation and Reversal Patterns |
|---|
Identifying a continuation or a reversal pattern in the early stages is extremely important while trading so that we can effectively place our stop losses. When identifying these patterns it is of utmost importance to assess the sentiments of the market.
The ascending triangle pattern signifies a bullish trend continuation. It is formed when there's a resistance line connecting several peaks, alongside an upward-sloping trendline connecting higher lows. During the consolidation phase within this triangular pattern, buying momentum tends to rise. Traders anticipate a bullish breakthrough when the price surpasses the flat resistance line, confirming the ongoing upward trend. Understanding and spotting such patterns empowers traders to identify potential entry and exit points, manage risks effectively, and seize profitable opportunities in the ever-evolving crypto market.
Talking about the trend reversal pattern it's of utmost importance to have a strong grip of the market and being ready to identify early trend reversal patterns. There are a lot of trend reversal indications such as the head and shoulder pattern, abandoned baby candlesticks, bearish 3 soldiers etc but the most important thing is to identify an early trend reversal when there's a break of the neckline. In an uptrend, a trend reversal is seej when there's a lower hugh and lower low formed at the top of the uptrend.
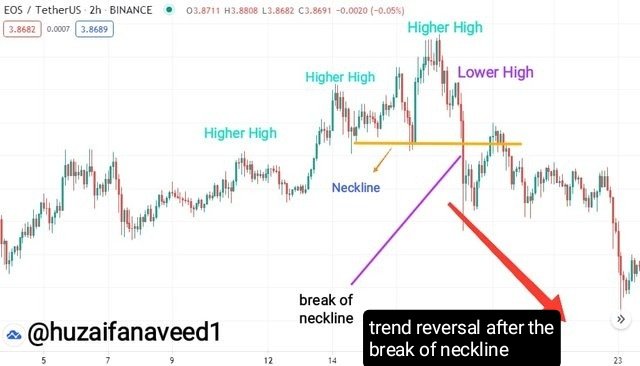
Capitalizing on early trend reversals and trend continuations involves applying various strategies, one of which is placing tight stop losses.
A stop loss is a tool used to limit potential losses on a trade. It is an order placed to buy or sell an asset once it reaches a certain price level, known as the stop price.
In trend reversals, a tight stop loss is placed just beyond the neckline level where the reversal is likely to occur. This allows traders to exit the trade quickly if the market moves against their position, minimizing losses. By identifying key support or resistance levels, trendline breaks, or technical indicators signaling a potential reversal, traders can place stop losses strategically to protect their capital.
For trend continuations, tight stop losses serve a similar purpose but are placed differently. Instead of aiming to exit the trade at the first sign of a reversal, traders use tight stop losses to protect profits and ensure they capture as much of the ongoing trend as possible. As the price moves in the direction of the trend, traders adjust their stop losses accordingly, trailing behind the price to lock in gains while allowing for potential further upside.
For using effective stop losses support and resistance levels are most important alongside technical indicators. I prefer to use the dynamic support and resistance strategy which I'll explain in the next question.

What is Trading View and how can it be used to apply technical indicators in real-time trading? Describe the relationship between support and resistance levels and how technical indicators can aid in understanding these concepts. |
|---|
TradingView is a platform offering traders and investors, to have a comprehensive details of market insights and charting tools. It serves as a hub where market participants can access a wealth of information on various assets, spanning from fiat currencies cryptocurrencies.
TradingView offers an extensive functions and options that are invaluable for real-life trading. Its platform caters to both spot and futures markets, providing traders with a comprehensive charts to analyze and interpret market movements effectively. One of its key features is the wide range of technical indicators available, helping traders to make decisions to make profitable trades.
Whether you're an experienced trader or just starting out, TradingView's user-friendly interface makes it easy to navigate through charts, set up custom indicators, and execute trades with precision. From simple moving averages to difficult indicators such as the Fibonacci retracements etc, TradingView covers a broad spectrum of technical analysis tools, allowing traders to tailor their strategies to suit their individual preferences and trading styles.
Lets see how to apply indicators on trading view.

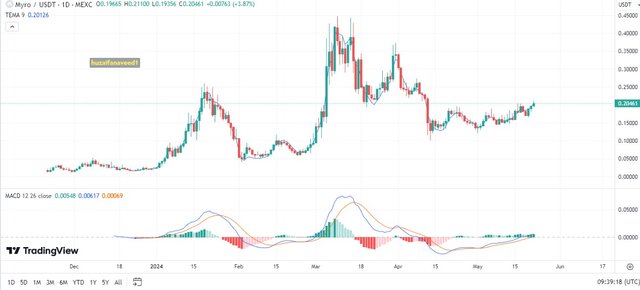
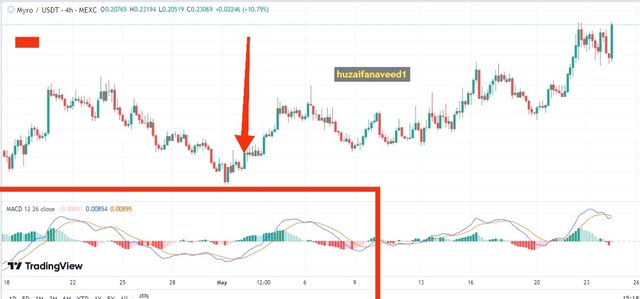
- Open the Trading view website and search for an asset of your choice in the crypto section. I opted for MYRO/USDT
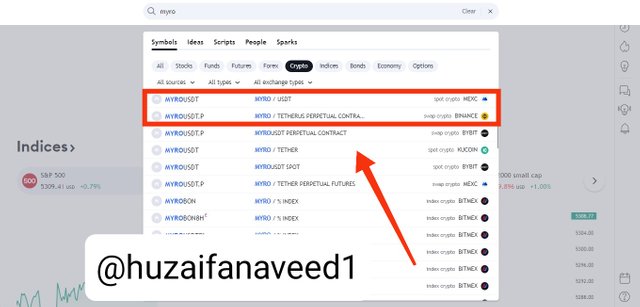
- Once the chart is displayed, click on the Indicators options
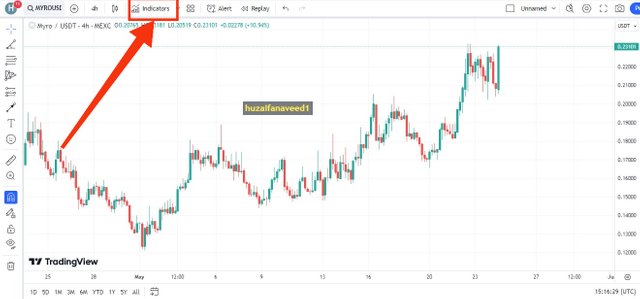
- Once the indicators bar opens up, search for the indicators of your choice. I chose MACD
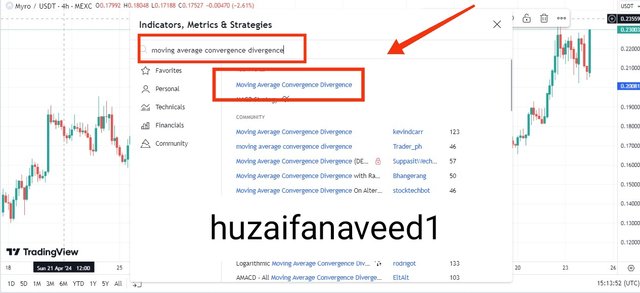
- The indicator will be applied on the chart.

Support |
|---|
The support area on the chart is the level where the asset's price bounce backs up. There are strong support levels as well as weak support levels. Strong support levels tend to hold the price while a weak support is unable to hold the price and the asset's price falls further down. Traders need to be extremely cautious while trading in these levels.
Resistance |
|---|
Resistance is the complete opposite of the support level and as the name suggests it creates a himdrance in the upward movement of an asset's price. It's a barrier that causes the price to not penetrate through. Similarly, resistance levels could be weak and strong.
Role of technical indicators |
|---|
I'm sure what I'm about to show would be new to a lot of new traders but believe me it's one of the best things that you can execute while trading. Technical indicators are of utmose importance in support snd resistance levels. How so? Because of:
Dynamic Support
Dynamic Resistance.
The Dynamic Support and Resistance levels differ from the normal Support and Resistance in such a way that usually the Support and Resistance levels are horizontally drawn lines from where the price bounces up or down.
The Dynamic Support and Resistance levels move alongside the price and regulate themselves with the fluctuations in price.

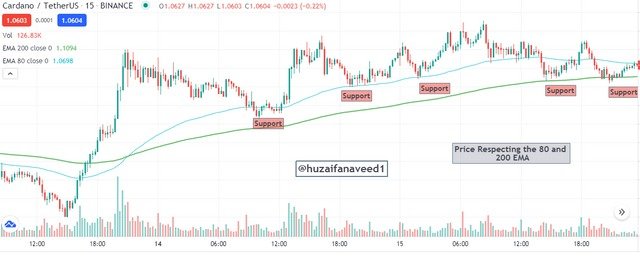
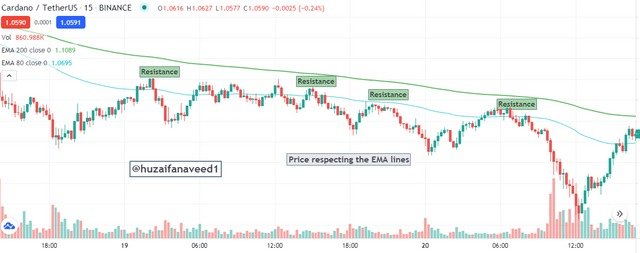
pictures are taken through trading view

Provide an overview of pivot points and discuss their calculation and significance in trading. Explain how to configure and trade with pivot points, including strategies for pivot point reverse trading. |
|---|
Pivot point is a technical indicator, formulated by Mr Manning stoller in the 1980s, which helps us pick-out the whole market trend over different time frames.
The pivot point uses the intraday highs and lows which are the previous days highs and lows and the closing prices of the previous day, through which the pivot point can be calculated.
There are basically three points.
The main point known as the Pivot point.
The points above the Main pivot point known as the resistance levels
The points below the pivot point known as the support levels
Pivot Point Levels |
|---|
A pivot point has 5 levels with the main pivot point in the center with 3 resistance levels above it and 3 support levels below it. Lets get to it in detail.
MAIN Pivot point level: Positioned at the center, this serves as the primary pivot point on the chart. When the market surpasses this level, it signifies a bullish market, suggesting potential profit-taking by selling assets. Conversely, if the market falls below this central level, it indicates a bearish market, prompting strategic investment decisions in chosen assets.
RESISTANCE (R1): Indicating an overbought scenario and the onset of a bullish market, R1 presents two potential market directions: either a reversal towards a downward trend or a breakout towards an upward trend.
RESISTANCE (R2): Positioned above R1, R2 represents the second resistance level. Reaching R2 signifies a bullish market trend, with possibilities for further upward movement or a retracement downwards.
RESISTANCE (R3): This marks the final resistance level above the pivot point. R3 signifies an overbought condition, where the market may either undergo a pullback or continue upwards towards a bullish trend.
SUPPORT (S1): Situated just below the central pivot point, S1 denotes an oversold state, signaling the commencement of a bearish trend. At this juncture, prices may rebound into a reverse trend or breach the support level, extending into the bear market.
SUPPORT (S2): Positioned as the second level beneath the central pivot point, S2 also reflects an oversold condition. Here, prices might either bounce back, initiating a reversal, or breach the support level, prolonging the bearish trend.
SUPPORT (S3): Located as the third level below the central pivot point, S3 presents similar dynamics. Prices from this level may either rebound, triggering a reversal, or break the support level, extending further into the bear market. This level also signifies an oversold condition.
Calculation |
|---|
Pivot point = [High(of previous day) + Low + Close]/3
R1
Resistance (R1) = [2 × PP - Low]
R2
Resistance (R2) = [PP + High - low]
Where,
PP = pivot point
High = the daily high
Low = the daily low
S1
Support (S1) = [2 × PP - High]
S2
Support (S2) = [PP - High - Low]
Pivot Point on a chart |
|---|
- Click on the Indicators options

- Search for Pivot Points and click on Pivot Points standard
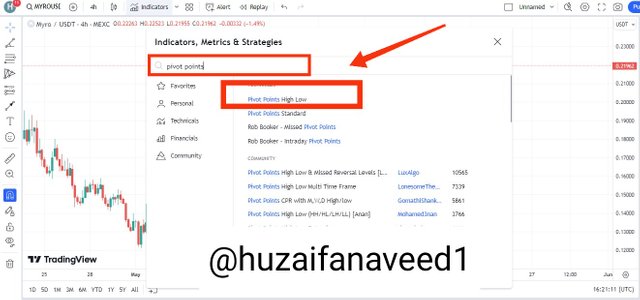
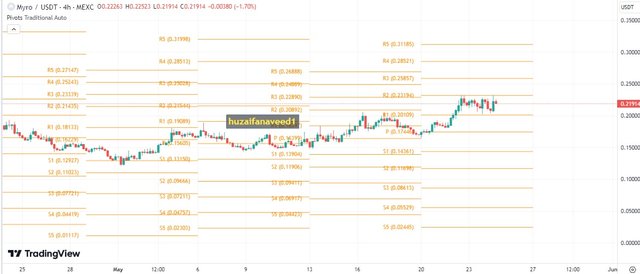
- Pivot Points will be applied on the chart like this
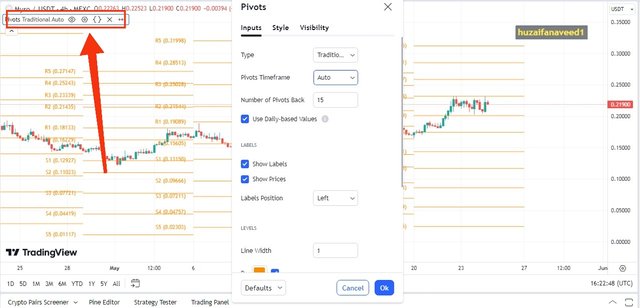
- To change the settings and the timeframe of the Pivot Points, click on settings as shown in the picture below a popup will appear
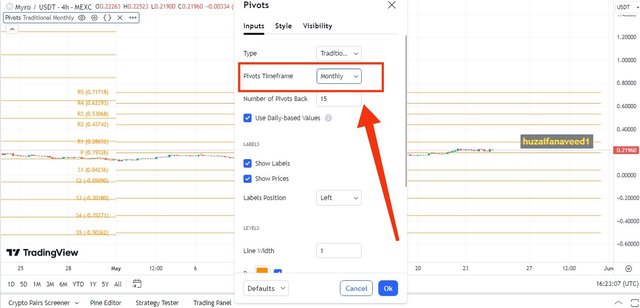
- I've changed the timeframe to monthly

Conclusion |
|---|
The reason of writing this much is due to technical analysis being my favorite topic in the crypto market. I believe if you've mastered technical analysis, you have mastered trading. If you know how to read charts, you know how to mak profits. I hope you learned something from my post.
Regards,
Dr Huzaifa Naveed
Your efforts in creative such a comprehensive content is appreciable. Here is my reflection on some points ;
I believe as a trader, understanding technical analysis is crucial. It helps you predict where prices might go next by looking at past trends and patterns, giving you an edge in making informed decisions.
When you see a bullish candlestick, it means the market is moving up. I think this is important for traders because it shows that the opening price was lower and the closing price was higher, indicating strong buying pressure and a potential uptrend.
I find dynamic support and resistance levels very helpful for trading. Unlike static levels, they adjust as the price changes, providing more accurate and timely information on where the price might reverse or continue its trend, which is vital for making quick trading decisions.
Good luck
Downvoting a post can decrease pending rewards and make it less visible. Common reasons:
Submit
TEAM 5
Congratulations! Your comment has been upvoted through steemcurator08.Downvoting a post can decrease pending rewards and make it less visible. Common reasons:
Submit
Than you for taking out your time to visit my post
Downvoting a post can decrease pending rewards and make it less visible. Common reasons:
Submit
Thanks for inviting me to this post which offers a lot to learn. I wanted to participate in this contest but I am traveling at this moment so it's not possible for me to UAE all the tools I need to cover this investment contest. You know, as a marketing professional I have a little knowledge of this topic but maybe next time. My best wishes for this contest to you.
Downvoting a post can decrease pending rewards and make it less visible. Common reasons:
Submit
Safe travels bro
Downvoting a post can decrease pending rewards and make it less visible. Common reasons:
Submit
TEAM 5
Congratulations! Your post has been upvoted through steemcurator08.Downvoting a post can decrease pending rewards and make it less visible. Common reasons:
Submit
Hello friend to be sincere you're one of the best when it comes to creating crypto related articles especially during this engagement challenges your content gives me insight on educational fact that's could improve one crypto related knowledge.
Support lines and resistance levels are one of the best set of tools that I love using this is because they have been proving to be trustworthy and indeed they have made me generate some little profit from trading
If you are free, you can comment on my article through the link below https://steemit.com/hive-108451/@starrchris/sec-s18-w1-or-or-mastering-the-markets-with-technical-analysis
Downvoting a post can decrease pending rewards and make it less visible. Common reasons:
Submit
Tu contenido está excelente, muy completo. Me gustó mucho la presentación bien estructurada con imágenes muy esclarecedoras. Por eso el dicho una imagen dice más que mil palabras.
Resalta el dominio en la materia, aportando información y conocimientos muy valiosos a tus lectores. ¡Eso es excelente!
¡Te deseo mucha suerte y éxitos, saludos y un fuerte abrazo!
Downvoting a post can decrease pending rewards and make it less visible. Common reasons:
Submit
@huzaifanaveed1 Your efforts to save our oceans are truly commendable. It's inspiring to see people like you taking action to protect marine life and reduce pollution. The underwater photos you shared capture the beauty of our oceans and remind us why its so important to keep them clean. Thank you for raising awareness and motivating others to join this important cause. Good luck in the contest
Downvoting a post can decrease pending rewards and make it less visible. Common reasons:
Submit
??
Downvoting a post can decrease pending rewards and make it less visible. Common reasons:
Submit
In the future GoGo Dramas success will be determined by how it manages intellectual property laws and whether it can transform into a viable business strategy by getting the appropriate licenses.
Downvoting a post can decrease pending rewards and make it less visible. Common reasons:
Submit