Hello guys

Its another season of this week’s crypto academy this week’s lecture was all about Elliot Wave theory, impulse and corrective waves theory. After reading the lecture notes and doing some research I hereby present my assignment
APPLICATION OF ELLIOT WAVE THEORY
This theory was formed on the principle that the market follows some kind of a pattern. Now this pattern makes it possible to predict the price of any cryptocurrency this idea was formulated by Ralph Nelson Elliot hence the name Elliot theory. Based on the concept of this theory I would it helps investors to be able to price forecast any cryptocurrency. To be able to predict the price of any asset Elliot proposed that the pattern contains five waves called impulse waves these waves move in the direction of the trend and another set of waves called corrective waves these waves are three in number they usually move against the motion or against the trend. The impulse waves are numbered from 1 to 5 whiles the corrective waves are lettered from A to C. the combination of these waves provides a complete wave theory. Just like every theory the are rules governing them to be able to effectively predict an asset you must adhere to these rules
Wave 4 never enters wave 1
Wave 3 is always a long impulse wave
Wave 2 should not move beyond the start of wave 1
When these important rules are taken into considerations an effective forecast is guaranteed.
WHAT ARE IMPULSE AND CORRECTIVE WAVES
From the above application of the wave theory I made mention of the two types of waves which are the impulse waves and the corrective waves now I will explain them further
IMPLUSE WAVES
I already mentioned that impulse waves move in the direction of the trend of the cryptocurrency that is basically what they do they always numbered 1 to 5 each wave has its significance and that’s what I will be elaborating more about let’s go
The first wave the start of the waves now at this point the price of the asset is lower so some investors will buy so that profit will be made once the trend goes up
Second wave once the trend begins to rise in investors who bought in the first wave will begin to sell for profit when they do so it creates a bearish trend
Third wave now with the third wave the value of the asset tends to rise again making a bullish trend this wave is the longest of all the waves investors tend to make a lot of profits.
The fourth wave this is where the value begins to decline because once the investors make their profits, they trade their asset making a bearish trend again.
The fifth wave is the last of the waves. At this point the market is always bullish because this region is always overpriced.
CORRECTIVE WAVE
Well this wave moves against the trend they are three waves lettered A to C, wave A and C have the same trend whiles wave B moves in the opposite direction. When the wave A and C moves in the same direction and wave B moves in the opposite direction a zig zag pattern can spotted, when all the points in the market trends are equal its usually flat very difficult to read. The triangle pattern is also very hard to read it shows the declination of the volume.

WHAT ARE MY THOUGHTS ON THIS THEORY AND WHY?
i think when the trader is able to understand the theory well and know the rules of the waves like for instance the third wave should not be shorter than the second and also the second wave should not overlap the first wave if you are able to understand it well it will come a long way to help investors to make good profit so for me i think its a good theory but my advise is that make sure you understand it well before going into it because if you mess up with the rules you wont be able to achieve you goal.
CHOOSE A COIN CHART IN WHICH YOU WERE ABLE TO SPOT ALL IMPLUSES AND CORRECT WAVES AND EXPLAIN IN DETAIL WHAT YOU SEE
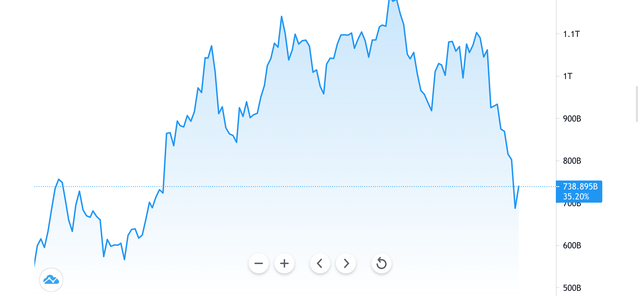
For this task i will be choosing BTC/USDT

From the graph you can see the impulse waves 1,2,3,4,5 continued by the corrective waves A,B and C. when i was explaining corrective waves i made mention that when A and C move in the same direction B moves in the other direction forming a zig zag shape now if you look at the graph you can clearly see that shape wave A moving downwards and wave C also moving downwards. looking at the graph wave 3 clearly is the longest and that's where lots of profit was made which also clearly satisfies one of the rules of the waves.
it can also be see that wave 2 has not overlapped wave 1 meaning another rule satisfied. Again wave 4 cannot enter wave 1 this means the price of wave 4 cannot enter the price of wave 1 as seen in the graph

CONCLUSION
My general remarks for this topic this week is an A+ because it has given me incredible knowledge and broaden my understanding at first i only heard about this theory but thanks to steemit and our professor @fendit i now have gained some valuable information thank you for this wonderful lecture.
THANKS FOR READING

Thank you for being part of my lecture and completing the task!
My comments:
This work just makes no sense. There are a lot of paragraphs that don't say anything, regarding the first task.
On the second one, you didn't show the pattern on the chart.
Overall score:
2/10
Downvoting a post can decrease pending rewards and make it less visible. Common reasons:
Submit
It's because he plans to do this again -
https://steemit.com/hive-108451/@jimah1k/crypto-academy-season2-week6-assigmment-post-for-fendit-by-jimah1k
Downvoting a post can decrease pending rewards and make it less visible. Common reasons:
Submit