

What is your understanding of the TRIMA indicator?
The TRIMA Indicator (Triangular Moving Average) is a trend-based indicator. We can say it is an improved version of the simple moving average indicator. As we are all aware, the SMA works by plotting the average price of an asset at a particular point in time on our chart. Due to the extreme volatile nature of the price of crypto assets, we saw that the SMA was disadvantageous because it is a lagging indicator, and it often reacts quickly to every price fluctuation in the market, even the ones generated by market noise. As a result, it often leads to the generation of false signals and inaccurate market analysis.
The TRIMA indicator was created to rectify these proble s with the SMA, and it is sometimes known as a double smoothed SMA. The TRIMA indicator helps us to know the average price of a crypto at each point in time by smoothing 2 SMAs. This means the TRIMA indicator is averaged twice and as such, the indicator is able to filter out market noise, and does not easily react to unnecessary price fluctuations causes by the volatile nature of cryptocurrencies.
This gives traders a better tool for technical analysis, where results are more accurate, and signals can be trusted. This indicator is also very useful in spotting the market trend at any point in time and as such, the indicator is more suitable for a trending market.
Setup a crypto chart with TRIMA. How is the calculation of TRIMA done? Give an illustration. (Screenshots required).
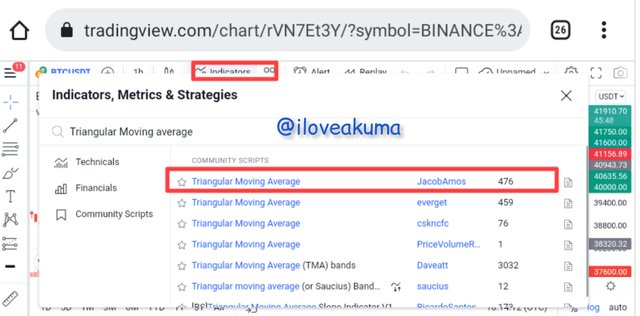
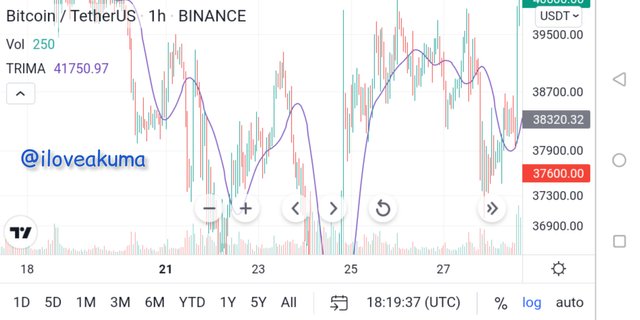
To set up the indicator on our chart, we do the following;
• Firstly, login in to tradingview and load up your chart. Once that is done, scroll to the indicators tab and click on it. Proceed to search for Triangular Moving Average, using the search bar. Once you find it, click on it so as to insert it on your chart.
calculation of the TRIMA indicator
As I mentioned above, the TRIMA indicator can be said to be a more advanced form of SMA indicator. The TRIMA indicator is calculated using the SMA. Firstly, we will need to calculate the value of SMA of the crypto, which can be calculated as;
SMA = (P1 + P2 + P3 + P4 +...Pn)/ n
Where P = price of an asset at a particular period
Pn = price of asset in the last period
n = total number of periods.
We can now determine the TRIMA value by averaging the SMA values as seen below;
TRIMA = (SMA1 + SMA2 + SMA3...+SMAn)/n
With the formulary above, we can come out with the TRIMA indicator value.
Identify uptrend and downtrend market conditions using TRIMA on separate charts.
The TRIMA indicator is very useful for determining general market trend, as this will go a long way to help traders make correct trading decisions. Traders can buy when the indicator signals an uptrend move, and sell when its a downtrend move. This indicator is also very useful for both scalpers and swing traders. Scalpers can configure the settings to lower periods for their trading, while swing traders can configure it to higher periods for more long term trading.
UPTREND
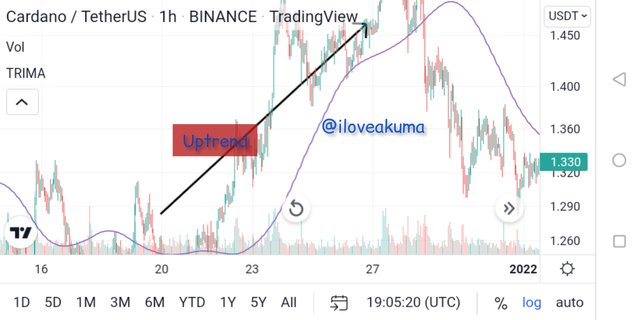
An uptrend represents a bullish move in the market. Buyers are dominating sellers. This market is usually characterized by price forming higher highs and higher lows. We can use the TRIMA indicator to spot this uptrend move because the following will happen.
• Firstly, price will break above the TRIMA indicator.
• As the uptrend move continues, price will continue to be above the TRIMA indicator
• The TRIMA indicator will act as dynamic support. Once price breaks below the TRIMA indicator, we should expect a downtrend move.
DOWNTREND
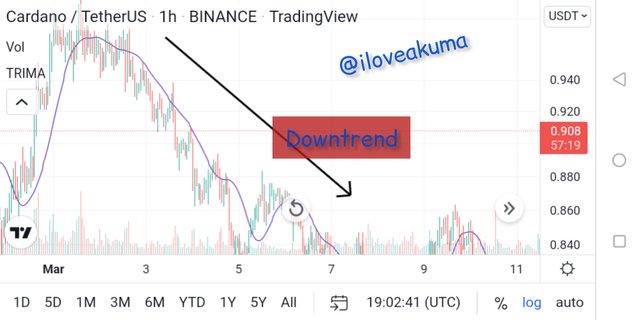
A downtrend represents a bearish move in the market.sellers are dominating buyers. This market is usually characterized by price forming lower highs and lower lows. We can use the TRIMA indicator to spot this downtrend move because the following will happen.
• Firstly, price will break below the TRIMA indicator.
• As the downtrend move continues, price will continue to be below the TRIMA indicator
• The TRIMA indicator will act as dynamic resistance. Once price breaks above the TRIMA indicator, we should expect an uptrend move.
With your knowledge of dynamic support and resistance, show TRIMA acting like one. And show TRIMA movement in a consolidating market. (Screenshots required).
The TRIMA indicator can act as both a dynamic support and resistance. In an uptrend move, price is usually above the TRIMA indicator. In such a situation, the TRIMA indicator will be acting as a dynamic support for price. Price w action will continue playing out and from time to time, we would actually see price bounce off the TRIMA indicator. Once price succeeds to break below the TRIMA indicator, traders should expect a downtrend, and in that situation, the TRIMA indicator will begin acting as dynamic resistance.
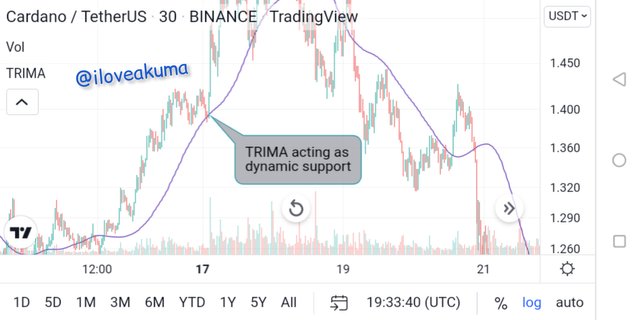
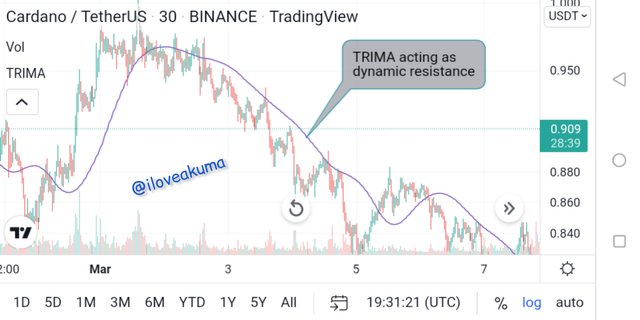
From the charts above, we can see the TRIMA indicator acting as both support and resistance. We can see price bouncing off the dynamic support/resistance before eventually breaking out. All this information given by the TRIMA indicator will go a long way to help traders trade more profitably. Traders can go long the moment the support rejects price, and they can go short the moment the resistance rejects price.
TRIMA in a consolidating market
A consolidating market is one in which there is equilibrium between buying and selling pressure. There is neither an uptrend nor downtrend, as neither bulls nor bears are dominating. Such a market is usually characterized by price just moving between support and resistance levels. The market is not trending.
In such a market, the TRIMA indicator woul neither be above nor below price action. This is because the TRIMA indicator will be moving inside price. The TRIMA indicator will almost be like a horizontal line.
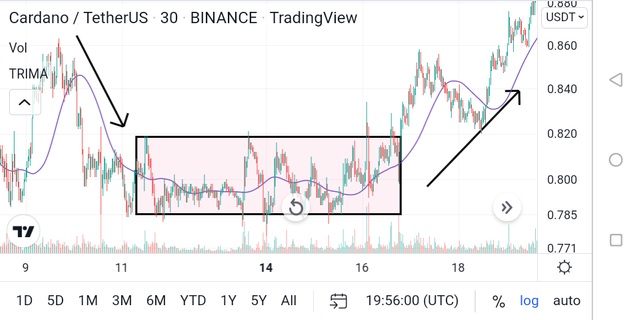
As we can see on the chart above, the market was previously in a downtrend, before becoming a ranging market. It consolidated for a while between support and resistance levels before eventually breaking out to form an uptrend. During the ranging phase, we can see the TRIMA indicator moving within price.
Combine two TRIMAs and indicate how to identify buy/sell positions through crossovers. Note: Use another period combination other than the one used in the lecture, explain your choice of the period. (Screenshots required).
As I already mentioned above, one of the key difference between TRIMA and SMA is the fact that TRIMA doesn't react very quickly to price movements in a very volatile crypto market. And as such, the TRIMA indicator is a lagging indicator. This means the indicator will only give a signal, once the move has already began. This means traders a re loosing out on some action, and at times, the indicator can give a signal when a move is already lossing momentum, and an unlucky trader will end up with losses
Inorder to rectify the a I've problems, we need to combine 2 TRIMA indicators in our trading system. One should be from a higher time period, and the other from a lower time period. We can now be able to identify moves using the crossover strategy. For illustration, I will be using the 9 period and 25 period TRIMA. This perfectly fits my system as a scalper.
Buy Signal
Whenever the shorter period TRIMA crosses over the longer period, that is an indication of an uptrend move. Traders can take their entry at the point where the crossover happened.
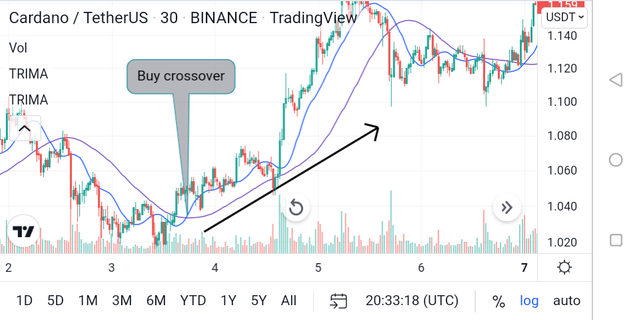
From the ADAUSDT chart above, we can see that once the 9 period TRIMA crosses over the 25 period TRIMA, it led to an uptrend move. As long as the 9 period TRIMA is above the 25 period TRIMA, the uptrend move holds. Traders can hi long when the crossover happens.
Sell Signal
Whenever the longer period TRIMA crosses over the shorter period TRIMA, that is an indication of an downtrend move. Traders can take their entry at the point where the crossover happened.
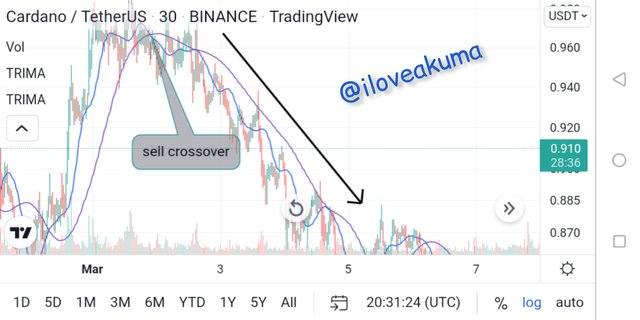
From the chart above, we can see that once the 25 period TRIMA crossed over the 9 period TRIMA, it led to a downtrend move. As long as the 25 TRIMA is above the 9 period TRIMA, the downtrend move holds. Traders can go short once the crossover happens.
What are the conditions that must be satisfied to trade reversals using TRIMA combining RSI? Show the chart analysis. What other momentum indicators can be used to confirm TRIMA crossovers? Show examples on the chart. (Screenshots required).
As I have earlier mentioned in this task, the TRIMA indicator is a lagging indicator. And as such, it is reactive in nature and so it'll be quite difficult to use it only to determine trend reversal, as the indicator will react only after the trend reversal has begun. We need another indicator which can be combined with the 2 TRIMA indicators, so as to accurately spot trend reversal. The RSI indicator perfectly suits this role.
Conditions For Bullish Reversal
Inorder for traders to accurately spot reversals using the the 2 TRIMA crossover and the RSI indicator, the following conditions need to be fulfilled;
• Firstly,we need to add two TRIMA indicators to our chart. One should be a longer period and the other a shorter period. Also, add the RSI indicator to the chart.
• The RSI should enter the oversold region during a downtrend or a ranging market. This acts as a bullish reversal signal, but don't take your entry just yet.
• Wait for the shorter period TRIMA to crossover the higher period TRIMA.
After this happens, in both indicators, you can go long after the formation of at least two bullish candles.
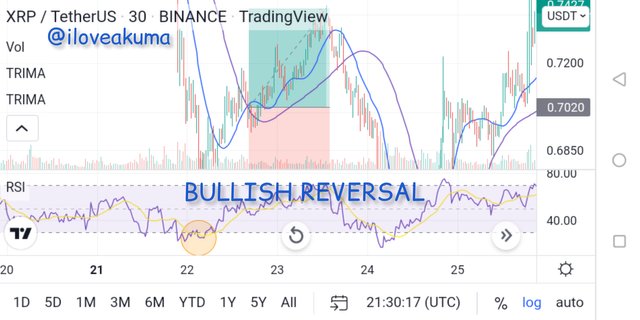
As can bee seen on the chart above, the market was initially in a downtrend, then the RSI indicator reached the oversold zone. Shortly after that, the bullish crossover happened and I tool me entry after the formation of 2 candles, setting my stop loss just below the crossover and using a risk to reward ratio of 1:1 to set my take profit.
Conditions For Bearish Reversal
The following conditions must be met for a bearish reversal to occur:
•Firstly,we need to add two TRIMA indicators to our chart. One should be a longer period and the other a shorter period. Also, add the RSI indicator to the chart.
• The RSI should enter the overbought region during an uptrend or a ranging market. This acts as a bearish reversal signal, but don't take your entry just yet.
• Wait for the longer period TRIMA to crossover the shorter period TRIMA.
After this happens, in both indicators, you can go short after the formation of at least two bearish candles.
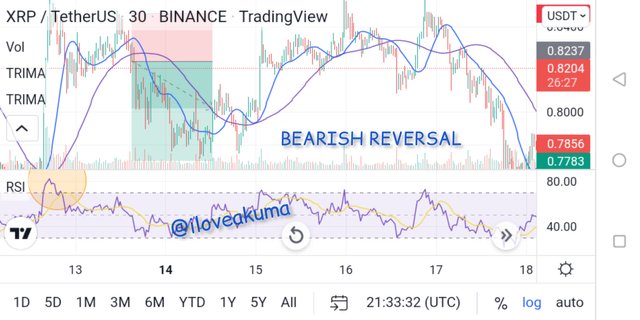
From the chart above, we can see that all the conditions were met for the bearish reversal. The RSI entered Its overbought zone shortly followed by the crossover, and then we make the entry. I used the risk to reward ratio 1:2 to set my stop loss and take profit respectively.
Using MACD and TRIMA indicator to confirm trend Reversal.
The MACD is a momentum based indicator. It combines two EMAs to give us accurate results. This indicator is also very advantageous due the fact that EMA reacts faster than TRIMA. Therefore, the MACD will give us information about potential reversal long before the TRIMA indicator does. We can detect trend reversal from the MACD by also looking at the crossing over of the two EMAs which make up the indicator.
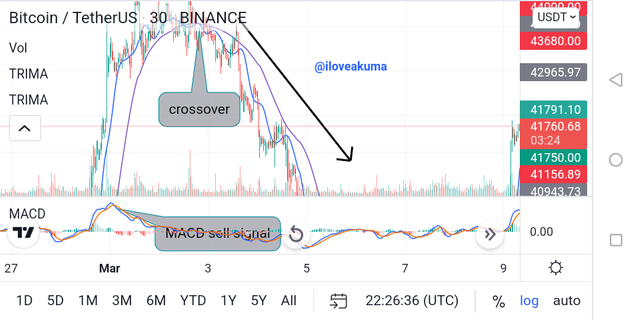
As can be seen above on the chart, the MACD gave us the signal of the bearish reversal long before the TRIMA did. I believe if these 2 indicators can be combined and used together, they'll go a long way to increase a trader's accuracy and profitability. Having 1 indicator is good, but having confluence from 2 indicators is even better.
Place a Demo and Real trade using the TRIMA reversal trading strategy (combine RSI). Ideally, bullish and bearish reversals. Utilize lower time frames with proper risk management. (Screenshots required).
Bearish Reversal
I executed this trade on the SOLUSDT pair as can be seen below;
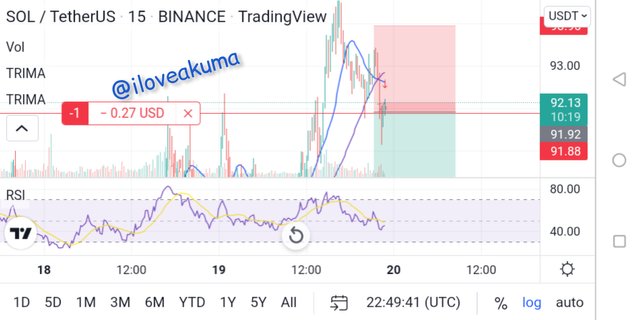
Image source: tradingview
As can be seen on the screenshot above, the SOLUSDT pair had previously been in an uptrend move. It gen reached the overbought zone on the RSI, and that was the first sign of price reversal. Shortly after, we can see that the 25 period TRIMA has also cit the 9 period TRIMA, and a couple of bearish candles have formed, so I decided to take my entry. I set my take profit at 89.92and my stop loss at 93.89 thereby using a risk to reward ratio of 1:1.
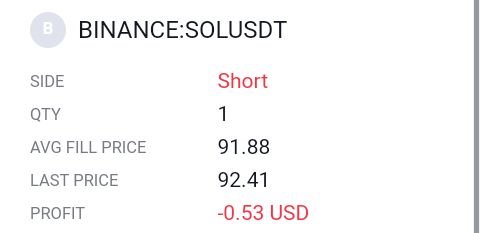
Proof of trade
My trade is still running though I'm currently in loss 0.53 dollars, but I am very much confident in the analysis and i'm sure the trade will be going as I predicted soon.
Bullish Reversal
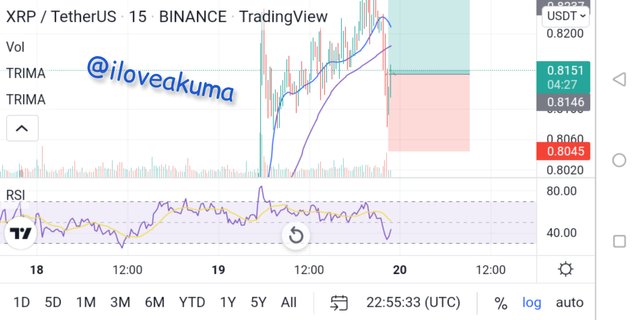
I executed this trade using the XRPUSDT pair. The pair was already in an uptrend move, but then it witnessed a pullback. So pullback was so strong that it sent the RSI to its oversold zone. I then took advantage and went long, setting my take profit at 0.8164, and my stop loss at 0.81.
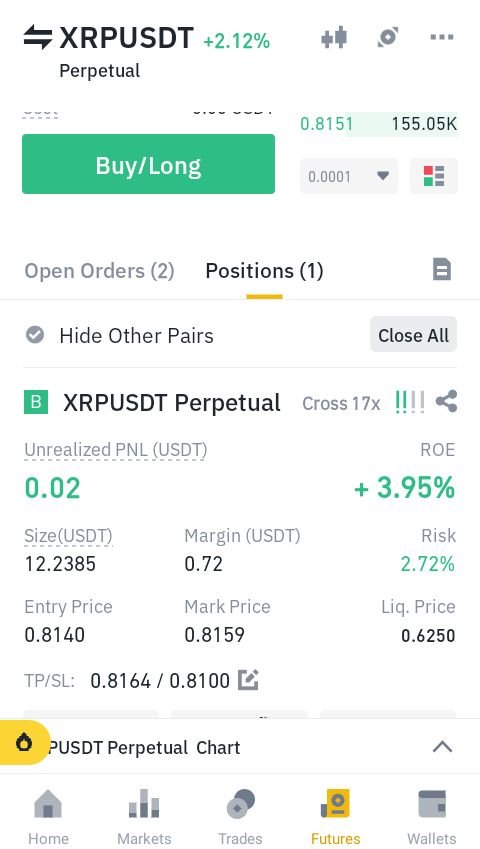
At the moment of doing this task, my trade has not hit the take profit or stop loss target yet. But I am in profit as can be seen below;

What are the advantages and disadvantages of TRIMA Indicator?
Advantages
• it helps to remove noise from the chart which is so common with SMA. This makes it very easy for traders to read charts.
• The indicator is very easy to set up and use. Added to that, it can be combined with other indicators so as to get more accurate results.
• The indicator can easily help us identify upcoming trends. It is also very useful for identifying trend reversals in the market.
Disadvantages.
• The indicator is a lagging indicator, so it reacts late. This can cause traders to miss out on important price action moves. Also, it is not advisable to use a single TRIMA indicator, so traders will need to know which two best work for them.
• As we are well aware, indicators can never be 100% accurate. They will always be faulty and attimes generate false signals. As such, it is not advisable to use this indicator a line. It works better when combined with another
CONCLUSION
I have been able to learn about this wonderful indicator called TRIMA. I thank the Prof for his time and sacrifice. I am now able to know market trend using this indicator, identify bullish and bearish reversal with this indicator, find confluence with this indicator amongst others.
I believe if all traders can use this indicator properly, it will go a long way to increase accuracy and profitability in trading. Thank you so much for this wonderful lecture Prof. I look forward to learning from you soon.
