My name is Imantha and I'm from Sri Lanka. I hope to learn lots of new things about crypto and crypto trading from these homework series. Thank you to everyone who takes their time to make this course series happen. I would like to thank crypto professor @fredquantum for giving us this homework.

1. What is your understanding of Triple Exponential Moving Average (TEMA)?
The Triple Exponential Moving Average is built on the existing Moving Averages to correct its limitations. This eliminates the lag associated with typical moving averages, making it easier to spot patterns This concept was developed by Patrick Mulloy. TEMA is a trend-based technical indicator that uses the 3 EMA's in the calculation of its values and filters and smoothers the signals. Price swings are smoothed down by using numerous moving averages. The TEMA's effectiveness stems from the fact that it employs repeated EMAs of EMAs, as well as a delayed correction in the calculation. It is observed to also use two TEMA to read some of its signals like making buy and sell positions as well uses the crossover trading strategy.
The TEMA is used to determine whether or not a trend is present. In a fluctuating market, it does not work as well. With long-term trends, the TEMA is the most simply employed indicator for trading. Analysts can more easily filter out and overlook periods of volatility when looking at longer patterns. The crossover trading strategy entails that one shorter TEMA setting and Longer TEMA setting are combined. And when the shorter time frame indicator line crosses above the longer period line settings, this indicates an Uptrend or Bullish crossover. When the same shorter period is observed crossing below the longer period, this shows a bearish trend. In both cases, TEMA allows us to make trade positions. When it is an uptrend, we are expected to make a Buy trade entry. But when it is on the downtrend we are going to enter a short (sell) trade entry.
TEMA is a trend-based technical indicator that was developed to smother the price value and other market noises.
TEMA concept ensures that it eliminates lagging in its technical indicator unlike what is obtainable in the existing Moving Averages.
TEMA is calculated by using 3 EMAs by substracting lags.
TEMA determines trend direction as well act as dynamic support and resistance levels.
2. How is TEMA calculated? Add TEMA to the crypto chart and explain its settings.
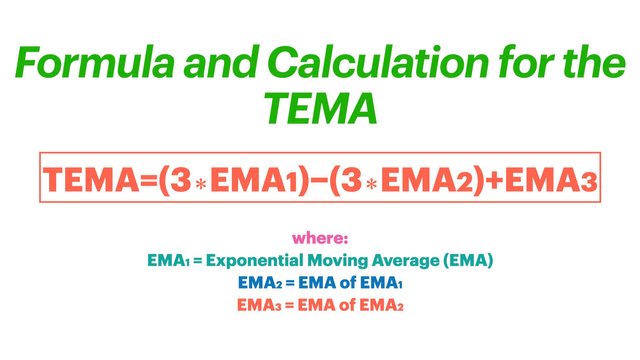
The triple exponential moving average (TEMA) uses 3 EMA calculations and subtracts out the lag to create a trend following indicator that reacts quickly to price changes. The calculation formula with steps is shown below. It’s important to remember that all the three EMAs used for the calculation of Triple Exponential Moving Average are at the same periods.
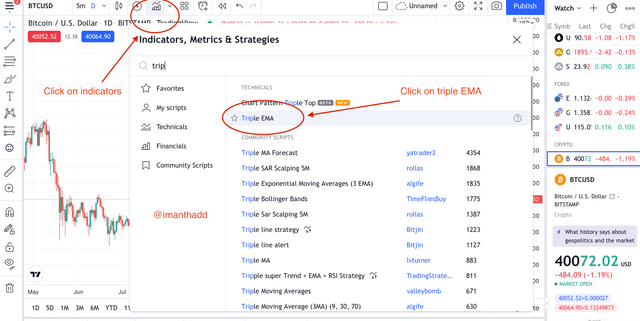
1.To add TEMA to chart involves going to trading.com and look and select it from indicators.
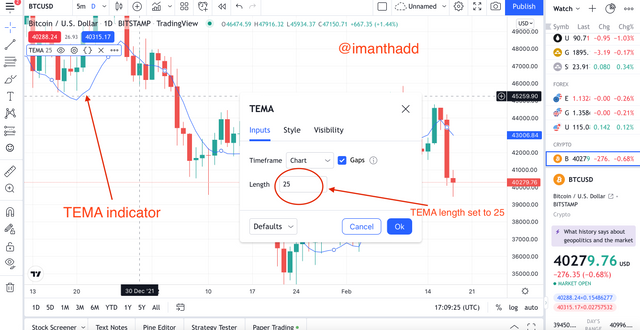
2.The default period is 9. I set my period to 25 so that the TEMA line can clearly be seen and can be differentiated from the price line.
3. Compare TEMA with other Moving Averages
EMA is the most similar moving average to TEMA. Since TEMA was developed based on EMAs, there are similarities and differences that exist between them. Both moving averages signal trend reversal or gives a buy signal after they might have gone below the price and therefore support the price in that position and both moving averages give signals for trend reversal and sell when they go over the price, therefore, resisting the price in that position but these two are not 100% accurate in giving the signals. They are still associated with a few wrong signals.
Some differences exist between these averages EMA and TEMA. While EMA is not glued to the chart, in most cases, TEMA is glued to the chart. These two cannot be used in the same chart to get signals while two TEMAs can be used in one chart to generate signals. The signals from TEMA is more reliable than those from EMA.
4. Explain the Trend Identification/Confirmation in both bearish and bullish trends with TEMA and Explain Support & Resistance with TEMA.
The bullish trend is when the price of the asset starts going up. It is a reversal from a downtrend to an uptrend. The bullish trend suggests a good time to buy because the price is going up.
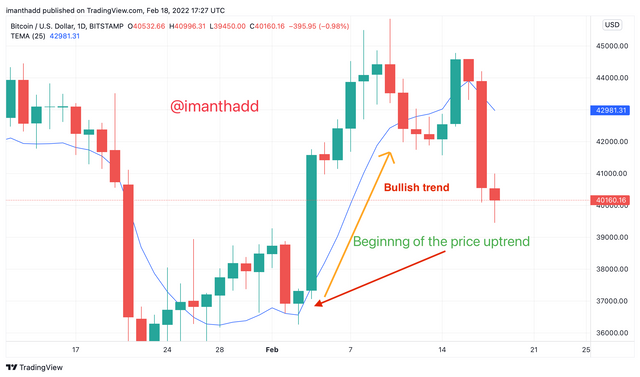
TEMA has proven to be a good indicator for the identification and confirmation of bullish trends. To identify this bullish trend on a chart, the price and the TEMA will definitely angle up and to confirm this bullish trend, the price of the asset will start going up and will trade above the TEMA line as shown above.
The bearish trend is when the price of a crypto asset starts going down. It is a reversal from an uptrend to a downtrend. Bearish trends suggest a good time to sell (make a sell position) because the price is going down.
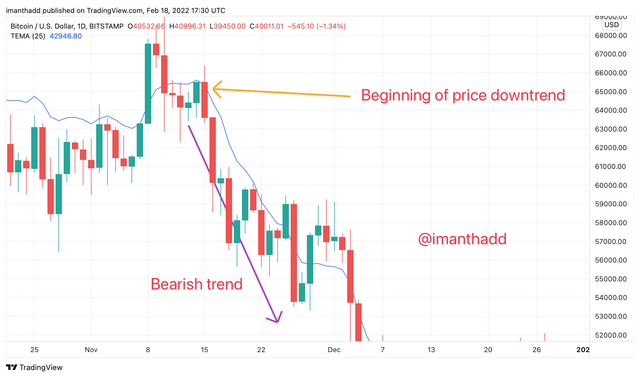
TEMA is a good indicator for identification and confirmation of the bearish trends. To identify this bearish trend on a chart, the price and the TEMA becomes angle down and to confirm this bearish trend, the price of the asset will start going down and will trade below the TEMA line as shown in the chart above.
Resistance is a point where the price of an asset cannot go further up, instead, it starts to go down which means there is a trend reversal. It marks the end of an uptrend and the beginning of a downtrend. Resistance is a time for traders to pull back and trade in the opposite direction (to set a sell position instead of a buy position).
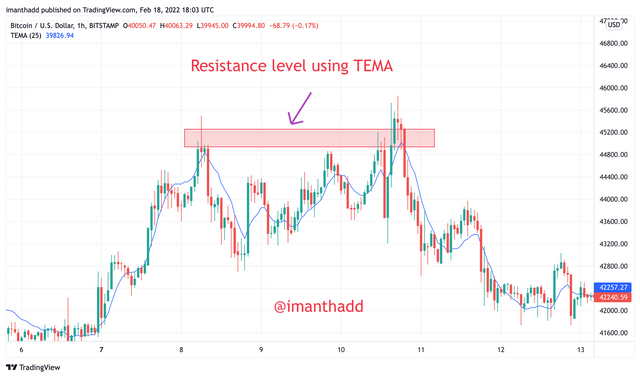
TEMA can also be utilised as a dynamic resistance level. A trend reversal from bullish to negative is indicated by the dynamic resistance level. So, In the image above, we can clearly see the dynamic resistance of the BTC/USDT chart after the bullish trend.
Support is a point where the price of an asset cannot go further down, instead, it starts to go up which means there is a trend reversal. It marks the end of a downtrend and the beginning of an uptrend. Support is a time for traders to pull back and trade in the opposite direction (to set a buy position instead of a sell position).
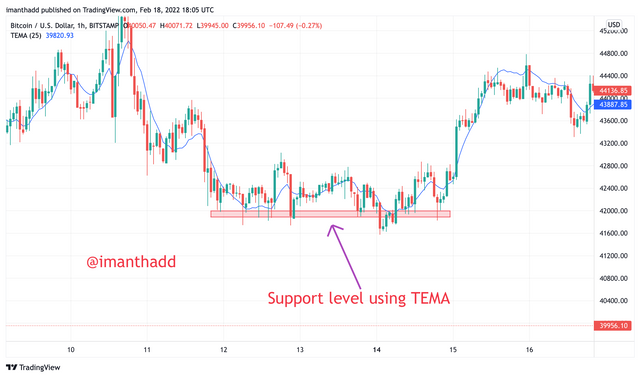
To identify and confirm support using TEMA, you will notice that the TEMA line will touch the price line and the price of the asset will start trading above the TEMA line. The dynamic support level implies a bearish to a positive trend reversal. In a negative trend, the dynamic support level is visible, and prices bounce off it. In the screenshot above, we can clearly see the dynamic support of the BTC/USDT chart after the bearish trend.
5. Explain the combination of two TEMAs at different periods and several signals that can be extracted from them. Note: Use another period combination other than the one used in the lecture, explain your choice of the period.
When the lower length TEMA crosses the higher length TEMA, then it means a price uptrend will happen and so it is a good buy position. When the TEMA set a higher period crosses that of the lower period, then it means a downtrend will happen and so it is a good sell position.
In my analysis, I made the lower period at 30 and the higher period at 65. You will notice that when the lower TEMA of 30(blue line) crossed the higher TEMA of 65(orange line). It’s a price uptrend which is a good opportunity to buy.
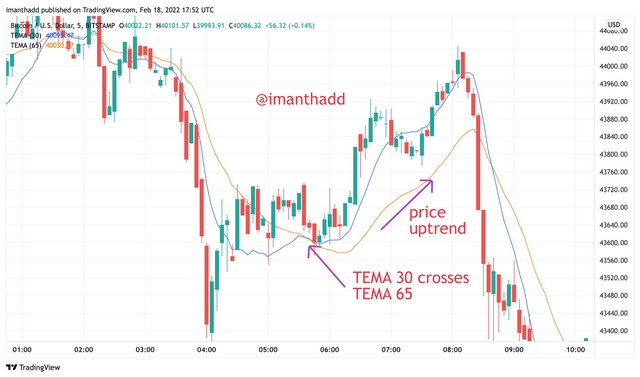
When I set the lower TEMA period at 30 and set the higher TEMA period at 65, the higher TEMA of 65 crossed the lower TEMA of 30 which is a downtrend and a good time to open a sell position.
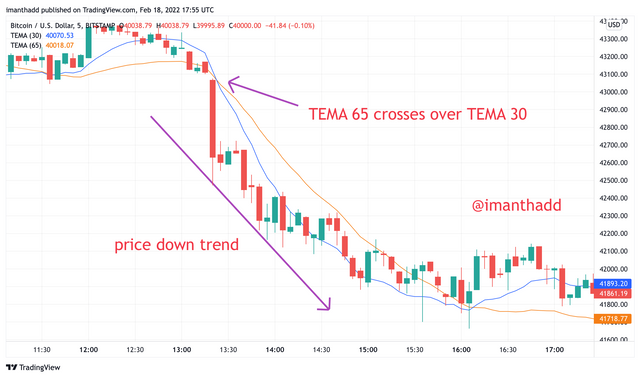
In my analysis, I chose 30 and 65 periods so that the price line won't cover or absorb the TEMA line. These 2 periods do not allow these 2 TEMA lines to absorb.
6. What are the Trade Entry and Exit criteria using TEMA?
Crypto trading, stocks, and other financial assets trading with TEMA for proper entry and exit necessitate the fulfilment of certain conditions. For entry and exits points with the help of TEMA. I would choose the combination of 2 TEMAs. The length of 1 TEMA is 20 and the other is 55.
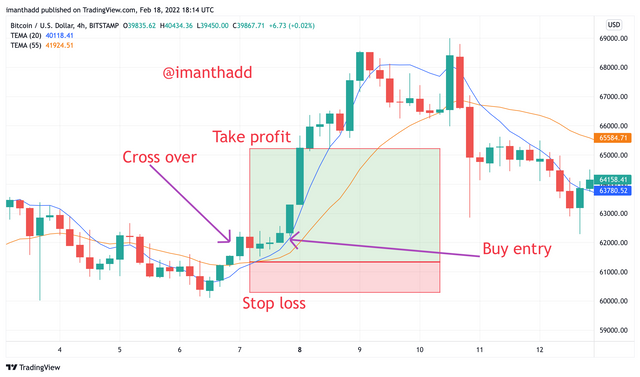
As the Tema (triple exponential moving average) (20) crossover the Tema (55) in the screenshot above, I make a buy entry after at least two candlesticks confirmation. My stop loss was set below the crossover.
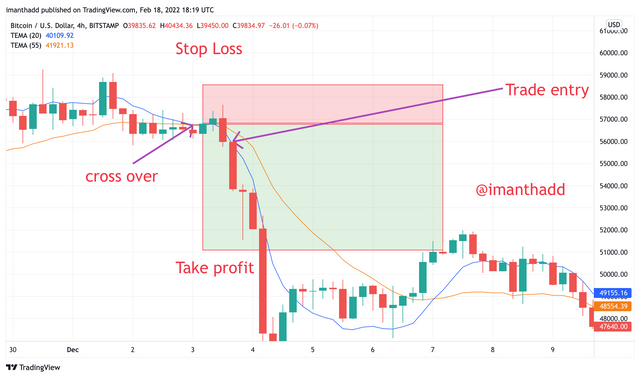
As the Tema (20) crossover the Tema (55) and goes down, I enter a sell position after seeing at least two bearish candlesticks, as shown in the screenshot above. I put my profit taking level and my stop loss level above the crossover for trade exit.
So, in this way, we can set our entry and exit criteria with the help of the TEMA Triple exponential moving average.
7. Use an indicator of choice in addition to crossovers between two TEMAs to place at least one demo trade and a real margin trade on an exchange (as little as $1 would do). Ideally, buy and sell positions (Apply proper trade management). Use only a 5 - 15 mins time frame.
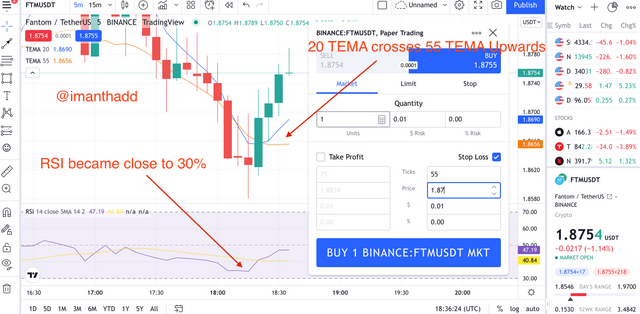
In this question, I will implement this technique using the RSI indicator, which is a very good indicator that is commonly used by crypto and other traders since it reveals a trend change with the strength of buyers and sellers.
In the FTM/USDT chart below, the 15-minute chart was used and it’s recommended by the professor. The shorter period TEMA(20) crossed over the longer period TEMA(20) as it crosses above it (55). This caused the FTM/USDT price to break above the TEMA line, indicating that the market is bullish. Now, if we look at the RSI, we can see the change of trend with active buyers, which is a good sign and we can enter into a trade.
8. What are the advantages and disadvantages of TEMA?
It is a trend-based technical indicator that was developed to smother the price value and other market noises.
TEMA concept ensures that it eliminates lagging to its minimal level.
It is calculated by using three (3) EMAs as well as substracting lags which makes signals a lot more reliable.
It determines trend direction as well as acts as dynamic support and resistance level for trade positions.
The TEMA reduces lag to its minimum level. Sometimes this doesn't go well for some investors who prefer a lagging indicator so as to keep track of more significant market effects.
During market volatility or choppy moments, the TEMA tends to provide little signals which hence provides false signals.
TEMA reacts faster than the SMA relative to price changes, this makes it difficult to sometimes ignore insignificant effects since it would react to every market push.
Conclusion
Triple Exponential Moving Average is a great improvement on the Moving averages. It takes care of lag effects associated with them. It reacts quickly to the price behaviour of an asset on the chart. TEMA is very effective in identifying trends, supports and resistances, trend change. Longer-term investors can choose a moving average with a bit less noise and a little more latency. One notable downside of this indicator is that it's not so suitable for trading in ranging markets as it's fast to react to price behaviour and this might result in some false signals. For valid buy and sell positions, a trading strategy with a combination of two TEMAs at different periods works well. A trader might also consider applying another indicator such as RSI to validate the crossover actions of TEMA indicators. I would like to thank crypto professor @fredquantum again for this very helpful lesson of TEMA.
Unfortunately @imanthadd , your article contains Spun/plagiarized content.
The Steemit Crypto Academy community does not allow these practices. On the contrary, our goal is to encourage you to publish writing based on your own experience (or as per the mission requirements). Any spam/plagiarism/spun action reduces PoB's idea of rewarding good content.
Note: Any other try will mute you in the academy.
Downvoting a post can decrease pending rewards and make it less visible. Common reasons:
Submit