Daily analysis(TA): XRP

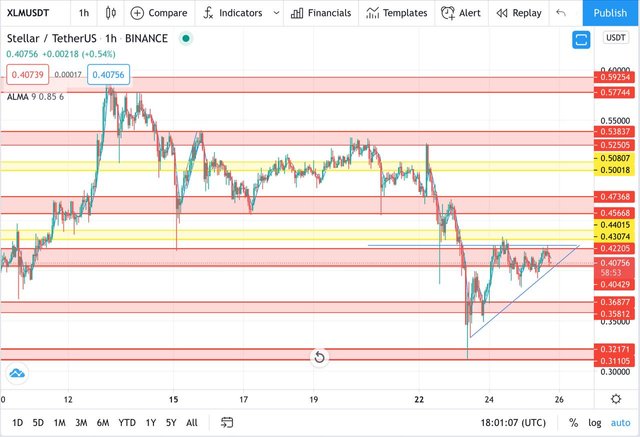
XLM Make a downside and Broke The Support areas (0.56985$-0.55180$)----(0.42205$-0.40430$) and bounce in the support area (0.36880$-0.35810$) , XLM Have to Broke the BUMP Area in Chart YELLOW Zone Above the resistance area (0.42205$-0.40430$) Before make the big Upside As Chart indicate For Accomplish the Descending Triangle.
Hourly MACD – The MACD is in the bearish zone.
Hourly RSI (Relative Strength Index) – The RSI for XLM/USD is below 50level.
Please Follow Me For More Daily Tachnical Analysis and dont forget the vote if you like it, enjoy!
Write your predictions 📝 in the comment below⬇️