Hello steemians
TASK
In this week's task, you will be using a demo account on any trading broker (e.g. FXCM, Paper Trading, FTX, MetaTrader 4, or MetaTrader 5).
Demonstrate your understanding of the topic by attempting the questions below:
Open a demo account on any trading broker and select five cryptocurrency pairs
Create a market entry and exit strategy
Use the signals of the Commodity Channel Index (CCI) to buy and sell the coins you have selected
Declare your profit or loss
Explain your trade management technique
INTRODUCTION
COMMODITY CHANNEL INDEX
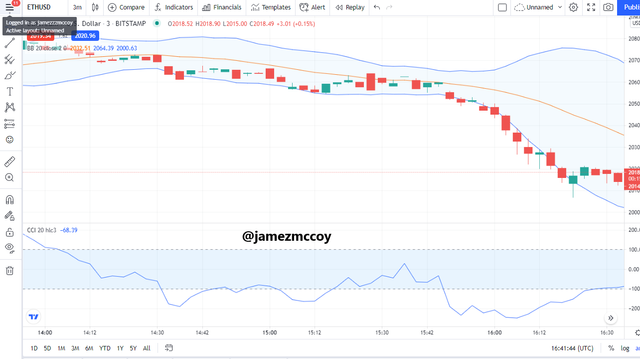
This is an oscillating indicator used by Traders and Technical analysts to measures the current price change of an asset in relation to its moving average over a specific period of time. The CCI indicator is usually plotted amongst three horizontal lines with the upper line having a value of +100 the middle line having a value of 0 while the lower line has a value of -100, Quite similar to the RSI and BB it was plotted in such a way that at least 80% of the time the price moving averages would be within the 3 CCI lines, But in some cases, the Simple Moving Average goes above the +100 and in those cases, the market is perceived as overbought on the contrary if the market is seen to go below the lower line of -100 the market is perceived as oversold. I am sure with this brief explanation we have a broad overview of what the CCI indicator is.
Open a demo account on any trading broker and select five cryptocurrency pairs
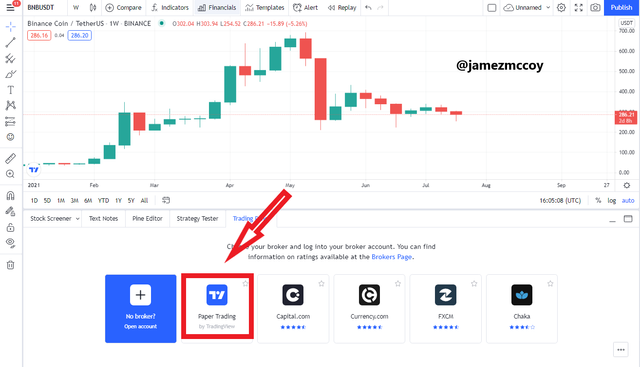
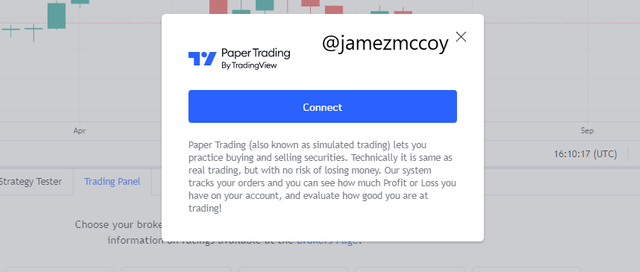
For my demo account, I will be creating a paper trading account on trading view Tradingview as illustrated in the images below
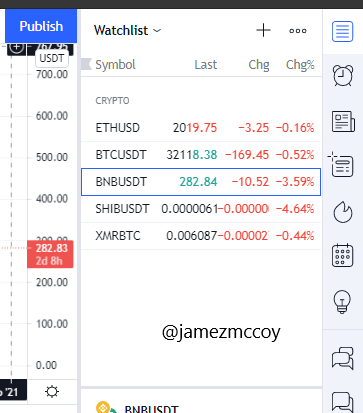
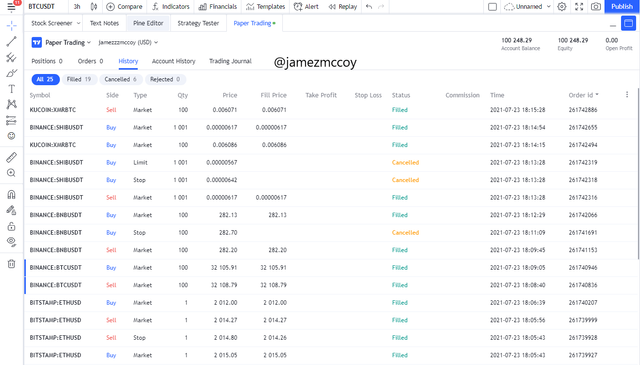
While for my Five pairs of cryptocurrencies I selected
- XMR/BTC
- ETH/USD
- BNB/USDT
- BTC/USDT
- SHIB/USDT
Create a market entry and exit strategy
My market entry and exit strategy was quite simple Use a combo of the Bolinger Band indicator as it is the indicator I am most familiar with, and the main reason for using not just the CCI indicator is because of Divergence. Our professor made us understand that the CCI doesn't always falling with the Current price so to avoid misleading signals I will be combining the two indicators along with the Candlestick chart.
My conditions for Entry and Exit
- INDICATOR
I look out for whenever the price moves outside the CCI line between +100 and -100 and consider it as a potential entry or exit opportunity if the price goes below the -100 and comes back up to extend the +100 sign and I observe carefully to ensure it aligns with my BB indicator and the moving average I consider that as a potential entry signal and enter
- LIMITS
With risk and a take profit ratio of 1:2, the stop-loss limit is very crucial in my strategy as it helps minimize loss if a signal is misinterpreted,
- DIVERGENCE
If the market is in a Bullish divergence the price falls below the -100 which indicates loss of value and weak security and in some cases no all a trend reversal is expected to happen signalling a potential entry signal and vice versa for Bullish divergence
Use the signals of the Commodity Channel Index (CCI) to buy and sell the coins you have selected
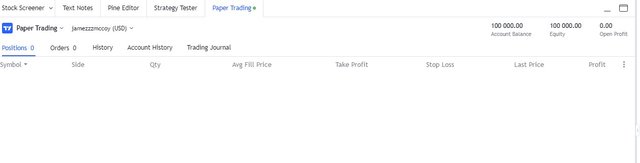
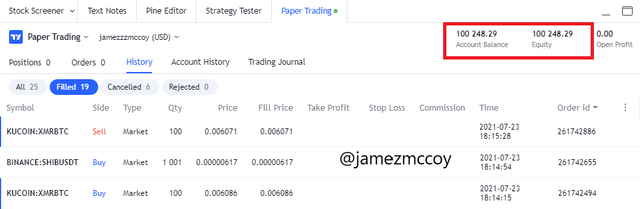
On the Trading view(Paper trading) platform, one is given up to 100,000 USD as a start-up practice fund for the Demo account overall I made a total of 100,248.29USD that is 248.29USD made as profit. Although I had to open more than one order or enter the market more than once but overall I exited and entered as much needed up to 25X Overall the profits I made were over my loss
Explain your trade management technique
- MARKET PSYCHOLOGY
They are Lots of Market psychology I had to look out for to avoid loss i.e the Emotional Bias specifically the Greed bias, as a trade profit target is essential in the sense that you will have a goal and once you achieve your goal that is it for the day and it helps keep greed in check which in turn helps minimize loss
- INDICATOR
I ensured to use more than one indicator as we know that technical analysis is just a way to help predict market trends and sometimes 1 indicator can be misleading that why it is essential to use more than one I mixed the CCI and BB indicator for maximum information absorption of signals I perceive from the chart
Conclusion
Technical indicators are not 100% accurate ways to predict market trends fundamental analysis can also play a role in helping a trader to predict trends so does understanding market psychology. Knowledge is power in the cryptocurrency market as the more information you have about a particular asset the more likely you are to succeed in the trading aspect. Thanks to Professor @asaj for this amazing post about the CCI indicator
Hi @jamezmccoy, thanks for performing the above task in the fourth week of Steemit Crypto Academy Season 3. The time and effort put into this work is appreciated. Hence, you have scored 4 out of 10. Here are the details:
Remarks:
Apart from the first task, you did not do very well in the other tasks. It appears you don't fully understand the topic. As a suggestion, you could watch some tutorial videos on YouTube to learn more about the CCI oscillator.
Downvoting a post can decrease pending rewards and make it less visible. Common reasons:
Submit