.png)
.png)
Introduction:
Bollinger bands is an indicator named after its creator, John A. Bollinger an American writer, who is an educator in the field of technical analysis and was the creator of his own trading system, based on the LeDoux strategy and the Envelopes indicator.
Bollinger bands became known worldwide in 1987, the indicator was mentioned in the book "The New Commodity Trading Systems and Methods" by Perry Kaufman; and later in 2001 with the book "Bollinger on Bollinger Bands" published by McGraw Hill, translated into 11 languages.
Among the objectives of this work is expected to analyze the most outstanding aspects of Bollinger bands, their usefulness for the technical analysis of the market, oriented to the cryptocurrency market, where practical examples made by the author of this publication are shown.

Bollinger Bands consists of three moving averages, as detailed below:
1.-The upper band: shows a statistically high level and the most commonly used simple moving average is 20 days and 2 standard deviations are added.
2.-The average band: it is related to market volatility and the simple 20-day moving average.
3.-The lower band: shows a statistically low level and the commonly used simple moving average is 20 days and 2 standard deviations are subtracted.
For the manual calculation of bollinger bands, their creator used the formula of mean square deviation or standard deviation identified as sigma "σ", based on the closing price data for a given period:
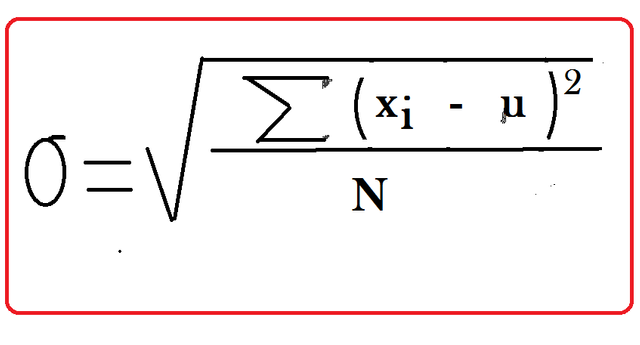
σ (sigma) is the standard deviation
x is the closing price
i is the serial number of the bar
μ is the moving average
N is the total number of points (period).
The result allows us to interpret the range of deviation of the closing price that is directly proportional to the volatility of the market, allowing us to analyze it.
That is, we will obtain a graph where the Bollinger bands widen when the market is more volatile and narrow when it shows signs of greater stability, which can be summarized as follows:
• When the market is more volatile, the Bollinger bands narrow.
• Conversely, when the market is less volatile or more stable, Bollinger Bands tend to narrow.
Likewise, Bollinger bands can show us signs of changes in the market, this can be after a period of marked volatility, give indications of the beginning of a period of stability, always considering that these signals are directly related to the persistent uncertainty in volatile markets and that they are influenced by changing external factors, which must be considered by traders.
In relation to the best configuration of the BB, by default is established for the Moving Average 20 periods, considering this range as the approximate number of days of monthly negotiations, this configuration as indicated by the Proffesor @kouba01 in the publication of its class, has been defended by its own creator, considering it the most suitable.
However, these moving averages can also be adjusted to 10 or 50 periods, it should be noted that according to the period established to achieve a coverage of the analysis between 88-89% a standard deviation coefficient is used, as shown below:
20 periods is added 2 standard deviations for the upper band and subtracted for the lower band.
10 period is added 1.5 standard deviations for the upper band and subtracted for the lower band.
50 periods is added 2.5 standard deviations for the upper band and subtracted for the lower band.
Below in Figure 1, the configuration of the Bollinger Bands Indicator on the chart made with on the https://coinmarketcap.com/ page is shown.
And in Figure 2, the setting option shows the default setting for the MM 20 periods and with the coefficient of 2 standard deviations.
Figure 1: Configuration Indicator Bollinger Bands (BB)

Figure 2: Configuration of the graph with the BB, with MM 20 periods and 2 standard deviations.

On the other hand, the configuration of the moving average for bolligner bands can be adjusted according to the requirements, however some experts claim that if it is necessary to use periods less than 10 and / or greater than 50, you can change the chart settings to 4 hours or daily.
But there are other alternatives such as the combined options for the chart, where you can use two indicators of bands but with different coefficient or also with two different periods and different coefficients, that is, an indicator with 20 periods and 2 standard deviations and another with 50 periods and 2.5 standard deviations.

One of the most outstanding features of the Bollinger Bands, is its sensitivity to detect changes in the market, the signals of a trend of low volatility and volume are identified when the bands narrow or contract, this pattern is known by the name of Squeeze.
On the other hand, the breakout can be identified when the bands expand after a squeeze, because the price suddenly exceeds the bands and can translate as a large movement in the market or the intensification of the volatility of the same
Figure 3: Identification of Apreton and Ruptura patterns


Bollinger Bands when they contract or the squeeze occurs, allow us to identify a signal of a possible change in the price, but to obtain the best utility of this indicator and determine with less margin of error the time to enter or exit, the first thing to do is to identify what the market trend is.
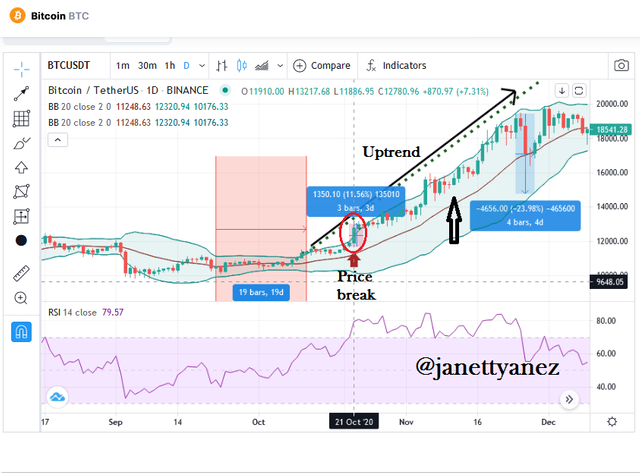
When we are facing an uptrend, one of the most obvious signals of the Bollinger bands is that the price remains above the middle band and close to the upper band, the entry signal occurs when the break in the price and a retracement contrary to the trend is evident.
In a downtrend, the behavior is contrary to the previous one and the price remains below the middle band and approaches the lower band, our signal occurs when a sharp retracement of the price is evident in the opposite direction to the downtrend, at that time our exit position is marked.
Below in Figure 4, the signals of the BB are shown, corresponding to the BTC/USDT pair, where the break price is shown in an uptrend and our entry signal is indicated in a circle.
Figure 4: The signals of the BB are shown in an uptrend.

Based on what was stated by the creator of the Bollinger Bands, this indicator should not be used independently and even suggests its use complemented by another indicator, based on the price action as the basis of the technical analysis that must be carried out and always bearing in mind that all indicators are based on the analysis of historical data, so we must bear in mind that none will provide us with 100% certainty.
In particular, the use of Bollinger Bands with the RSI Indicator (Relative Strength Index), can provide excellent signals that are very useful to achieve success in the operation being performed.
The usefulness of the combination of both indicators can be visualized, when once the predominant trend has been identified, as well as the support and resistance (BB) levels, we detect the following signals: RSI: oversold (<30) or overbought (>70) levels are identified.
BB: the price break below the upper or lower band, and when the candlesticks show a closing price below the lower band (Downtrend) or above the upper band (Uptrend).
Figure 5 then shows the signals with the RSI Indicator in combination with the BB.
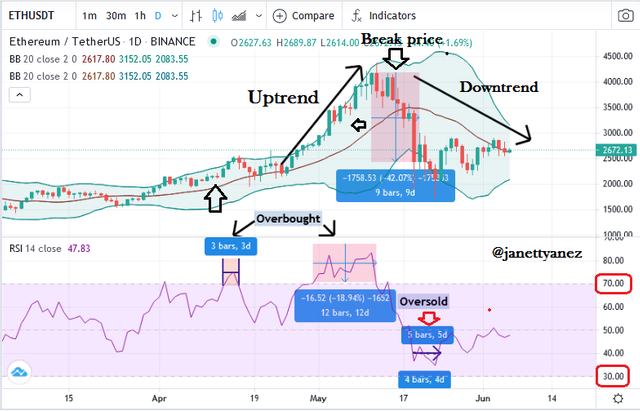
Figure 5

For those who use longer time frames can get excellent benefits such as those noted in the previous sections with the parameters set in the default settings, with a number of moving average periods of 20 the number of periods in which the moving average is calculated is 20, because according to statistics published by analysts show that 95% of the price should remain within that band , an excellent percentage to achieve success in operations.
Figure 6
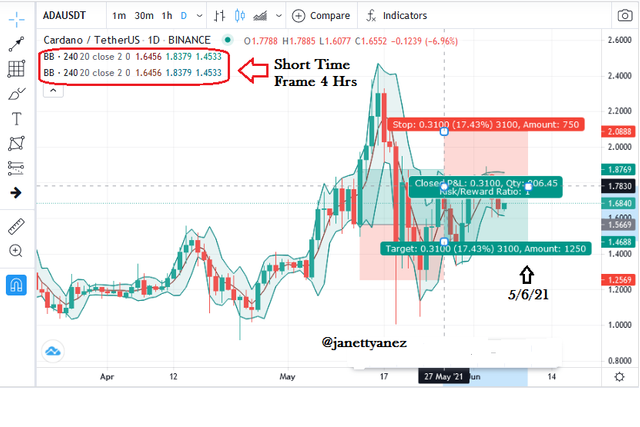

1.- From 27/02/21 to 14/04/21 a clear pattern of Apreton is shown, indicated in Figure 7, on 14/04 a break price is identified that continues with a breakout, with an upward trend that is clearly identified with prices above the middle band and close to the upper band of the BB indicator, which ratifies the exit point for sale.
2.-The 19/05/21: it shows a signal of price break with a downward trend, with prices below the middle band and close to the lower band, as well as with the RSI Indicator shows us the points of Overbought; marking the entry point for the purchase of the cryptocurrency, even to date the downtrend remains.
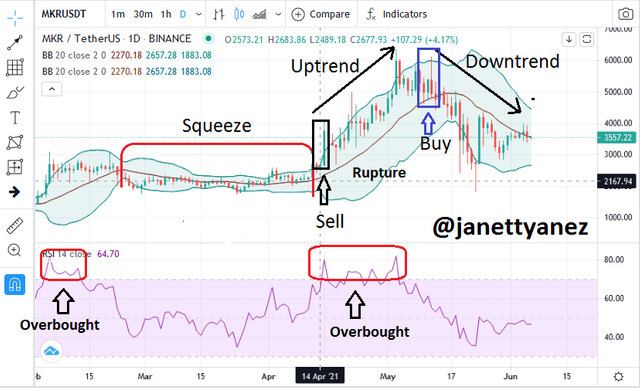
Figure 7: MXR/USDT graph where BB signals are displayed.

It is advisable to use the BB in conjunction with another indicator to complement the signals that it presents to us and maximize its benefits, in order to provide us with the opportunity to achieve successful trades with little loss margin.
.png)
Grateful to Professor @kouba01 for another master class where we have once again been allowed to obtain very important knowledge in this matter.
.png)
Sources consulted:
1.-Binance Academy: Bandas de Bollinger Explicadas
2.-LiteForex: Qué es bandas de Bollinger Forex
3.- Ifcmarkets: Bandas de Bollinger - Bollinger Bands Indicator

Unfortunately @janettyanez, this week's submission time has expired.
Downvoting a post can decrease pending rewards and make it less visible. Common reasons:
Submit
Thank you Professor @kouba01, sorry
Downvoting a post can decrease pending rewards and make it less visible. Common reasons:
Submit
Twitter:
https://twitter.com/JANETTYANEZ/status/1401386167308898307
Downvoting a post can decrease pending rewards and make it less visible. Common reasons:
Submit
Con el apoyo de la familia.
Trail de TopFiveFamily
Downvoting a post can decrease pending rewards and make it less visible. Common reasons:
Submit
Hiciste un gran trabajo en un tema tan complejo y dificil... Lo hiciste parecer facil.
Exitos siempre!!
#affable #venezuela
Downvoting a post can decrease pending rewards and make it less visible. Common reasons:
Submit