
Greetings to you my noble professor @nane15 and to you my beloved Steemians for stopping by here. Indeed is a great day today to share with you my homework post after reading through the professor lesson which I found it so interesting.
Explain your understanding of charts, candlesticks, and time frames. (Use your own words and put screenshots)
As a trader chart, candlestick and timeframe are the three basic things that are when you open your TradingView or Metatrade4 or any other trading platforms. In this post, I will be discussing the three of them one after the other.
Chart is what we see each time we open our trading platforms.which represent the movement of an asset for a given timeframe. This means that Chart is a graphical representation of prices that is drawn over a given timeframe. What is what enables trader to understand the current trend of the market. Chat has both horizontal axis and vertical axis, the horizontal axis (x) is what represent the timeframe/scale, whereas the vertical axis (y) represent price scale. On a chart,price are illustrated across the horizontal axis (x) starting from left to right with the most current price movement.
Chart is what forms most of the basis of the technical analysis that is used by traders to predict and analyse the future of price movement. However, there are several types of chart that traders make used of to make decisions in the market. Some of these types of charts are candlestick chart, bar chart, line chart Heikin Ashi chart and many others.
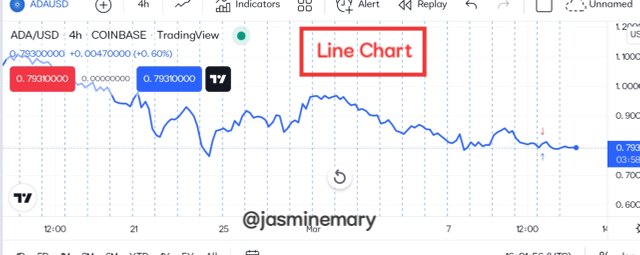
Line chart is the type of chart that provides traders with clearer information as to where price has moved to over a certain period of time. It's the types of chart that only show the information of closing price rather than opening price. To me line chart is of more preferable than candlstick charts because it provide a clear visualisation of historical price using a single line that can easily be spotted. The screenshot below is an example of a line chart.
Candlestick chart is another form of chart that graphically represents the movements of price of an asset for a given timeframe. As the name implies, candlstick it's it created with candlsticks, and each of the candlstick represent equal amount of time. The candlestick timeframe can represent a second or even years.
The history of candlestick was traced back to about 17th century, which tells that is not something that came into existence yesterday. It was created by a Japanese rice trader known as Homma. Candlestick chart is best used by traders to identify the levels of stop loss and take profit which is best used to place a trade.
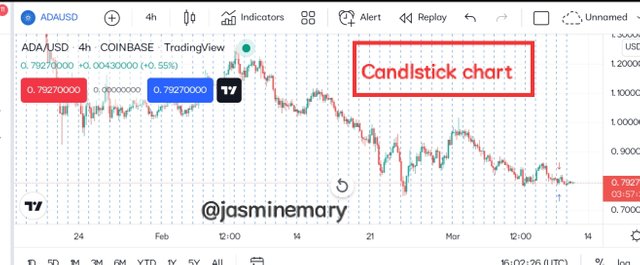
Candlstick is comprised of a body and two wicks. The body is the one that is drawn rectangle, that marks the open and the close of a period. In a bullish candlestick, the open is Indicated by the bottom of the rectangle whereas the close is Indicated by the top rectangle. In the bearish candlestck is just an opposite of the bullish candlstick, where you will see the period of the closing price falling down below that of the opening price of the period. Although, the bullish candles represent the green candlestcks, while the bearish candle represent the red candlsticks. Below is a screenshot of a candlestcks.
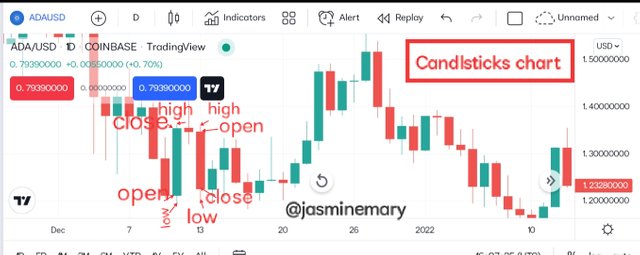
Looking at the screenshot above, we can see that candlstick graphically shows/displays how market is acting to demand and supply. When you see a long wick that is either side of the candlestick you should know it's and Indication of price rejection in the market.
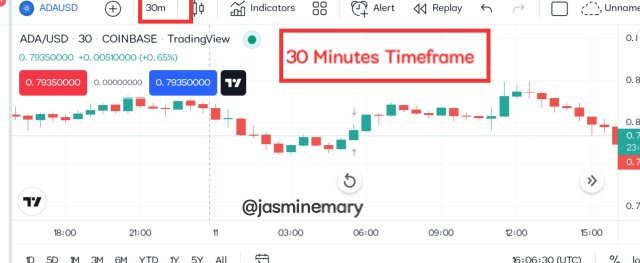
Timeframe is the number of time that a trade happened.(i.e the defined numbers of time that a trading activity occur in the market). Understanding of timeframe is one of the vital things that a trader can gain from trading in the market. Timeframe are categorizes into different types ranging from second, minute, hourly,daily, monthly and yearly. Sometime changing of timeframe do change the displayed of our chart. Let's look at the charts below
 30 Minutes Timeframe
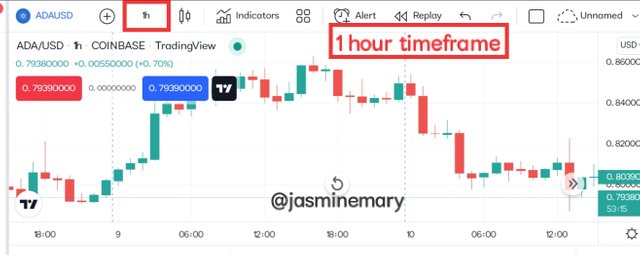 1 Hour Timeframe
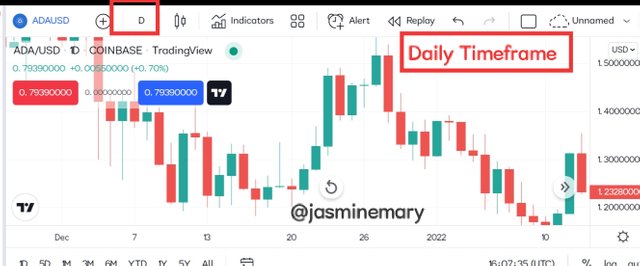 Daily Timeframe
Looking a the above charts we can see that is a chart of the same cryptocurrencies pair with different timeframe. The timeframe make the crypto pairs to look different. This is the reason why I said that understanding of timeframe is the vital things that traders can gained from trading.
Explains how to identify support and resistance levels. (Give examples with at least 2 different graphs)
One of the best way that we can identify our target price on a chart is to identify our support and resistance levels. Support and Resistance levels are specific price levels on a chart that is expected to attract the maximum amount of selling or buying of a traded asset. The support level is the level at which we can expect more buying of asset than selling (i.e more buyers than sellers in the market), while the resistance level is the level at which we can expect more selling than buying (i.e sellers than buyers in the market)
Basically, traders make used of support and resistance on a chart to identify their entry points in the market. Below is a screenshot of support and resistance levels.
Support level on a chart
As the name implies support, we know that anything that is called support is something that give a little assistance. Support level on a chart is a price level on the chart where maximum demand of an asset is expected by traders. The is anytime price falls to the support level, it's most likely to bounce backward and it's the level that is below market price (i.e current market price of the traded asset). Traders make used of the advantage of support level to open a buy order trade.
Below is a chart of BTC/USD showing support level.
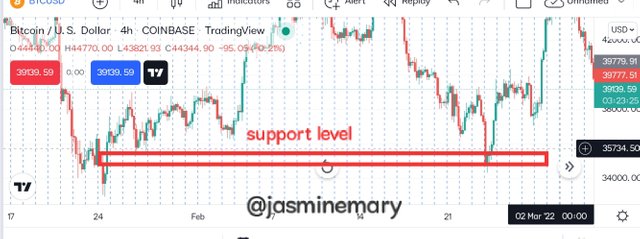
From the chart above, we can see that the support level is Indicated with a red line and is equally below the level of the price of the asset. The support level is at $35734.50 And the market price of the traded asset is at $39139.59 To Identify your support level, you're to know that support level is always below the market price.
Resistance level
Resistance level is the level at which the price of the traded asset pause from further rising up. Resistance level on the other hand is just opposite of support level, it's the level on a chart at which maximum supply is expected by traders. Resistance level is usually indicated above the market price of the traded asset.Trader make use of the advantage of resistance level to open a sell order.
Below is a chart of BTC/USDT showing resistance level.
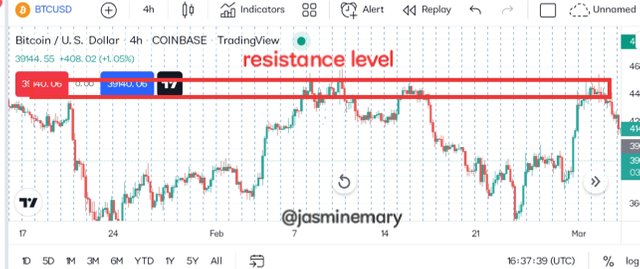
From the chart above,we can see that the resistance level is the level that is Indicated with red line and is above the current market price of BTC/USD. The resistance level is at $44000.00, and the market price is at $39779.91. In order to identify your resistance level you're to know that it's the level above the market price.
Identifies and flags Fibonacci retracements, round numbers, high volume, and accumulation and distribution zones. (Each one in a different graph.)
Fibonacci retracement are line that are automatically drawn horizontally to show the possible support level and resistance level of the point that price could change direction (i.e price reverse from it direction). However, Fibonacci work perfectly okay when market is experiencing a bullish trend. In a nutshell, Fibonacci retracement is a technical Indicator tool that help traders to know future direction of price movement.
Fibonacci retracement has different levels that price can reverse after a retracement occurs. The uptrend movement, of the Fibonacci technical analysis tool is drawn starting from the prior low point to a current high point
Below is a chart showing and uptrend movement.
Uptrend
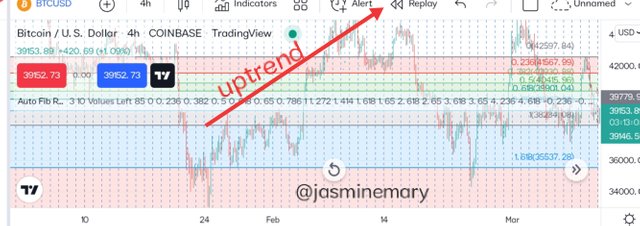
Now looking at the chart above we can see that the Fibonacci retracement levels comprises of 0.(42597.84), 0.236(41567.99), 0.382(40930.88), 0.5(40415.96) and 0.618(39901.04).
Downtrend
For a downtrend movement Fibonacci retracement can be drawn from starting from the prior high point to a current low pint. The chart below is an example of a downtrend Fibonacci retracement.
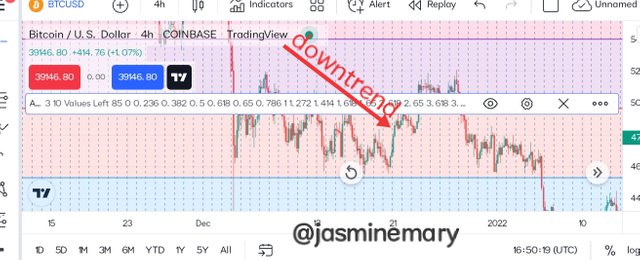
Looking at the chart above, we can see that the Fibonacci retracement levels comprises of 0.53(41733.09), 0.62(43526) etc.
Round Numbers
Round number are numbers that are shown on a chart ending with zero (0). The round number are the levels that most traders lay their emphasis on, most precisely, the strong hand traders usually place their order close to the round numbers. In crypto trading, traders see round numbers as number that ends with one zero ,double (2) zero (1.3100), or even triple zero (0). Let's take a look from the example for the chart below.
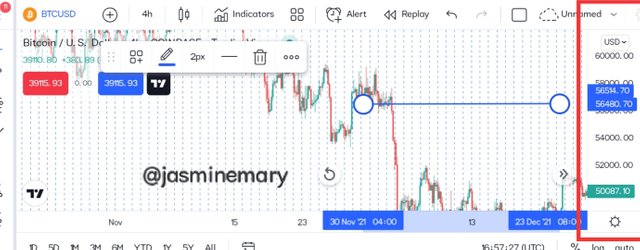
Looking at the above chart we can see that price was reacted at the level of the round numbers which are $60000.00, 56514.70, 3977.91 etc . Phycologically, these are the numbers the traders always look at for as it indicates how important the levels of prices are to a traders.
high volume, and accumulation and distribution zones.
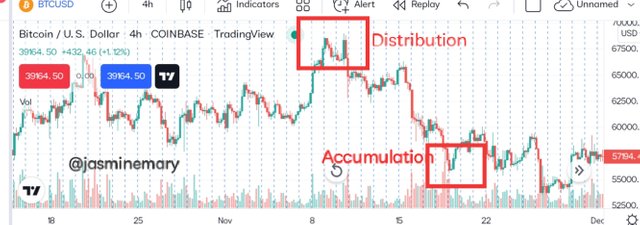
High volume and accumulation and distribution zones are the components that traders used to determine the supply and demand of an asset, knowing the trend of the asset,by comparing the relationship between how the volume is flowing and how the price of the asset is rising over time. The word "Accumulation" is what is used to identify demand (buying) of an asset, whereas "Distribution" is what is used to identify the supply (selling) of an asset in the market.
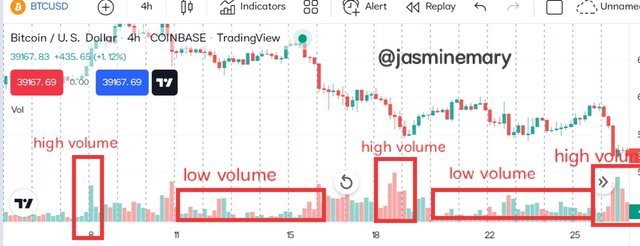
At the time of Accumulation strong Investors tend to buy more of the asset which is the reason why the buying pressure will become more than the selling pressure, making the demand of the asset to rise, causing and upward movement. During Distribution strong Investors tend to start selling off their asset which is the reason why the selling pressure will become more than the buying pressure causing the asset to start falling down. The chart below is and example of high volume and accumulation and distribution zones.
It explains how to correctly identify a bounce and a breakout. (Screenshots required.)
Breakout is what happens on our chart whenever the price of our traded asset crosses above and then closes at the support level or resistance level, that seem like the trend is to continue or a trend reversal is to begin. Basically, simply means that when price move and crosses below or above on either the support or resistance level, is and Indication that they will be a price continuation. For instance, when a breakout occur at the upside of our chart is a sign that the price of the traded asset will begin to start trending higher, but when it occurs below at the downside is a sign that the price of the traded asset will begin to start trending lower. Although, trader make used of the opportunities that breakout provide to place a trade.
Traders make used of the breakout that occured at the upside to opened a buy order trade, whereas their make used of the breakout that occurred at the downside to opened a sell order trade. Below is a chart showing a breakout.
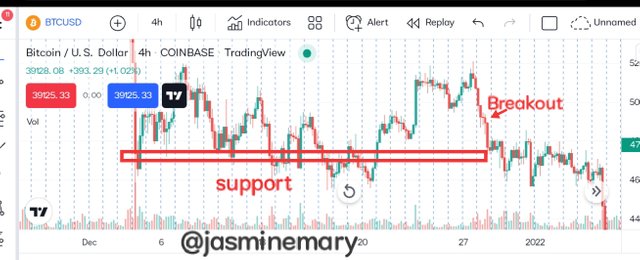
Looking at the above chart of BTC/USD, we can see that there was a breakout that occurred at the level of support. The price of the asset retested the level of support many times before sellers enter the market and broke support level which then cause a downtrend movement just as I have said earlier.
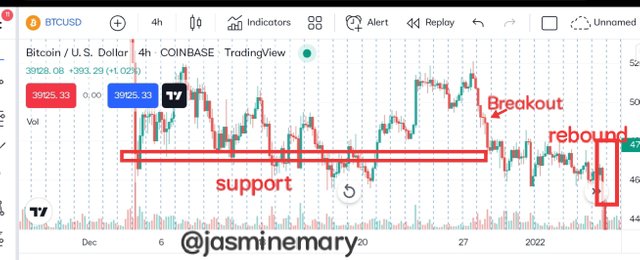
After a confirmation of the breakout that occured at the level of support, we can see that the price then change it position and change to the resistance level which known as Rebound in trading. Rebound is when price is reverse back to its direction. Below is a screenshot of a chart that show how a bounce back.
Explain that it is a false breakout. (Screenshots required.)
False Breakout occur when price of the traded asset that is below or above the level of support and resistance has failed to move due to fake breakout that occur. False Breakout always fake the movement of price and once you're not careful you fill a false Breakout and place a trade your entire asset might be liquidated. False Breakout usually occured both at both bullish movement and bearish movement. As for the bullish Breakout is happens when the price of the traded asset has crosses above the level of resistance but stop (fails) to continue it movement. At this point price will close below the resistance level which is and Indication that sellers in getting into the market. Below is an example of a false breakout.
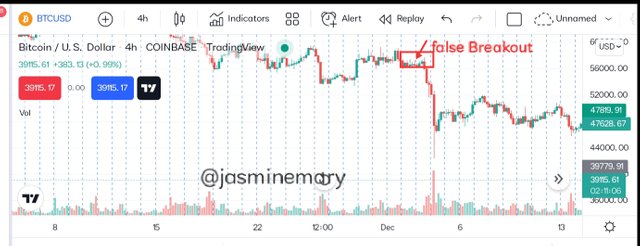
From the chart above, we can see that there was a breakout in the chart, which occured at the resistance level.
Explain your understanding of trend trading following the laws of supply and demand. It also explains how to place entry and exit orders following the laws of supply and demand. (Use at least one of the methods explained.)(Screenshots required.)
Trend trading following the laws of supply and demand, is the theory that determine relationship between the desire to purchase an asset and the availability of the price of the asset. Basically, when availability is low and demand is higher the price of an asset will increase but in a case where the availability is high and the demand for the asset is low the price of the asset will reduce/fall.
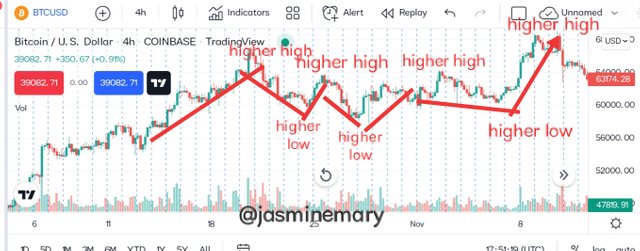
In the law of demand and supply it's stated that if price is higher, demand will be lower.vice versa. For and uptrend movement, when the price of the traded asset keep on moving it's a sign that the demand for the asset is getting higher than the supply. But when the price of the asset is decreasing in the market is a sign that the asset is falling meaning that the demand for the asset is higher than the supply. The demand and supply an asset is follows in line with the volume on the chart. The green volume is what indicate the increase in demand of the asset showing how the asset is increasing, while the red volume shows how the asset is decreasing which we can see from the screenshot below.
Uptrend
Downtrend
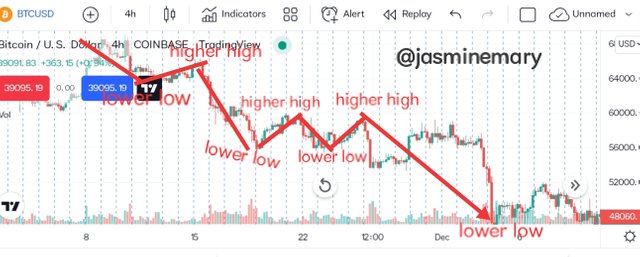
Looking at the both chart above, we can see how the volume is moving with the demand and supply in the market. As the demand keep increasing that is how the green volume keep on increasing which is shown on the first chart. On the downtrend we can see that the supply of the asset is higher than the demand which is the reason why the red candlsticks keep on increasing.
Entry After A Pullback
In order to enter a trade after a pullback we need to follow the laws of demand and supply which implies that if we are to buy and asset the market should be trending higher but if we want to sell the market should be trending down which works in hand with the volume. For instance, high volume is when the market is trending higher which is Indicated by the green candles. As for low volume which we all know that is a bearish trend is Indicated with the red candles which is a sign that selling pressure is more than buying. Below is a screenshot of what am discussing about.
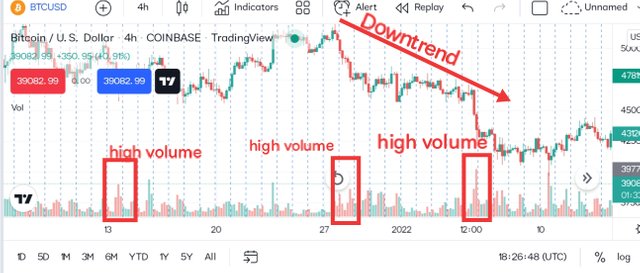
Looking at the chart above, we can see that supply is higher than demand which the market is experiencing a bearish trend. Going by the pullback method by applying the laws of demand and supply, the price of the traded asset closed below the prior low which caused the price of the traded asset to fall down and began a downtrend movement. Looking at the volume Indicator, we can see that as the market is experiencing a Downtrend move aka bearish trend that is how the red candles is rising.
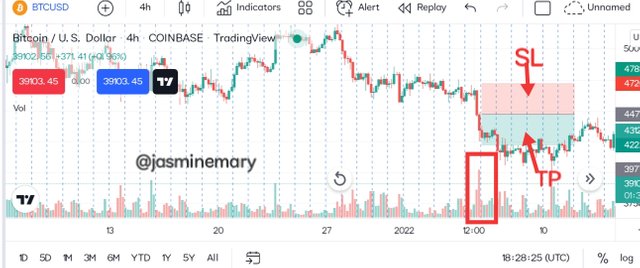
At this point traded can execute his/her sell order as soon as the breakout candles closes below that of the prior low, and set his/her stop loss above the current high, with a take profit at the prior low. This is exactly what I did and I set my risk rewards ratio at 1:2.
Open a real trade where you use at least one of the methods explained in the class. (Screenshots of the verified account are required.)
At this point, I will be using TradingView to carry out my analysis before going to Binance Exchange and execute the real trade.
XRP/BTC
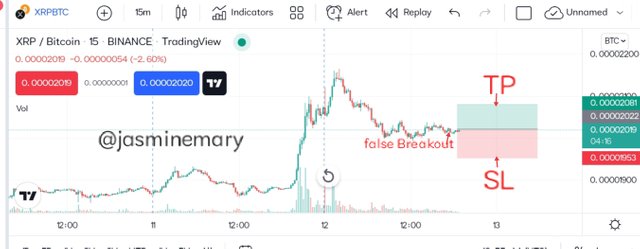
Looking at the chart of BTC/BUS pair, we can see a false breakout that occurred at the support level which in indicated above. Looking at the movement of the trend I noticed that it was moving in a bullish trend. Going by the pullback strategy of the laws of demand and supply, I noticed that the price of the traded asset closed up that is the prior high which is a sign to me that the market will continue moving in and uptrend. Looking at the volume Indicator is equally see that green candles which is the candles that indicate a bullish trend moving higher meaning buyers are in control.
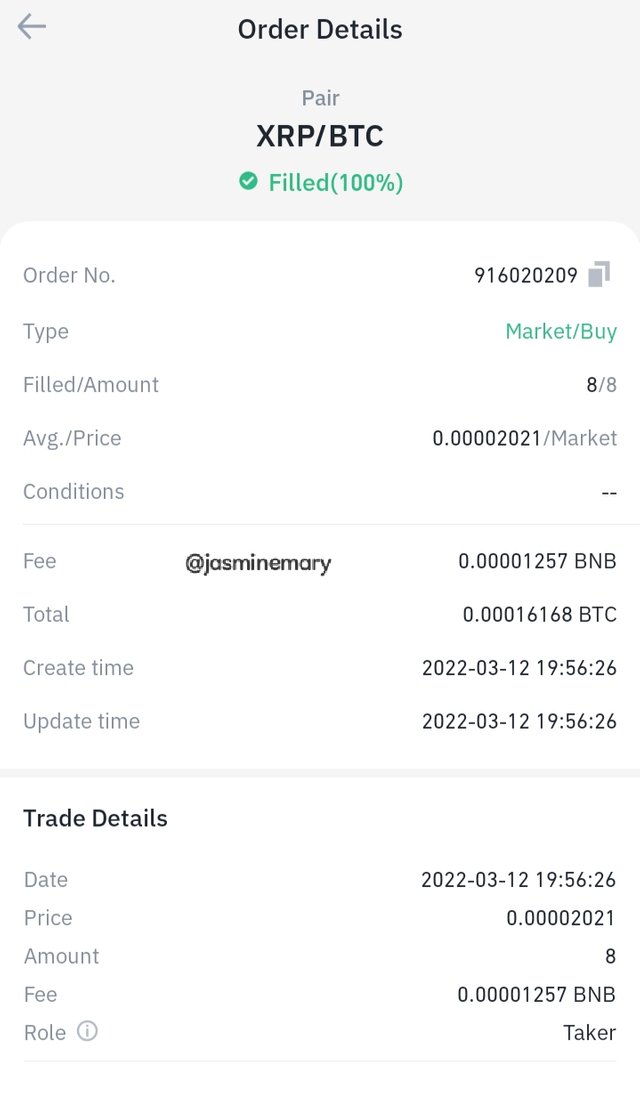
After waiting for the bullish confirmation so that I can be sure if it's not a false signal that was when I then placed my order and immediately went to my Binance exchange and execute the order.
 |  |
|---|
Conclusion:
In this homework post we have learn and understand what charts, candlsticks and timeframe are all about. The three of the these affomentioned words are all what we do see often each time we open trading platforms like TradingView, Metatrade etc. Chart is simply a series of prices that drawn over a given period of time which is displayed visually. All thanks to professor @nane15 for his wonderful lesson which has help me a lot before I was able to put this homework down.
