INTRODUCTION
Greetings to you, today I welcome to my homework task that was given by professor @kouba01 on the topic: "Trading Crypto with Average Directional Index (ADX) Indicator". Feel happy as you read through.
1. What is the ADX indicator?
ADX Indicator is a short abbreviation that stands for "Average Directional Index", which is used by traders to measure the whole strength of a trend on a chart.ADX is developed by Welles Wilder,to measure if the strength of price is moving towards positive or negative direction using the DMI+ and DMI indicator together with the ADX indicator.
The indicator is range from 0 to 100 when plotted as a single line of values. The developer of the ADX indicator thought that a strength trend is presented when ADX is higher above 25 and no any other trend can be presented when it's below 20. This implies that when ADX fall below 25 for more than 30 bars, price will rise up and fall down between support and resistance level looking for buying and selling. Price will break into a trend if the condition of ADX is low. Below,is a screenshot of BTC/USDT 15M chart moving from a up ADX price to a weak trend.
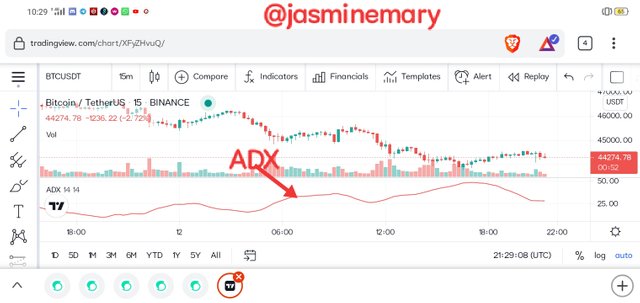
For a better understanding, of the above chart, let's look at the ADX value below.
| Value of ADX | Indication |
|---|---|
| 0-25 | Weak Trend |
| 25-50 | The Strength is Strong |
| 50-75 | The Trend is Very Strong |
| 75-100 | The Trend is Extremely Strong |
We can know clearly understand the above chart, as the ADX is at the range of 0-25.
How it is calculated
ADX indicator has more than one components of Directional Movement Indicator (DMI) that means the components of ADX will be calculated.
First, Is to calculate. +DM, -DM, with the true range for all 14 periods is commly used.
Apply +DM when Current Day Hugh - Previous Day High > Previous Day Low - Current Day Low. If it's previous day low, apply -DM when Previous Day Low - Current Day Low > Current Day High - Previous Day High.
TR is Higher of the Current High - Current Low or Current Low - Previous Close.
When calculating the 14 period average, calculate it in smoothed like this +DM, -DM and TR Using the TR method below:
Method 1: 14TR = Sum of method 1, 14 TR.
Method 2: 14TR value = Method 2 14TR -(Prior 14TR / 14) + Current TR
Divide the smoothed +DM value by the TR value in other to get +Dl and multiply by 100.
For best understanding on how ADX is calculated take a look at the image below.
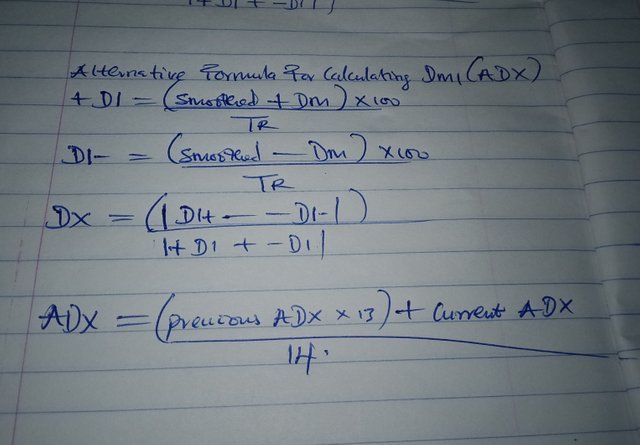
Now, having knowing the method used in calculating the ADX,below is the calculation of ADX using the value of:
Period = 14
Current Day High = 55.69
Current Day Low = 54.95
Previous Day High = 54.62
Previous Day Low = 54.21
Previous Day Close = 54.21
DMI+ = (Current Day High - Previous Day High) = (55.69 - 54.62)) = 1.07
DMI- = (Previous Day Low - Current Day Low) = (54.21 - 54.95) = - 0.74
DMI+ = 1.07
DMI- = 0.00
Looking at the above calculation, DMI- is negative, which means zero (0).
The TR Average will then be: TR = MAX(|CH-CL|; |CH-PC|; |CL-PC|) = (|55.69-54.95)= 1.07, (|55.69-54.21)= 1.39, (|54.95-54.21)= 0.74 (1.07; 1.39; 0.74).
1.39 is valid range and also the maximum value.
DI+ = DMI+/TR = 1.07/1.39= 0.76978417
0.77 (to 2 s.f).
and
DI- = DMI-/TR = -0.74/1.39 = -0.5323741
-0.54 (to 2 s.f)
Lastly, ADX = Sum of n [((DI +) - (DI-)) / ((DI +) + (DI-))] / n
ADX = 14[((0.77) - (-0.54)) / ((0.77) + (-0.54))]14.
Applying the figures above,
ADX = 14[(1.31 - 0.23)]/14 = 1.08
This mean that the Trend is between the range of 0-25.
2. How to add ADX, DI+ and DI- indicators to the chart, what are its best settings? And why? (Screenshot required)
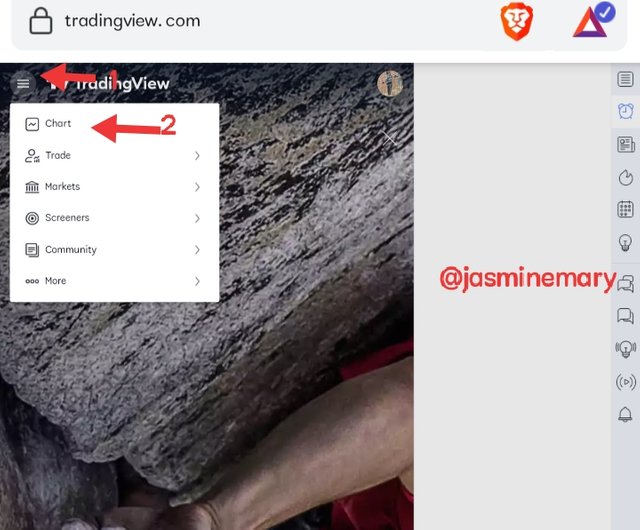
- To be able to add ADX, DI+ and DI- indicators to the chart all you need to do, is to visit https://www.tradingview.com and click on chart at the homepage as shown below.
- Click on the fx indicator
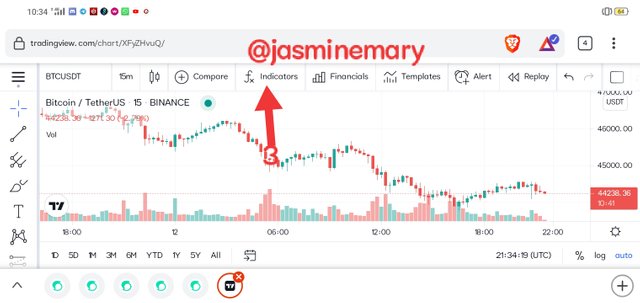
- After you have click on fx indicator, a search box will display on your screen at the top type in Average Directional Index or ADX or DMI in the search box, and select "Average Directional Index with DI + and DI-" as shown below.
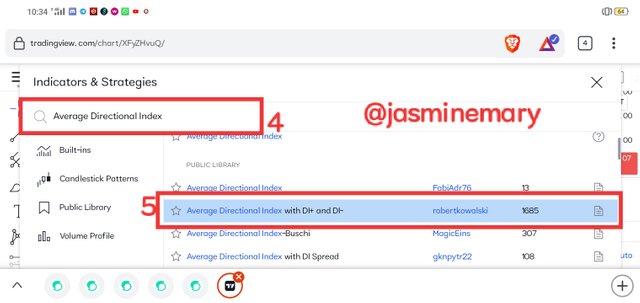
- Once you have select the "Average Directional Index with DI + and DI-" it will be added to your chart as shown below.
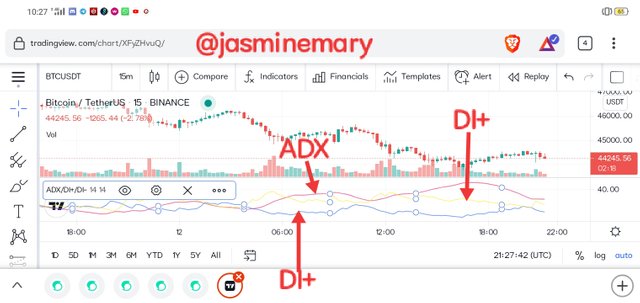
What are its best settings? And why?
The best settings for AADX, DI+ and DI- are length that is found under the inputs and colours under style.
Length
Length is the distance that measured the period of the indicator,which is always set at 14. Although it can be changed at anytime to 15 or 12 base on individual prospective. But,when it is a lower periods the indicator can responds fast to price movements which can lead to false signals. Higher periods like 8 to 30 period are good for great output, but 14 is the best settings for AADX, DI+ and DI- indicator and that is why it is set at default period. Below are screenshot of some of the period.
How to Set it:
- To set/configure the indicator, click on the corresponding setting icon as shown below.
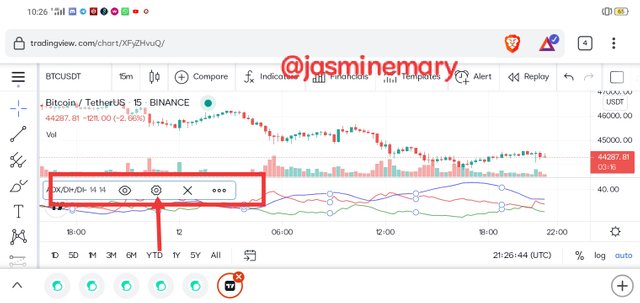
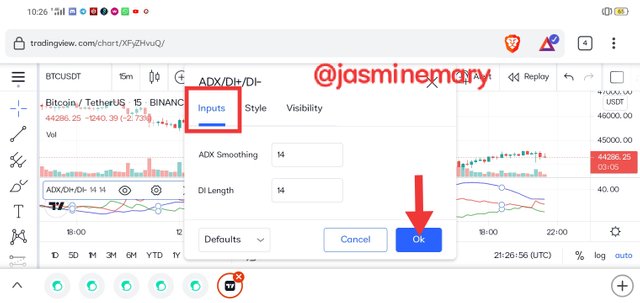
- Select "Inputs", at the input section you will see ADX smoothing : 14 and DI Length : 14 don't change it since it's the best settings click on OK
- The style settings is to help you change the colour of the lines,(in my own case the ADX line is Red, DI+ is in blue colour and DI- in yello colour after settings the style, click on Ok.
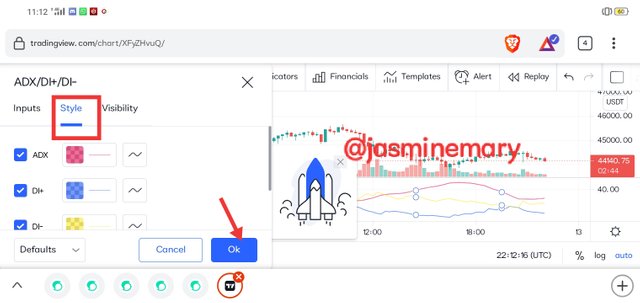
3. Do we need to Add DI+ and DI- to the ADX indicator before we can use it for trading?
ADX indicator is what helps traders to quantify trend strength. This trends is very essential when trading, because the values are important for differentiating between trending conditions and non trending conditions. When trading you will be desire to use ADX 25 and above to recommend that the trend is strong for trading. But, when ADX is 25, below you will not recommend recommend trend trading because it is very weak. This mean that we don't only need ADX before we can start trading. In TradingView, choosing ADX line, will only show you the chart with the Average Directional Index (ADX) lines, but if you add DI+ and DI indicator, the chart will show you both lines including the ADX line.
Now as a trader who is thinking of adding DI+ and DI- to the ADX indicator in trading,you have to know that you're are looking at three critical indicators when trading. The first thing you have to look at is to know when the DI+ and DI- lines cross over another line, which means that there is a progress in trend reversal. That shouldn't just be the only thing you need to look at for but also the the negatives impact of it to know when the DI+ and DI- lines have crossed over in different times or getting close to each other, because you will no longer know if the market is at bullish or bearish.
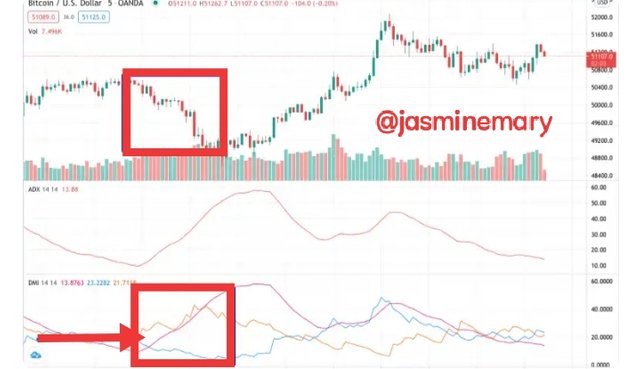
Above is a chart that involves the three indicator. The blue line is the DI+, the orange line is the DI- and also ADX is the red line. The red boxes is where a clear bearish trend is displayed, that we have been seeing candlestick chart. Now if look at the DI+ and DI very well at the bottom of the chart, the bearish is seen because the orange line that is the DI has move quickly from the blue DI+ line. This means that adding DI+ and DI- to the ADX indicator can help us to either make a trade on the crossover signal which is indicated with arrow would be the point that we can quickly enter the trade.
I a nutshell, I can say that adding DI+ and DI- to the ADX indicator is base on individual choice and not something that a traders must do before trading because there are risks when we add DI+ and DI- to the ADX indicator. One of the risk to this is that DI+ and DI- are falling indicators that based on previous market movements which can not give you accurate price movements.
What are the different trends detected using the ADX?
The different trends detected using the ADX is No trend or weak trend, Strong trend,very strong and extremely strong trend. These trends are use in plotting ADX indicator from the range of 0-25. Let's get to know what there mean below.
No trend or Weak trend:
When the ADX line is plotted between the range of 0-25 it is known as no or weak strength. This trend line simply tell you that the market is not progressing at the moment you have to wait for it to rise above 25. It advisable for traders to know that a strong trend is from 25 and above so anything below 25 is weak trend. Below is a screenshot of weak trend.
Strong trend:
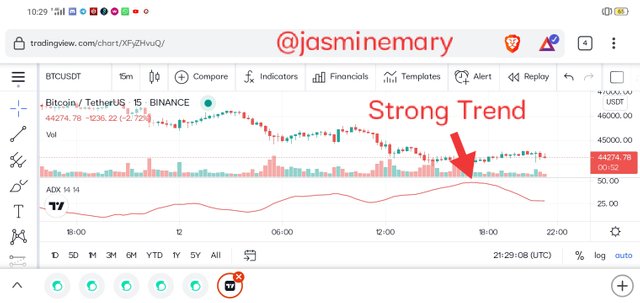
When an ADX value is above 25-50 indicator that means the trend is strong.
Very strong trend:
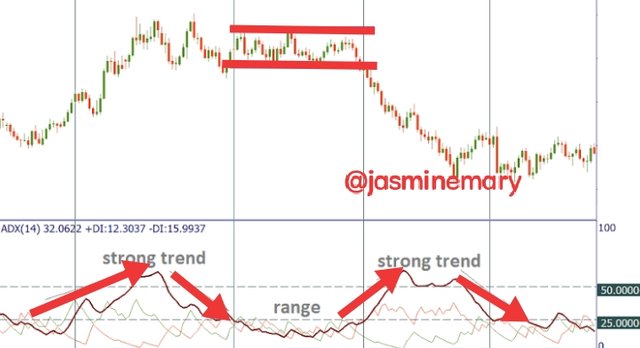
A value above 50-75 indicates that the trend is very strong or that markets are trending in progressive ways.
Extremely Strong:
A value above 75-100 indicates that the trend is extremely strong.This is the trend that traders usually want to see.
How do you filter out the false signals? (Screenshot required)
False signals occurs when the ADX indicator delay its signals, telling you that you have to leave your current trade, and move in the opposite direction, I think it's a warning to stay off of the pair for a while, until you have understand the pairs so well.
In other to fitter the false signals the best and easy way in the chart is 21 SMA (green): Locate the price action in according to the SMA: if the price is above the SMA in a buying signal or fall under the SMA in a selling signal. The other side of the market will be telling you that price is not yet ready to sell.
Another best way to fitter false signals is Proper period usage. The use of lower periods such as 7, 6 or any figure below gives out false signals and also higher periods above 30, usually delayed signals. The best possible way to avoid this signal is using 14 period in other to make good use of the ADX indicator without encountering too many false signals.
Explain what a breakout is
Breakout, technically refer to a situation where there is a trend change. Breakout is considered when to be breakout when the price of cryptocurrency or any tradable asset break a resistance level. If a breakout happen in trading, the previous resistance level usually becomes a current support level that can possibly lead to a small pullback. In a situation when the price remain above the level, the breakout will become successful.
Breakout typically happen in all forms of market trading, the most shocking price movements are because of channel breakouts and price pattern breakout like flags, traingle, head and shoulders patterns. As the volatility occur during such period, it will expand after the price increase above the specify ranges.
How to use ADX to filter valid breakouts
ADX indicator is also used to filter valid breakouts, by measuring the strength of a trend that will enable you confirm valid breakouts.Also when the ADX moving line is 25 below and the exits point is a breakout, traders is advisable to stayed out because it happened in a week.
No matter the timeframe, that is been use breakout trading is a good strategy, be it intraday, daily or weekly trading charts,the experience are universal.such can be apply to any style of trading. Below is a screenshot of breakout example.
Valid breakout
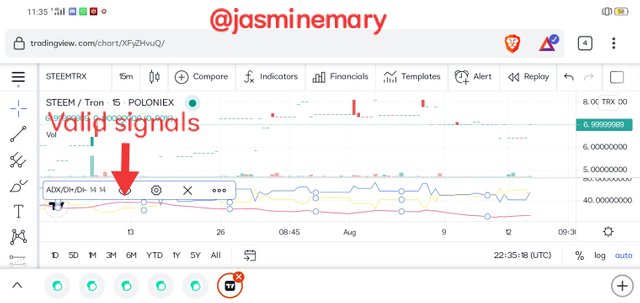
The above is a chart of BTC/ETH the both coins has been sideway moving in price for a while,and if you look well you will notice that the bullish candlestick stands as the support level following after the bearish candlesticks for some time. The breakout occur when the ADX is 40 above which means that is a valid breakout,the breakout has makes the price of the coin to dropped.
False breakout
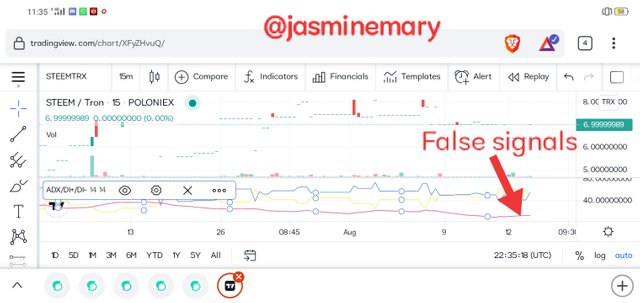
The above is also a chart of STEEM/TRX on 15 m timeframe, the both coins has been moving in sideways for a while and if you take a closer look you will see a bullish candlestick after the bearish candlesticks which mean a possible reversal that happened at the time the ADX line is 40 below which makes it makes it to become a false breakout. Looking closer to the chart you see that the price became resistance above the previous resistance which means ADX is currently filtering the false breakout out.
Difference between using ADX for scalping and swing trading
Below are brief different between using ADX for scalping and swing trading
ADX For Scalping Trading
Scalping trading is a trading that has to do with thousands of trade within a short period of time. ADX for scalp trading is very useful for scalping trading as traders used it to carried out activities of scalping trading. This is because a trend strength is determined by ADX indicator which makes traders to determine the trend of their trade within a point of time base on the timeframe that the trader is using on the chart. ADX is also used by traders to know support and resistance level and as well used with other indicator.
ADX indicator can be utilized by scalp traders to carry out the activities of their scalp trading. Remember, the strength of a trend is measured by the ADX indicator and this enables the trader to determine the strength at a particular period depending on the time frame used on the chart.
ADX for Swing Trading
Swing trading is a trading style that has to do with long term trading that requires you to be patient enough to handle the trades for many days.ADX indicator is useful for swing trading to perform trading activities. It advisable for traders to be vigilant at their trade when making use of the ADX with other indicator,as a trader you need to study your chart very well to be able to determine strength and other indicator strength whenever ADX is been added to other indicators for short term trade.4h should be the timeframe use.
My Choice
Since am a busy person,and always get distracted sometimes, I will prefer ADX for Swing trading because I cannot be monitoring charts all the time. At least choosing swing trading will give me enough to do other things as I will only be checking my trade from time to time which will give me a enough to analyze what is going on in global market.
Conclusion:
The purpose of ADX indicator is to help traders identifies the strongest trends to trade which is the main purpose to why traders are using it. ADX also helps trader to be able to identifies range condition,which make traders to avoid trend trade in sideways price movement. Finally, ADX indicator displayed when price has broken out of a range with enough strength to make use of trend trading.
Hello @jasminemary,
Thank you for participating in the 7th Week Crypto Course in its third season and for your efforts to complete the suggested tasks, you deserve a 5.5/10 rating, according to the following scale:
My review :
An average work in which the topic was discussed in all its aspects through answers of varying accuracy, some of which lack depth in the analysis, which loses the work's critical dimension in some paragraphs.
A simplified and understandable explanation of the indicator and its use.
The final operation is ADX = Sum of n [((DI +) - (DI-)) / ((DI +) + (DI-))] / n, So to get the correct ADX result, you need to calculate DX values for at least n periods then smooth the results.
Determining the best settings mainly depends on the trading strategy that the trader is willing to use.
A superficial explanation of two methods of trading with ADX indicator, as you confined to stating generalities without going into more details.
Thanks again for your effort, and we look forward to reading your next work.
Sincerely,@kouba01
Downvoting a post can decrease pending rewards and make it less visible. Common reasons:
Submit