
Greetings to you my noble professor @abdu.navi03 for the wonderful lesson you have share on the topic : "CRYPTO TRADING STRATEGY WITH MEDIAN INDICATOR". Indeed after reading through your lesson, I have come to understand what median Indicator is all about which I am here to shared.
1-Explain your understanding with the median indicator.
Most traders that are always looking for a way to measure the market direction and volatility of their asset usually make used of median Indicator to do so. The words Median Indicator, is just like any other types of Indicator that is applied on a chart, but measure the market direction and volatility.The Median Indicator, is a special types of Indicator that is used to measure the market direction and volatility of an asset. Median Indicator creates a channel based on how the deviation of Average True Range (ATR) is degenerate from the range midle-point. Basically, median Indicator displays the median value between the average of the value of low and high for a given length. It make up of a median line that is thick, which act as a moving average (MA) that provides a green and purple colors which indicates when a market is in either bearish trend or bullish trend. The gap between the median and its EMA is Indicated as a cloud colored, which is based on how higher the values are. Although, the green band often appears anytime the median line crosses above the EMA of the same length which is a sign of an uptrend movement, whereas, the purple band appears anytime the median line crosses below the EMA, which is a sign of a downtrend movement.
2-Parameters and Calculations of Median indicator. (Screenshot required)
The median Indicator is enclosed by bands on the ATR. In order for these bands to be calculated, is to multiplied the ATR multiplier by the ATR values for a given length and add it to or minus it from the median line. This calculation can be done below.
Main Source = Represent the data source that the median is calculated from
Median Length = This represent the numbers of data points of the source that are used at the time the median is being calculated.
ATR Length = This represent the period of time that is used when calculating the Average True Range (ATR) of the median. (i.e the default 14 ATR length)
ATR Multiplier = Is the value that the ATR is multiplied by before the formation the bands. (i.e it default setting is 2 ATR Multiplier).
Median length + (2ATR Multiplier) = Upper band
Median Length - (2ATR Multiplier) = Lower band
The two values above are the default values that is mostly unchanged when it's used by traders. However, there are other default values which as; Median source hl2, median length 3 and the ATR length 14 that are also default settings that can also be changed as well. Let's take a look at the parameters below.
Parameters of Median Indicator
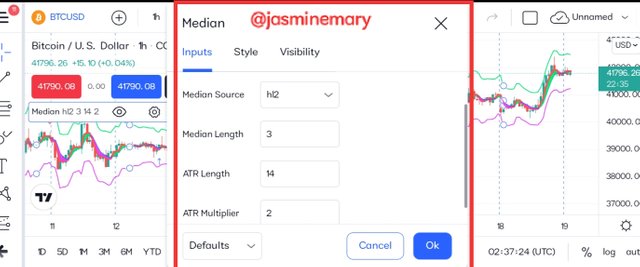
Looking at the screenshot above, is the parameters of the median Indicator showing the its default settings as mentioned above. The Average True Range (ATR) and Median length are the two parameters that ascertain the signal that is send by the median Indicator. (i.e ATR and Median length, determine the signal that is passed by the median Indicator).Let's take a look at the next on the screenshot below.
Style
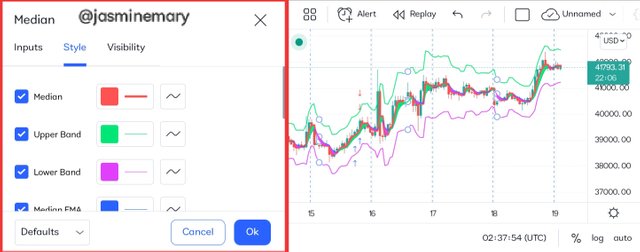
Looking at the screenshot above, we can see that we are at the Stlye interface, which is at the middle of input and visibility. From the Stlye settings we can change the look/appearance of the median Indicator according to the colors that suit our need.
3-Uptrend from Median indicator (screenshot required)
Trend based Indicator is what median Indicator is all about just like other trend based Indicator that we. The only thing in the median Indicator is that the EMA and the median line of the same length forms a band that ascertained which is a bullish trend and a bearish trend. Just as i have said earlier,the green band often appears when the median line crosses above the EMA of the same length which is trigger/signal an uptrend movement. This means that a buy trade order can be placed in the market. Let's take a look at the screenshot below.
Uptrend
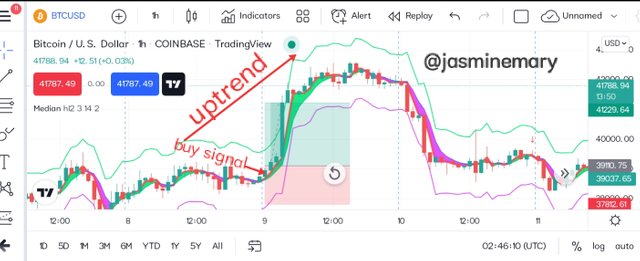
Looking at the screenshot above, we can see that is a chart of BTC/USD pair on 1 hour timeframe, showing how the bands of the median Indicator changes it colors from purple color to a green colors which is a sign that the market has changed from a bullish trend to bearish trend, meaning that a buy order trade can be placed. In other way round when the green colors change to the purple color you should know that the market is in a bearish trend.
4-Downtrend from Median Indicator (screenshot required)
Based on what I have earlier said when discussing about uptrend for median Indicator, I said that the median Indicator and EMA and the median line of the same length forms a band that ascertained which is a bullish trend and a bearish trend. The band/cloud become purple color when the median line crosses below the EMA which is a sign of a downtrend movement. (i.e when this occur, you should know that the market has change from from bearish trend to bullish trend, and at this point a sell order trade can be placed in the market. Let's take a look at the screenshot below.
Downtrend
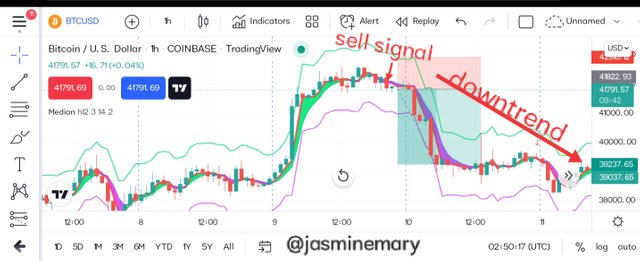
Looking at the screenshot above, we can see that is a chart of BTC/USD pair on 1 hour timeframe, showing how the bands of the median Indicator changes its colors from green color to purple color following the bullish trend in the market. This is a sign that a sell trade order can be place since it has change from bullish to bearish trend.
5-Identifying fake Signals with Median indicator(screenshot required)
Honestly, when it come to trading and the use of Indicator, we all know that there is no that is absolutely perfect without giving fake signals. To this it means that even median Indicator is also among such Indicator that also give fake signals. However for Indicator to be at least 95% accurate in providing signals such and into should be combine with other Indicators and that is the reasons why I have combined median Indicator and Relative strength Index (RSI) to identify fake signals that is associated with median Indicator.
Relative strength Index is known as a momentum oscillator that measure the price movement of an assets. It's used by trader to determine the area of overbought and oversold. It's plots from a scale of zero (0) to 100. When the RSI is above 70 is and Indication that buyers are in control of the market, whereas below 30 RSI is an indication that sellers are in control. So now let's take a look on how RSI can help us Identify fake signals as it's combined with median Indicator.
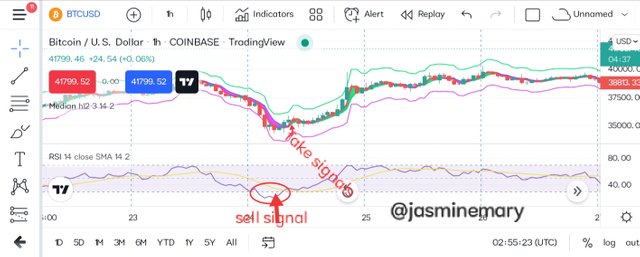
Looking at the above screenshot, we can see that RSI Is below 30 which is a sign that sellers are in control of the market. But from the median Indicator, its still showing the green color indicating that buyers are in control which has not indicate a bullish reversal. To this we can see that the signals is fake and Al we have to do is to wait for the both Indicators to correspond with each others.
6-Open two demo trades, long and short, with the help of a median indicator or combination that includes a median indicator (screenshot required)
Here is will be opening a two Demo trade on my TradingView account using the signal that I got from median Indicator and execute the trade using paper trade.
BTC/USD Buy
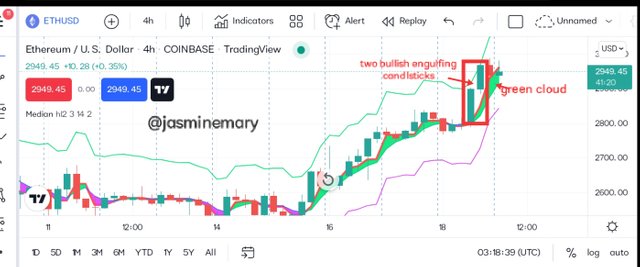
From the chart above, we can see that price was in an uptrend, which the already Indicated by the median Indicator showing a purple bands color.At the chart we can see two bullish engulfing candlstick before one bearish candle that try to bring the price down and still yet the cloud band didn't change color it was still indicating green cloud which is a signal for a buy order trade to be open. Immediately, I saw that the formatiton of the green candle and the green cloud I then placed my order and set my risk reward ratio as 1:1.
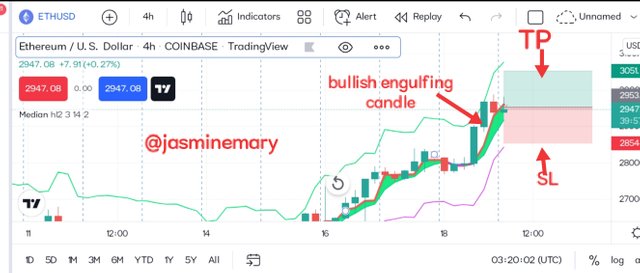
Below are the trade and the history of my paper trade.

DOT/USDT Sell
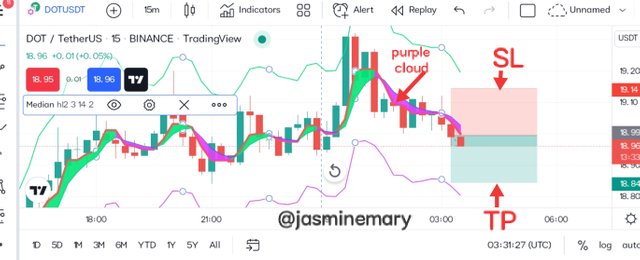
From the chart above, we can see that there was a trend reversal as the median Indicator cloud change from a bullish trend to a bearish trend where we can see how the green cloud has change to purple cloud color which is a signals for a sell order trade to be place. After seeing a clear bearish trend, I then open my sell order trade.

Conclusion:
From this post we have come to understand what median Indicator is all about. The median Indicator is a tool that is used by traders to measure the market direction and volatility of an asset. All thanks to professor @abdu.navi03 for his wounderfu lesson which is the foundation of this my homework post.
C c:-
@abdu.navi03
