 Edited with flyer maker
Noble greetings to you my Cryptoacademy professor @fredquantum and also to you my lovely readers. It's a great day for we to be counted among the living today. For it's not by our power nor strength but it's all by the grace of God that we all are here today to read about my homework task that was given by professor @fredquantum on the topic: "Trading Strategy with Triple Exponential Moving Average (TEMA)". This topic is a very interesting topic that all crypto traders and forex traders need to read and understand very well. Now without wasting time let's get straight to the homework post below.
What is your understanding of Triple Exponential Moving Average (TEMA)?
Triple Exponential Moving Average (TEMA) is what is used by traders to identify trends in the market. TEMA is a short abbreviation that stands for Triple Exponential Moving Average which was developed by Patrick Mulloy and launched in the year 1994 as the first moving average to solve the problem of technical analysis of traded assets. The developer Patrick Mulloy noticed that by him developing a simple unique composite of triple exponential moving average, simple exponential moving average, and double exponential moving average, it could definitely, minimize the amount of lag that is between price action and the Indicator. This means that the purpose of building triple exponential moving average is to helps traders filter out volatility and minimizes the effect of large price fluctuations that is associated with moving average.
As I have earlier said, Triple Exponential Moving Average minimizes the lag of that is between price action and traditional Exponential Moving Average (EMAs), making it more useful and more recommendable for short term trading. Immediately, after Double Exponential Moving Average (DEMA) was developed by Patrick Mulloy in the year 1994, he didn't relent, but rather he took a bold step that lead to the creation of Exponential Moving Average (TEMA). Triple Exponential Moving Average helps traders to identify trends in the market of a traded asset and take care of price fluctuations, to identify support level and resistance level of the price of the asset.
Uses of the Triple Exponential Moving Average
Triple Exponential Moving Average is developed to be used for the purpose of trading with trends. TEMA make use of other three (3) multiple moving average of price to smooth out short-term fluctuations, with the use of TEMA multiple of other technical Indicators or oscillators can be of help to traders to understand and interpret price fluctuations.
How is TEMA calculated? Add TEMA to the crypto chart and explain its settings. (Screenshots required).
Triple Exponential Moving Average (TEMA), is calculated by chosing a time period, before the initial Exponential Moving Average (EMA) can be calculated. After calculating the EMA, the next step is to calculate the double exponential moving average (DEMA) from the initial EMA. And finally, after you have calculated the DEMA the last step is to calculate the Triple Exponential Moving Average (TEMA) by taking the third EMA from the DEMA. Let's take a look at the formula that is used to calculate TEMA below.
TEMA Calculation is expressed as :
Single-, Double-, and Triple-Smoothed EMAs:
Where:
EMA1 = EMA of Price
EMA2 = EMA of EMA1
EMA3 = EMA of EMA2
TEMA = (3 * EMA1) - (3 * EMA2) + (EMA3)
From the formula above, if you want to calculate your TEMA, the first thing you're to do is to choose a period of look back that has a lesser period of number like 10,so that price can be traced by EMA otherwise anything like 100 above price cannot be trace by EMA.
Plug EMA1, EMA2, and EMA3 inot the Triple Exponential Moving Average formula to calculate the TEMA.
How to Add TEMA on your Chart
In order for you to be able to add TEMA into your chart all you have to do is to visit TradingView platform and click on Indicator at the top of the TradingView page as shown from the screenshot below.
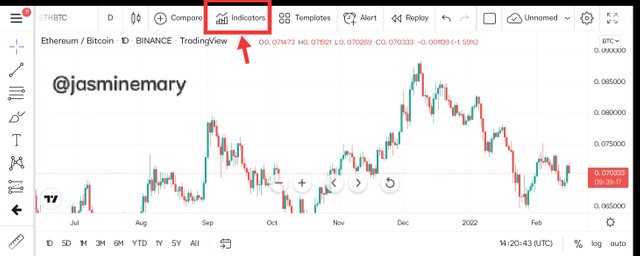 screenshot gotten from TradingView
After you have clicked on Indicator, you will see and interface, where you can search for TEMA, on the search box start typing the name in full then you will see Triple Exponential Moving Average click on it as shown from the screenshot below.
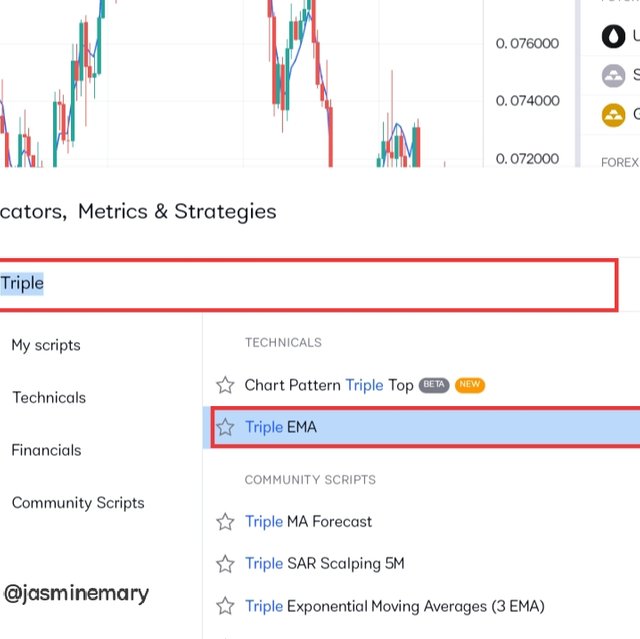 screenshot gotten from TradingView.
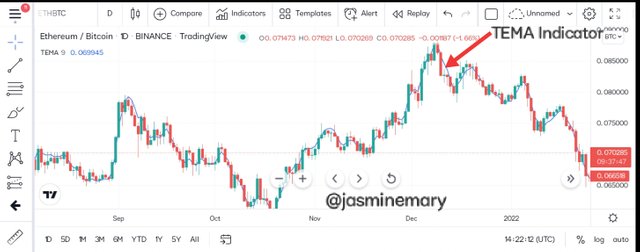 screenshot gotten from TradingView.com
From the screenshot above we can see that TEMA has been added on the chart.
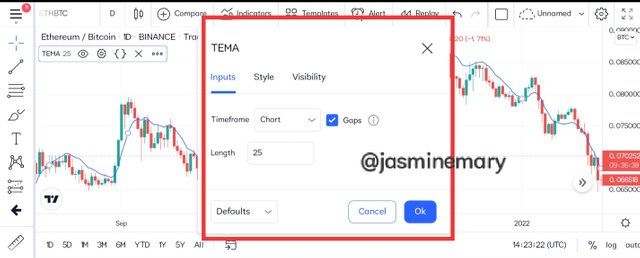 screenshot gotten from TradingView.
Now, if you feel like changing the setting of the Indicator click on the setting icon and make your change as you wish. In my own case I have changed my period from 9 to 25 period. Although TEMA react more faster short term trading period than longer period. But longer period give out clear signal as compare to short-term period which is the reason to why I change to 25 period.
Compare TEMA with other Moving Averages. You can use one or two Moving Averages for in-depth comparison with TEMA.
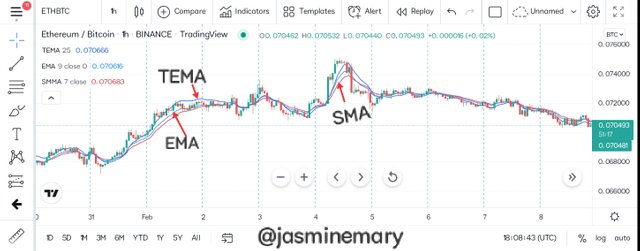
Here I will be discussing on the comparison between TEMA, EMA, SMA and WMA Indicators on a chart below.
 screenshot gotten from TradingView
Looking at the above chart we can see that both TEMA and EMA has been added into the chart. The TEMA increase increase upon SMA this s because the calculation is more weighted than TEMA when giving recent than previous prices. For this purpose EMA react more faster to recent price changes and alert trader to as soon as trend is change more faster than SMA which is more of lagging. For this purpose, EMA is more useful to traders than the rest Indicators. TEMA is calculated using formula that is more complicated, and the purpose of building the Indicator is for smoothing volatility and minimizes the lagging of price actions. WMA and EMA are still useful Indicator and they are still regarded as lagging Indicator to some point since when one add TEMA into a chart one can still have access to WMA and EMA since they both follow price action and give a quick response to trend reversal.
WMA is almost the same Indicator to that of EMA because of the more weight that the Indicator give in terms of recent prices over previous prices. What make WMA to be differ from EMA is it calculation that is just different a little bit, although when the both Indicator are apply on a chart they readings almost the same. Even though WMA is for you to quickly change trend.
Explain the Trend Identification/Confirmation in both bearish and bullish trends with TEMA (Use separate charts). Explain Support & Resistance with TEMA (On separate charts). (Screenshots required).
As we all know, the basic method that is been used to identify/confirm trend in other moving average is equally the same method that is used for trend Identification/confirmation in TEMA trading. In TEMA trading to be able to identify trend, all you have to know is that the price crossover and when the price of the asset breaks the TEMA, is when we can get our entry signal or exit signal in the same direction.
Bullish Trend With TEMA
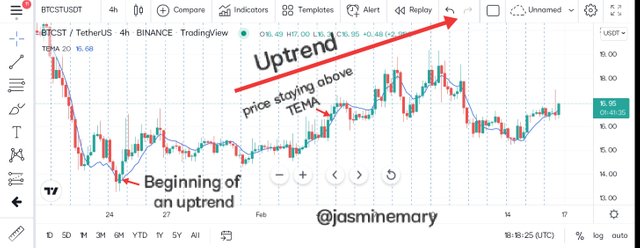
For a bullish trend Identification, the price of the traded asset and the TEMA crossover, the price and starts a new increase in the direction of the cross. In a simple understanding concerning the bullish trend, the price of the asset and TEMA angel (move) upward. In order for the trend to be confirmed the price move of the asset should be above that of the Triple Exponential Moving Average (TEMA) Indicator which is a sign of a bullish trend. Let's consider looking at the screenshot below:
 screenshot gotten from TradingView
From the chart above, the current trend was identified by the TEMA Indicator, with its price moving in the same direction with the price of the traded asset which is moving in an uptrends. Looking at the chart very well we can see that the price of the asset was trading above that of the TEMA Indicator.
Bearish Trend With TEMA
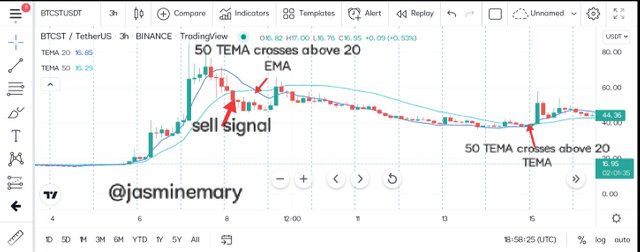
For a bearish trend Identification, the price of the traded asset cross when the price is closes below the TEMA Indicator. In a very simple understanding concerning the bearish trend, the price of the asset and TEMA angle (move) (move) downwards. In order for the trend to be confirmed, we will have to watch out if price has breaks the TEMA in a bearish direction, so we can place a sell signal. Let's consider looking at the screenshot below:
 screenshot gotten from TradingView
From the chart above, we can see that the current trend was identified by the TEMA Indicator, with its price moving the same direction with the price of the traded asset which is moving downwards. Looking at the chart very well we can see that the price of the asset was trading below that of the TEMA Indicator.
Support and Resistance levels with TEMA Indicator
The most accurate way that a trader can identify the price of their trade asset is to identify the support level and resistance level. The support and resistance levels are certain price levels (points) on a chart that is expected to attract buyer or seller in to the market. Support level is the level at which buyers are more in control of the market than sellers. Whereas resistance level is the level at which sellers are more in control of the market than buyers. Let's look at them one after the other.
Resistance level with TEMA
Resistance is when price has stops from further rising. TEMA stands as resistance to the movement of price that is in an uptrend movement. When price get closer to the dynamic resistance TEMA reject the resistance which is an indication of trend reserval that occur from bullish trend to bearish trend. At this point, it's and opportunity for trader to place a trade order after a pullbacks as soon as TEMA is rejected by the price of the traded asset. Let's consider looking at the screenshot below:
From the chart above, we can see that TEMA is standing as a dynamic resistance level to the movement of the price of the traded asset. As at the time the dynamic resistance was rejected by price, that is when price then reject and pullback before a bullish trend the continues.
Support level with TEMA
TEMA stands as a dynamic support level to the movement of price in a downtrend. When price get closer to the dynamic support TEMA reject the support, which is an indication of trend reserval that occur from bearish trend to bullish trend. At this point, it's and opportunity for trader to place a sell trade order that can be executed immediately the price is rejected by the TEMA after a pullbacks. Let's consider looking at the screenshot below:
From the chart above, we can see that TEMA is standing as a dynamic support level to the movement of the price of the traded asset. As at the time, the dynamic support was rejected by price that is when price then reject and pullback before a bearish trend continues.
Explain the combination of two TEMAs at different periods and several signals that can be extracted from it. Note: Use another period combination other than the one used in the lecture, explain your choice of the period. (Screenshots required).
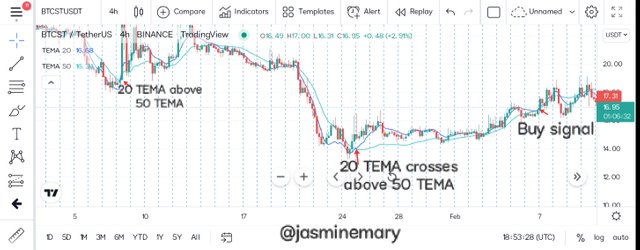
The combination of two TEMAs at different periods and several signals can be of more adventages to traders to filter out volatility and minimizes the effect of price fluctuation that is associated with moving average. In combining two TEMAs what a trader need to know is that if the TEMA that has the lower period has crosses over the other one that has higher period, it's an indication that the trend is valid enough and s buy order position can be open. On the other hand, if the TEMA that has the higher period has crosses over the TEMA that has the lower period, it's an indication for a trader to place a sell order trade.Let's consider looking at the chart below, where I make used of 20 period TEMA and 50 period TEMA due to how these two period represent price accurately and smoothly.
 screenshot gotten from TradingView.com
From the chart above,and just as I have earlier said, when the TEMA with the lower period (20) has crosses above the TEMA with the higher period (50) it's an indication of a bullish trend, meaning that buying pressure is more than selling pressure which trigger a buy order just as we have seen from the chart above.
On the chart, we can see that the lower period (20) TEMA has crossed the higher period (50) TEMA which is a sign that buyers are in control of the market.
On the other hand as I have earlier said,when the TEMA with the higher period (50) TEMA crosses the TEMA with the lower period (20) TEMA it's an indication of a bearish trend, meaning that selling pressure is more than buying pressure which trigger a sell order trader. Let's take a look at the screenshot below:
 screenshot gotten from TradingView.
From the chart above, we can see that the higher period (50) TEMA has crossed the lower period (20) TEMA which is a sign that sellers are in control of the market.
What are the Trade Entry and Exit criteria using TEMA? Explain with Charts. (Screenshots required).
Trade Entry and Exit Criteria Using TEMA
The strategy of trading with TEMA for a good trade entry and exit requires traders to acquire some certain criteria to be considered as someone who has understand how to make use of TEMA for proper trading. For illustration of the strategy that is required, I have make used of two TEMAs strategy to carried this trade criteria below;
Buy Trade Entry and Exit Criteria
In order to place a buy trade, the following requirements must be put in place:
You have to add two (2) TEMAs on the price chart with different periods.
In a downtrend move, you have to wait for the TEMA lower period to cross above that of the TEMA higher period.
Once the crossover is done, place your buy order entry after the confirmation of at least two candlesticks.
The buy order trade can get exited if the price get close to a resistance level along the line of TEMA. In placing your buy order, let your stop loss and take profit be in a ratios of 1:2 risk reward ratio so your trade can be good enough, because 1:2 ratios is more recommendable.
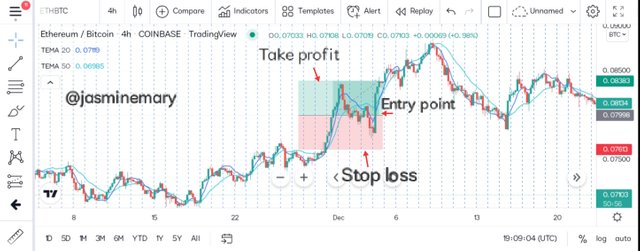
Now, for better understanding let's consider looking at the screenshot below:
 screenshot gotten from TradingView.
From the screenshot above, we can see that after the bearish trend, the lower TEMA period crossover the higher TEMA period. After the price movement has break above the TEMA, it was when a confirmation of how buyers are in control of the market was confirmed. At this point a buy order trade can be place after the confirmation of two bullish candles, with a take profit place closer to the resistance level and also stop loss place below the previous low.
Sell Trade Entry and Exit Criteria
In order to place a sell trade, the following requirements must be put in place:
You have to add two (2) TEMAs on the price chart with different periods.
In an uptrend move, you have to wait for the TEMA higher period to cross above the lower period.
Once the crossover is done, place your sell order entry below the TEMA after the confirmation of two candlsticks
The sell order trade can get exited if the price close to a support level along the line of TEMA. In placing your sell order, let your stop loss and take profit be in a ratios of 1:2 risk reward ratio so your trade can be good enough since 1:2 risk reward is more recommendable.
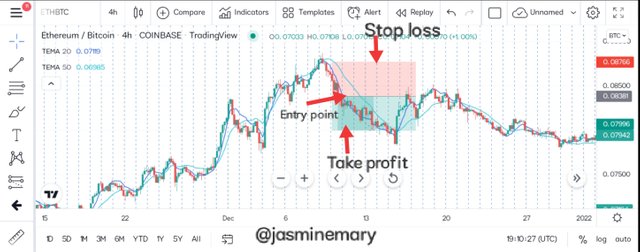
Now, for better understanding let's consider looking at the screenshot below:
 screenshot gotten from TradingView
From the screenshot above, we can see that after the bullish trend, the higher TEMA period crossover the lower TEMA period. After the price has break below the TEMA, it was when a confirmation of how sellers are in control of the market was confirmed. At this point a sell order trade can be place after the confirmation of two bearish candles, with a take profit closer to the support level and also stop loss place above the previous high.
Use an indicator of choice in addition with crossovers between two TEMAs to place at least one demo trade and a real margin trade on an exchange (as little as $1 would do). Ideally, buy and sell positions (Apply proper trade management). Use only 5 - 15 mins time frame. (Screenshots required).
Here, I will make used of Relative strength index Indicator as an additional Indicator to crossover to place my trade. Relative strength index Indicator, is and Indicator that is used by traders to identify the condition of overbought and oversold in the market. In order to identify the level of overbought and oversold the levels of 30 and 70 is been used. Literally, when the price of the traded asset fall below the level of 30, is an indication that the market is in the state of oversold which is equally a sign of bullish trend reversal. Although, when the price of the traded asset rise above the level 70 is an indication that the market is in the state of overbought which is equally a sign of bearish trend reversal.
Now in order for this two Indicators (RSI and TEMA ) to be combine together their must met the requirements of a crossovers. Let's take a look at how we can a trade when these two Indicators has been combined.
Demo Trade Sell Position (XRP/USDT)
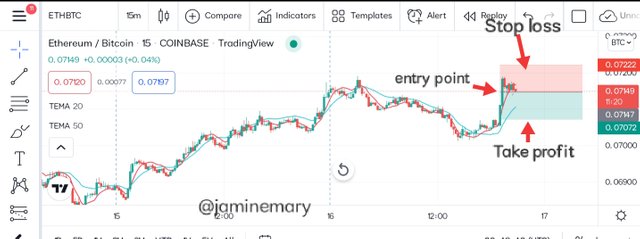 screenshot gotten from TradingView.
From the screenshot above, we can see that is a sell order trade of XRP/USDT pair on 15 minutes chart. Looking at the chart the 50 TEMA has crossed over above the 20 TEMA, which is a sign that sellers are in control of the market. Whereas the RSI fall below the midpoint of 50 which is a sign that sellers are really in control of the market. At this point after I have critically observed all the movements that was when I then placed a sell trade in my demo paper trading account using the data below:
Entry price : $0.07149
Stop loss : $0.07222
Take profit : $0.07072
As for the risk ratios reward, I make used of 1:1:7 risk rewards ratio.
Real Margin Trade Buy position (USDT/TRX)
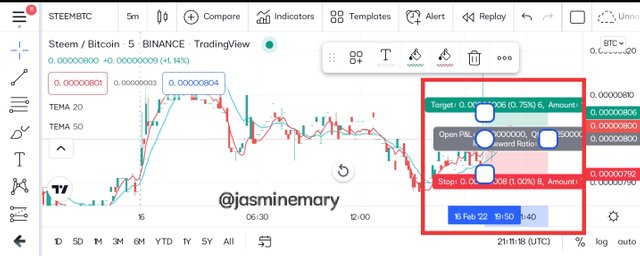 screenshot gotten from TradingView.
From the screenshot above, we can see that is a buy order trade of USDT/TRX pairs on 5 minutes chart. Looking at the chart the 20 TEMA has crossed over above the 50 TEMA, which is a sign that buyers are in control of the market. Whereas the RSI rise above the midpoint of 59 which is a sign that buyers are really in control of the market. At this point, after I have critically observed all the movements on the chart I quickly open my Binance exchange and placed a buy order trade at;
Entry price : $0.00000792
Stop loss : $0.00000800
Take profit : $0.00000806
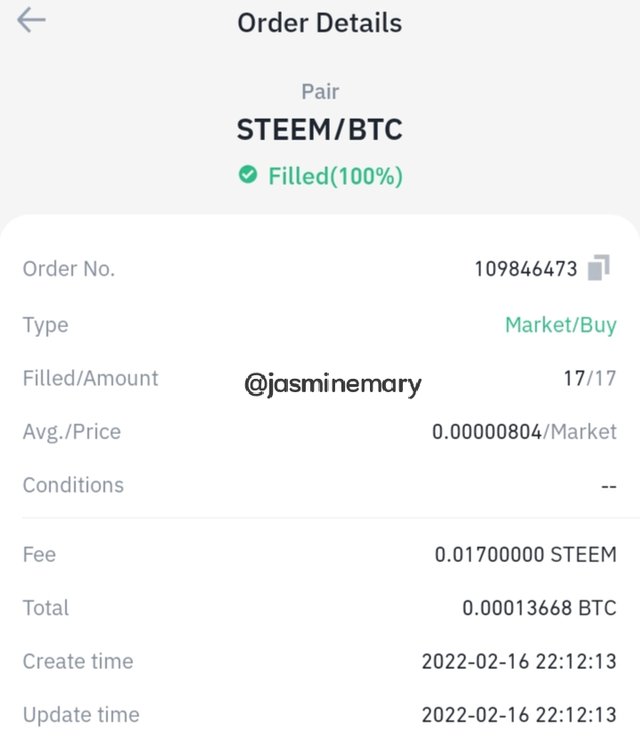 screenshot gotten from Binance exchange
What are the advantages and disadvantages of TEMA?
Whatever that has an advantages equally has its own disadvantages of which TEMA is not exempted. So let's take a look at it adv & dis in a tabular form below:
| S/N | Advantages of TEMA | Disadvantages of TEMA |
|---|---|---|
| 1 | TEMA allow traders to combine two different TEMAs for their analysis | TEMA is not exempted from given out force signals sometimes it signal are worst for decisions making |
| 2 | It reduces the amount of lag that is associated with price action | Combining of two TEMAs requires traders to pay more attention to crossover before their can have a successful trade |
| 3 | TEMA helps traders to indicates the opportunities of when to buy and when to sell their assets with it's strategy of crossover that comes with the use of two different periods that is used to identify trade signal | TEMA support and resistance levels be changed to something else due to the price is reacted |
| 4 | TEMA helps traders to identify trends | TEMA is still missing in some trading platforms |
Conclusion:
TEMA is a short abbreviation to the words "triple exponential moving average". TEMA was developed by Patrick Mulloy and launched in the year 1994 as one of the first moving average that is use to solve the problem of the amount of lag that is between Indicator and price action. Although, TEMA is not in majorities of other trading platforms, it custom setup is still missing in other trading platforms. All thanks to professor @fredquantum for sharing this wonderful topic : "Trading Strategy with Triple Exponential Moving Average (TEMA)", which has brought a lot of wealth of knowledge to me.
Thank You So Much My Wounderfu Friend For Your Time Here.
Best Regards;
Cc:-
@fredquantum-s6week2
