
Greetings to you friend, how are you doing today. I'm sure that you are doing very fine with your loved ones. Today is another great day for in our life as we are all counted among the living, may the name of God be praise forever. However, I'm here to discuss my homework post after reading through professor @kouba01 lesson on the topic "Crypto Trading Using Trix Indicator". Let's get started with the discussion.
1. Discuss in your own words Trix as a trading indicator and how it works
The words TRIX Indicator is an abbreviation that stands for Triple Exponential Moving Average (TRIX), that was developed by Jack Hutson in 1980s. The Trix Indicator is a very powerful technical analysis tool that is used by traders to determine the momentum of a price of a traded asset as well as Identifying the conditions of overbought and oversold in an underlying financial or crypto asset. Basically, triple exponential moving average (Trix) can be used as a momentum Indicator and also as an oscillator. When Trix Indicator is used as a momentum Indicator, it can filter out price movement that is considered insignificant (i.e spikes in price that are insignificant or irrelevant) and when Trix Indicator is used as an oscillator, it shows (displays) trough price zone and potential peak of the price of the traded asset.
Many traders has described Trix Indicator as an "impulse Indicator" that can point out when there is sinking or growing impulse in the market because they all feel that Trix is capable of pointing out such things in the market. Basically, speaking Trix is consider to belong to the group of Oscillator Indicators and it's the reasons why it's consider to be similar to Relative Vigour index (RVI) and Moving Average Convergence Divergence (MACD) Indicator
 screenshot gotten from TradingView
The chart above shows how Trix Indicator looks like. From the example, of the chart, we can see that I have applied TRIX on TORN/USDT chart.
How Trix Indicator works
As I have earlier said Trix Indicator is similar to exponential moving averages. Trix Indicator can be used as both oscillator and trend following Indicator. The work of Trix as a trend following Indicator, is used to allows traders to know that positive Trix values means that an uptrend is what is in place whereas when it is a negative Trix values it means that a Downtrend is in place. When the values of Trix run along the value of 0 (centerline), it means that the market is neutral. As I have earlier said that as an oscillator Trix is used to determine the conditions of overbought and oversold in the market. The extreme positive values imply overbought conditions, whereas the extreme negative values imply oversold condition.
2. Show how one can calculate the value of this indicator by giving a graphically justified example? how to configure it and is it advisable to change its default setting? (Screenshot required)
How to Calculate TRIX Value
As i have already known TRIX as a triple smoothed EMA, is basically an EMA, of an Exponential Moving Average (EMA), from here the "triple". EMA usually focused more on current price data of the traded asset as opposed to simple moving average (SMA) that only focused on calculating the average of prices of the traded asset, with equal weighting to all the price data. Almost all trading platforms make use of a 15-period as the default setting for calculating Trix Indicator, however even with the default setting, the parameters can be change to according to how best the trader can use it.
According to professor @kouba01 the formula for calculating TRIX is given below
TRIX = (EMA3 t - EMA3 t-1) / EMA3 t-1
However, let's take a quick look at the steps/procedures that is followed when calculating a default 14 period Trix below;
Step 1: Single smoother EMA = 14 period EMA is calculated based on price close
Step 2: Double Smoothed EMA = 14 period EMA of the single smoothed EMA (i.e step 1)
Step 3: Triple Smoothed EMA = 14 period EMA of that of the double smoothed EMA
Step 4: TRIX = 1 period percentage (%) change of that of double smoothed EMA
Applying, the above calculation will compute a Trix Indicator on your chart that swings below zero 0 and above, generating you a negative values and positive values.
What I mean from the statement above is that TRIX is always positive when the EMA is moving upwards and negative when the triple smoothed EMA is falling down.


screenshot gotten from TradingView
In order for you to configure this Indicator click on the Indicator in your chart and click on the setting icon then from there you can make your change. But it's advisable to make use of the default settings.
3. Based on the use of the Trix indicator, how can one predict whether the trend will be bullish or bearish and determine the buy/sell points in the short term and show its limits in the medium and long term. (screenshot required)
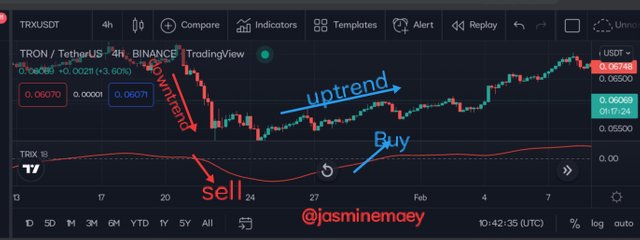
Basically, as a trader who understands how the TRIX works, you can sell or go short when you notice that the TRIX line has starts moving lower. The example of what am saying is shown in the chart below.
 screenshot gotten from TradingView
From the chart, we can see that the red lines show when the Trix Indicator sends a sell signal whereas the blue lines shows when shows Trix Indicator send or signals a buy signal. When making your prediction, you should ensure that the price of the traded asset is either trending downwards or upwards.
Another way that TRIX Indicator can be use is to combine it with MACD Indicator. The reason why combining the both Indicators is because their both appear to be almost the same on a chart. Combining the both Indicators together help traders to avoid breakout that are false. The screenshot below show a good example of what we are discussing about.
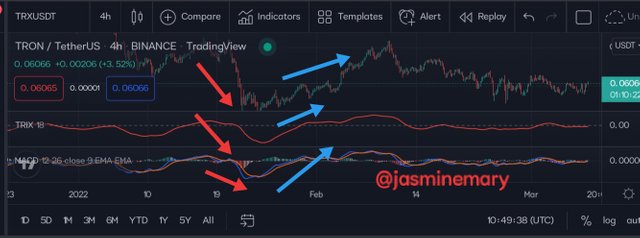 screenshot gotten from TradingView
Another way of using the TRIX Indicator is to apply the Indicator with (EMA) exponential moving averages. In order for you to do this, you will need to apply a 18-period TRIX and also 9-day period EMA. When you have applied this, the buy signals will come out when the TRIX and the exponential moving average (EMA) make a crossover while they are still below the neutral line. When this happens, bearish signal will likely come out when the crossover occurs above the neutral line, which we can see from the screenshot below.
4. By comparing the Trix indicator with the MACD indicator, show the usefulness of pairing it with the EMA indicator by highlighting the different signals of this combination. (screenshot required)
The MACD Indicator is a momentum and a trend following Indicator. Combining TRIX Indicator and MACD Indicator can provide traders with a great signal that their can use in entering new trends and exiting from the trends when a reversal is about to occur. An entry signal will happen when the TRIX Indicator crosses the zero (0) line and a crossover of the MACD occurs. For example, a buy order trade will be placed when the TRIX Indicator has crosses the zero (0) line from below and a crossover occurs in the MACD Indicator oversold region. A signal will be provided earlier when the MACD Indicator makes a crossover on the region of overbought, Although, traders that are patient enough do wait for the TRIX Indicator to cross the zero (0) line from the direction that is opposite.
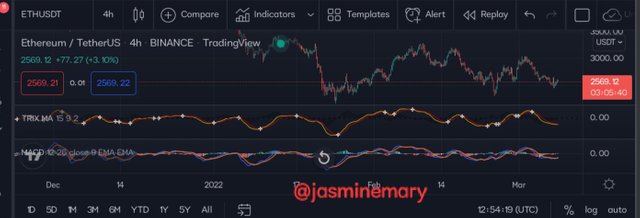
In order for we to understand how the two Indicators are differ, let's take a look at 15-period TRIX and then apply a 9-period EMA and see how the behavior of the chart will look like. Looking at the two Indicators we can see that they both move around the zero (0) line and both have similar signal line, the 9-peeiod EMA. From the chart below we can see that the TRIX Indicator trend is more smoother compared to MACD Indicator in terms of its movements.
 screenshot gotten from TradingView
The quality of the TRIX Indicator is in the area of trend, which makes things very easy for traders to avoid false signal that are insignificant in trading than the MACD Indicator.
By combining the two Indicators, as we can see from the chart, it has proof to us that TRIX has three important signals that it's offer traders. These three signals are details below.
 screenshot gotten from TradingView
The cross of the neutral zero (0) line represents is what represent a 2nd confirmation of the prior Indication that confirmed a bullish trend or bearish trend.
An important warning about a future change in trend is provided by TRIX Indicatoe.
The breakout of the signal line the TRIX Indicator is what gives an indication of the first future direction of price movements.
5. Interpret how the combination of zero line cutoff and divergences makes Trix operationally very strong.(screenshot required)
As earlier said above, TRIX can help traders determine the impulse of the market of a traded asset. With the zero (0) value as a centerline, if it crosses from below, is an indication that the impulse is growing in the market and traders can make use of the opportunities to place a buy orders trade. In addition to this, when there is a cross of the centerline from above is an indication that the impulse is falling and traders can make use of the opportunities to place a sell order trade.
In a case when TRIX crosses the zero (0) line starting from the bottom to top, that is when we can then say that the market of the traded asset has beging an uptrend moved,while I'd it crosses from top to bottom of the zero (0), it's when we can say that the market of the traded asset is has begin a downtrend move.
Basically, TRIX is often strong enough if a significant technical breakdown is supported, a breakdowns of dynamic supports and resistances level or better still if it's use with a price divergence.
Divergences
 screenshot gotten from TradingView
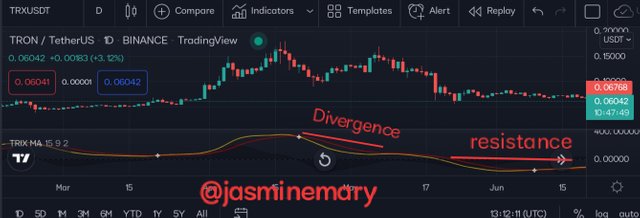
TRIX Indicator can equally be used by traders to identify when significant turning point can happen in the market of the traded asset. Literally saying it's done by carefully looking at the divergences. Divergences happen when the price of the traded asset is moving in an opposite direction from that of the TRIX. When the price of the traded asset is making a higher highs,while TRIX is making a lower highs, it's an indication that the uptrend is getting weaker, and that bearish trend reserval is about to occur (i.e take place). While when it's the opposite side of what we are saying, that is when the price of the traded asset is making a lower lows, but the TRIX Indicator is making a higher lows, it's an indication that a bullish trend reserval is about to occur (i.e take place).
6. Is it necessary to pair another indicator for this indicator to work better as a filter and help eliminate false signals? Give an example (indicator) to support your answer. (screenshot required)
As an exponential moving average (EMA) Indicator, TRIX Indicator often generates signals that are leading. It is with no doubt that pairing TRIX with other Indicators to select out probability with high opportunities when we are tracking a price is very important.
Here are the best and most important TRIX pairs:
Aroon Indicator
Aroon Indicator is seen as one of the best Indicator that can serve with TRIX by looking at the screenshot below.
 Aroon Indicator screenshot gotten from TradingView
From the screenshot above it can be seen that Aroon Indicators provide three different clear signals that we can used an enter and exit from the first downtrend, where the TRIX enters the sell region which later gives no exit signal. From the chart we can also see that the volume has been down for long and the price is about to begin to rise in period(3).
TRIX and Relative Strength Index (RSI)
RSI measures the momentum and strength of a trend. When it's paired with TRIX Indicator, Relative Strength Index (RSI) can help provide a clear buy and sell signals when the price of the traded asset is range bound. A very strong buy sign will occur when both TRIX and RSI are in oversold region and signal a potential trend reversal. Also, a very strong sell will occur when both TRIX and RSI are in overbought region and signal a potential trend reversal.
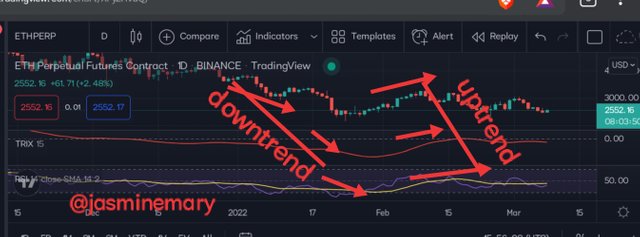 TRIX and RSI screenshot gotten from TradingView
TRIX and MACD
The MACD is a momentum and a trend following Indicator. Pairing TRIX and MACD Indicator can provide trader with a clear signals for entering new trends and exiting from the trend when a reversal is about to occur. Just as I have said earlier, an entry signal will happen when the TRIX crosses the zero (0) line and a crossover of the MACD occurs. For example, a buy order will be placed when the TRIX crosses the zero (0) line from below and a crossover occurs in the MACD oversold region. With this early entry signal will be given when the MACD makes a crossover on the overbought region, just as I have said concerning this earlier, a trader that is patient can wait for the TRIX to the zero (0) line from the direction that is opposite.
 TRIX and MACD screenshot gotten from TradingView
7. List the pros and cons of the Trix indicator:
Nothing is absolutely 100% okay without having a disadvantages in it. Although, even with little disadvantages, there are still several advantages of using TRIX Indicator which I have identified below;
Pro
TRIX is an ideal method of Indicator of finding breakouts and divergences.
TRIX can be used to filter out market noise, both on high and low timeframe charts.
TRIX Indicator can be applied on all types of traded assets.
TRIX Indicator,can also determines the direction of the main trend on a chart and as well price reversal.
Coin
One of the disadvantages of TRIX Indicator is that when price action starts to curl around the three (3) EMAs, the measure starts to converge round the three EMAs. This causes a narrow range in the Trix Indicator, that will make the Indicator results in crosses that is below and above the zero (0) line without producing a meaningful movement of price.
Secondly, if the price of the traded asset is not moving towards the direction of an impulse, Trix Indicator will starts generating false signals in the market.
8. Conclusion:
One of the most simple Indicator among all others that traders can make used of is TRIX Indicator. TRIX Indicator has been in existence even before the certain of cryptocurrencies and it very simple to calculate if you already know how to calculate EMAs. All thanks to my noble professor @kouba01 for his lesson with is the pillar of this homework post.

Unfortunately @jasminemary, your article contains plagiarized/Spun content
Rating Total|0/10
Source:
https://www.avatrade.com/education/technical-analysis-indicators-strategies/trix-indicator-strategies
The Steemit Crypto Academy community does not allow these practices. On the contrary, our goal is to encourage you to publish writing based on your own experience (or as per the mission requirements). Any spam/plagiarism/spun action reduces PoB's idea of rewarding good content.
This message is considered as a first warning.
Downvoting a post can decrease pending rewards and make it less visible. Common reasons:
Submit