Hello Steemians,,
It's my pleasure to be here. Today in this my homework task5 post , on the topic : SuperTrend Indicator, that was given by professor @stream4u . In this post, I will discuss about the following homework topics below:
- What Is A SuperTrend Indicator?
- Show how to set SuperTrend on Chart and what are its settings need to configure.(Screenshot Needed)
- How SuperTrend Shows Buy-Sell Indications? (Screenshot Needed)
- When We can place a Buy Trade with the help of SuperTrend Indicator? (Screenshot Needed)
- When we can place exit/square off, sell order with the help of SuperTrend Indicator? (Screenshot Needed)
- How false indications look in SuperTrend Indicator? (Screenshot Needed)
- According to your view what Stoploss you will suggest?
- Conclusion.
What Is A SuperTrend Indicator?
SuperTrend Indicator is a trending that is following a trading chart of and overlays. It's also a moving average, that shows the direction of a current trend trade.
Show how to set SuperTrend on Chart and what are its settings need to configure.(Screenshot Needed)
To set SuperTrend all you have to do it to;

- Visit www. tradingview.com
- Click on the drop down menu on the left and click on chart
- Click on FX indicator
- On the search box type Supertrend
- Select your desire Supertrend on the list and you will see a Supertrend as shown below:

How SuperTrend Shows Buy-Sell Indications? (Screenshot Needed)

In a SuperTrend the Buy is a Green and Support level while the sell is is a Red and Resistance level. Color can be given for the both.
When We can place a Buy Trade with the help of SuperTrend Indicator? (Screenshot Needed)

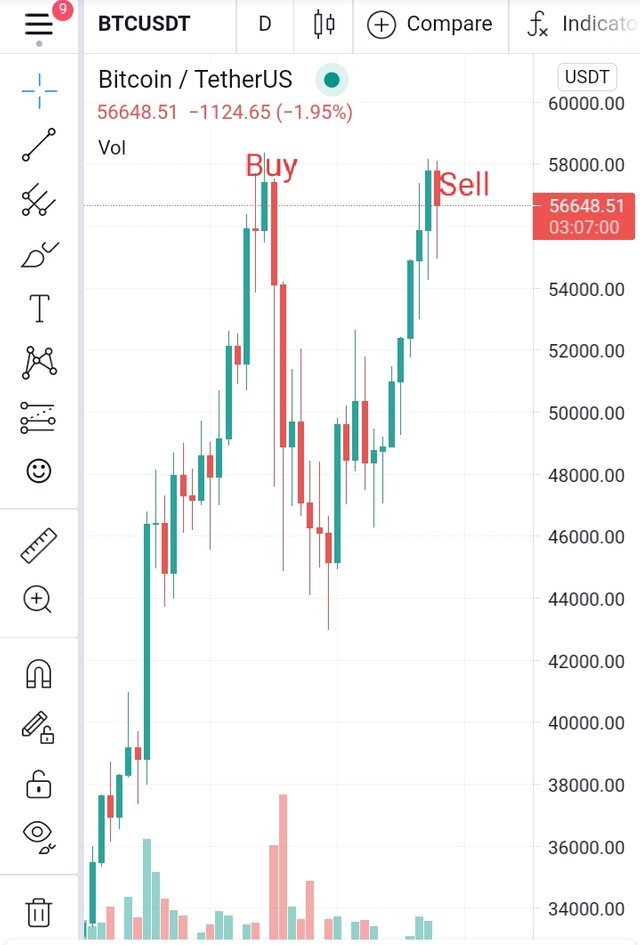
We can place buy trade when the price has come down to support level from the image below you can see that it advisable to be patience and allow the price to come down before placing a buy trade as indicated with Mark.
When we can place exit/square off, sell order with the help of SuperTrend Indicator? (Screenshot Needed)
We can place exist/square off, sell order when the price become high from what we buy, i.e from bearish to bullish.
How false indications look in SuperTrend Indicator? (Screenshot Needed)

The false indications is the red line that makes the chart seem it's rising while it's not.
According to your view what Stoploss you will suggest?
It is advisable that a trader should study the how the false signals move in other to to buy when it's high.
Conclusion
A Supertrend indicator also use and average true range (ATR) as a means of calculating the volatility of a market.