You are Welcome To My Homework Post That Was Given By Professor @reddileep On The Topic :How to Trade Cryptocurrencies Profitably Using TD Sequential
1- Define TD Sequential Indicator in your own words.
TD Sequential Indicator is an indicator that is used by traders to identify the point of a price as to where a downtrend or an uptrend movement wear out and reverses back. TD Sequential Indicator give traders a recommendation as to when to sell or buy cryptocurrencies or any digital assets.
In a nutshell, TD Sequential Indicator is define as a custom Indicator that is used by traders to identify between swing highs and sing lows in a chart which then marked the levels of swing high and low as a horizontal support and resistance levels in a chart. The swing level is plotted with a green dash lines of the swing high level that Indicate a support level that is horizontal.
2- Explain the Psychology behind TD Sequential. (Screenshots required)
The psychology behind TD Sequential Indicator is the three forecasting element that is use when trading. Although, the Indicator is combined with price action, price analysis pattern and also used as a Japanese candlestick. Here is I will be discussing about the three forecasting tools/element of the TD Indicator below.
- The Price Flip:
Price Flip Indicate show a signal of whenever there is a potential reverse.Below, is how this tool is applied in a chart. Looking at the below chart is a pair of BTC/USD pair showing the TD sequential Indicator.
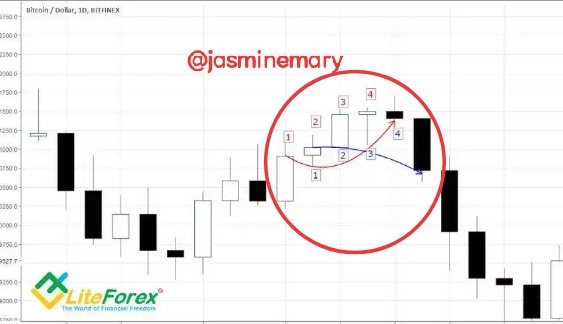
Screenshot gotten from Liteforex
As stated above concerning the price flip, there are 6 candlesticks in it which can be identified by traders. The last candlestick is lower than the close four bar at the beginning , whereas the last one close is then higher than the close four bars at the beginning which are all the requirements for price flip.
- The Setup filters:
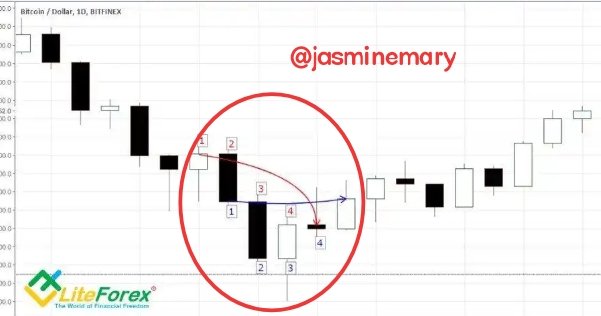
This is a tool that is use to filter out signal most especially, false signals, the setup signal is use to identifies a trend that is new and also when the beginning and end of the trend within the present trend of the chart. Since the setup is a reversal pattern which is form when cycle is closed. The Setup is usually accompany, sell price flip and so on.
Screenshot gotten from Liteforex
The Setup happens if there are 9 constant closes that are lower than the close 4 bars at the beginning which is illustrated in the chart above.
- The Countdown:
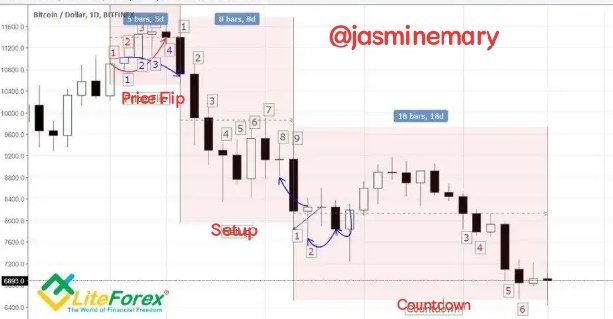
This is a tools that is use to calculate the trend length on the chart and also use to identifies the time of fading and the beginning of the a starting point of a new cycle, of the price flip tools.
Screenshot gotten from Liteforex
The countdown is is made up of 13bars just as the setup is made up of 9 constant close. It is counted at the beginning of the last Setup bar which then form a new set in another direction.
3- Explain the TD Setup during a bullish and a bearish market. (Screenshots required)
Bullish setup
The TD Setup during a bullish, is a setup that opposite the bearish setup. This mean that as a trader am buying the crypto whenever the price fall meaning that the bullish setup is the setup that is put in place to buy an asset when the price fall down.

Screenshot gotten from TradingView
The setting bullish as a buy order we have to make use of the price flip. When the price of the cryptocurrency is trading in an upward direction for some time, there must surely, be a change in the price that will be in opposite direction that will make the price to fall down. The first thing to look at the bullish setup is the one (1) that is important to count. The number one (1) of the TD should be a close below the number four (4) candles, which should be below the previous 4 candles vers versa.
Bearish Stepup
The bearish setup is the opposite of the bullish setup, meaning that we want to sell our cryptocurrency when the price is high. Before the bearish setup happen the market need to be in bullish direction for the price to fall, and once there is a price flip, with a change direction from downward to upward direction,it means a bearish count should start.

Screenshot gotten from TradingView
In counting this requires us to start counting from the number one (1) candles to the previous four (4) candle that is form after the number 1. Once the number 1 bar is settle, the number 2 candle must have a close that is above the close of 4 period of the bar vice versa.
4.Graphically explain how to identify a trend reversal using TD Sequential Indicator in a chart. (Screenshots required)
In identifying a trend reversal using TD Sequential,is by knowing our strength and weakness of the TD Sequential. In a strength market Indicate that the price of the asset that is traded in the market is rising up it will get to a stage where the seller will be in charge of the market, that when there is and Overbought. And when it happened there is going to be a reversal signal in a chart. The Below screenshot is a pair of BTC/USD shown the it is indicated.
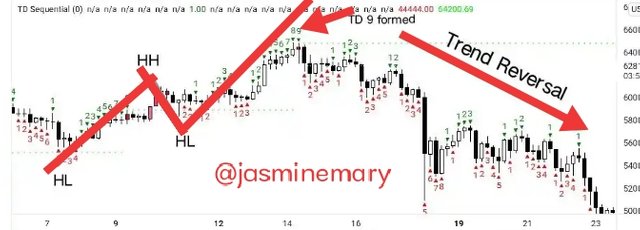
Screenshot gotten from TradingView
The trend reversal make trader to be able to cope with the upward and downward movement of the markets and to wait patiently for price to get back to a particular points so they can either sell or buy up an asset as trading activities is at the level of upward movement. The image below graphically show how trend reversal using TD Sequential Indicator can be in a chart can be identify.
5. Using the knowledge gained from previous lessons, do a better Technical Analysis combining TD Sequential Indicator and make a real purchase of a coin at a point in which TD 9 or 8 count occurs. Then sell it before the next resistance line. (You should demonstrate all the relevant details including entry point, exit point, resistance lines, support lines or any other trading pattern such as Double bottom, Falling wedge and Inverse Head and Shoulders patterns.
At this point I make used of TradingView and Binance exchange to make a purchase of SHUB/USDT.
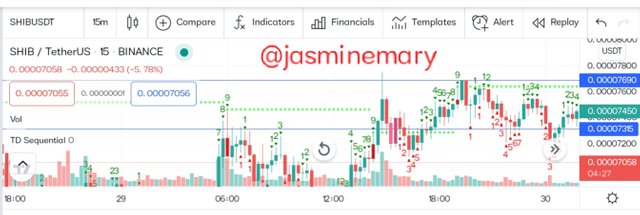
Screenshot gotten from TradingView
At first, I visit TradingView chart and look at SHUB/USDT pairs. At the chart I found out that the TD number 9 is at a very strong support level. At this point since SHUB is at a support level, I then open my Binance exchange and sell my 145,000 SHUB for 10.25 USDT which is shown below.
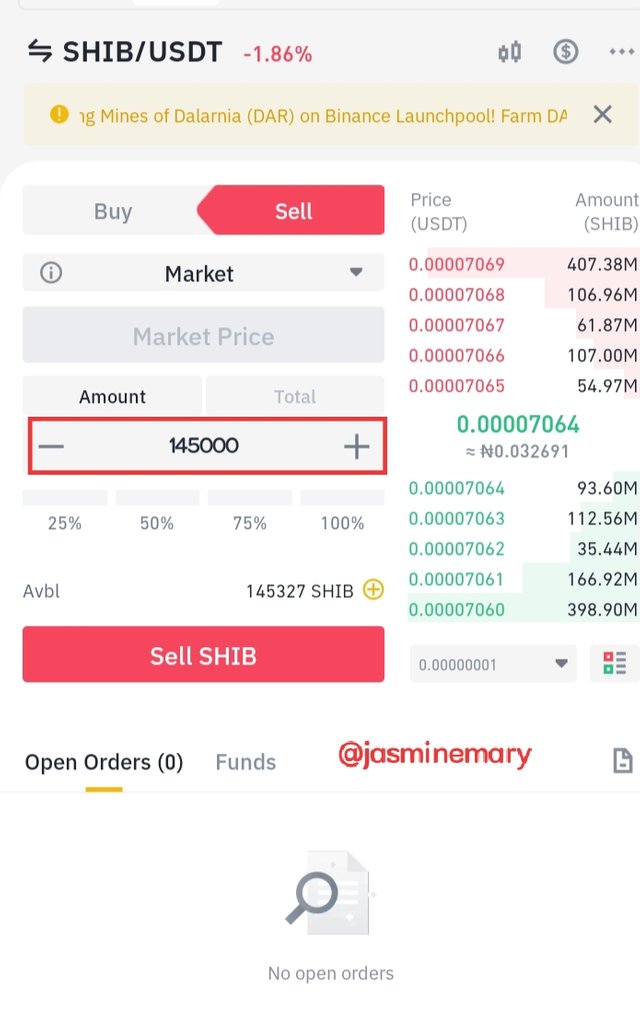
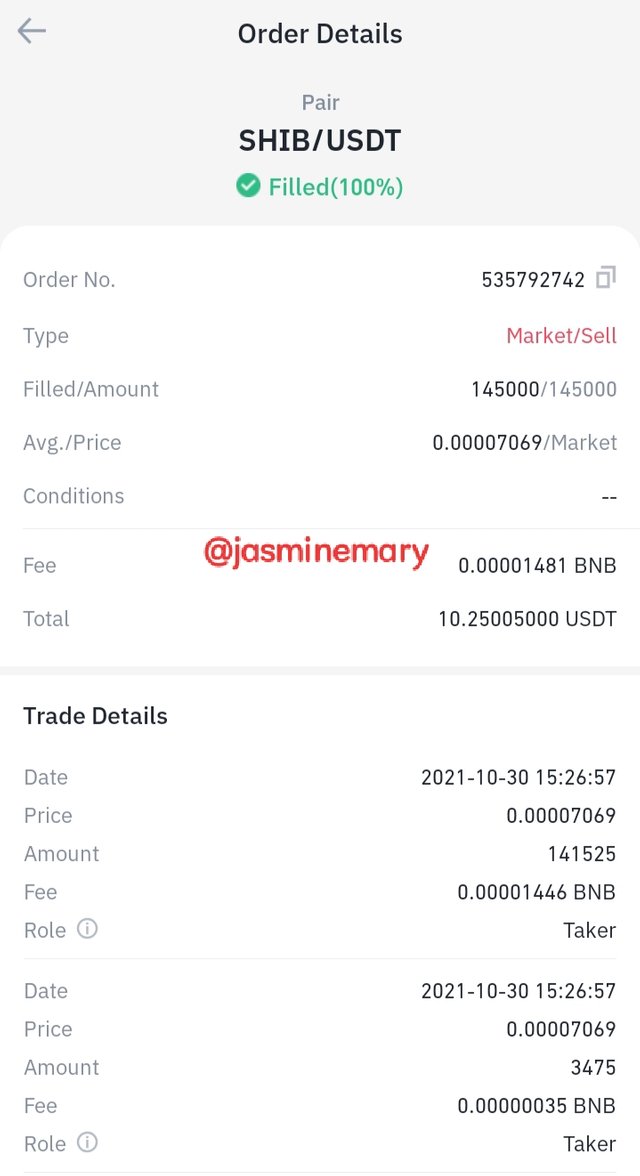
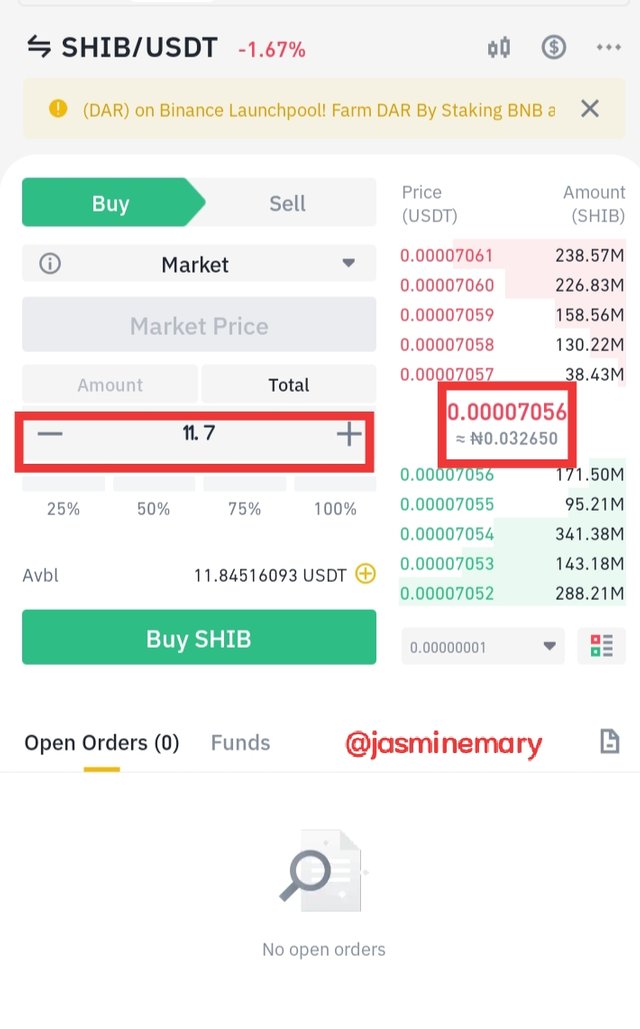
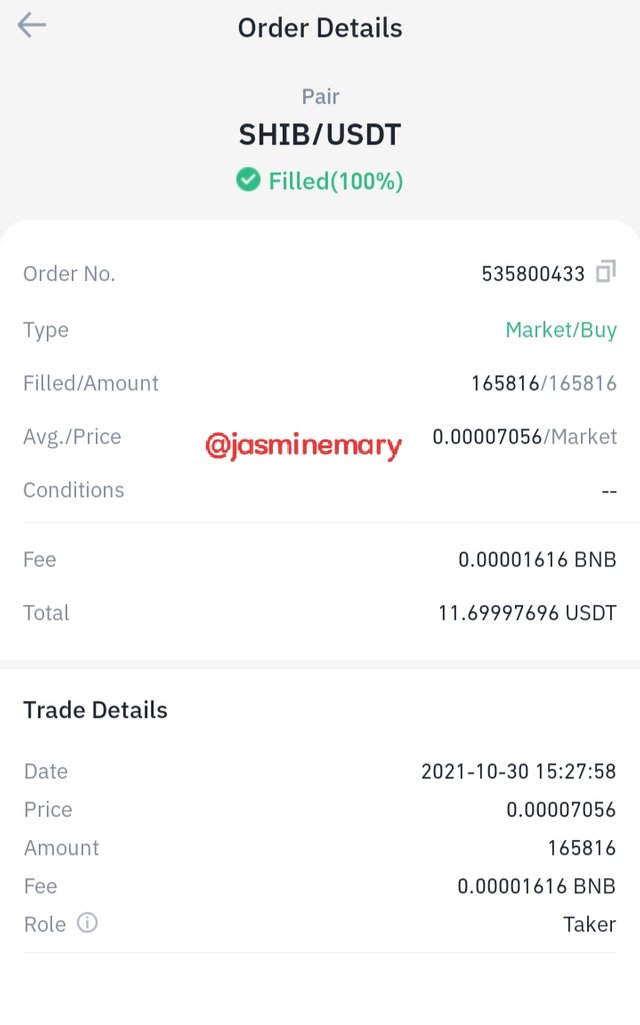
After purchase USDT I then went back to TradingView and see if the price of SHUB is down so that I can purchase SHUB. As soon as I discovered that the price is down, I quickly went straight to Binance Exchange and use 11.69 USD and purchased 165816 SHUB which is shown below.
Conclusion
TD Sequential Indicator is a very good indicator that both beginners and expert can use in trading. All thanks to professor at @reddileep for his wounderfu lesson.
Thanks For Your Time Here........
Best Regards;
Cc:-
@reddileep