Greetings to friend and welcome to my post. In this post, I have discussed about wallet in regards to the question that was asked in Steemit Crypto Academy Challenge.

Canvas
Question 1: Explain the Components of Bollinger Bands
When it comes to technical analysis, Bollinger bands are a very popular analysis tool used by traders to analysis the market which the purpose of using the Bolinger bands is to identify potential buy signals or sell and to gauge market volatility because of how volatile the crypto market is.
Components of Bollinger Bands
There are three components of Bollinger bands which we will be discussing in this post. Talking about these components there are;
- Simple moving average (SMA)
- Upper Band
- Lower Band
Simple Moving Average (SMA):
In Bollinger bands, the simple moving average is usually 20-day moving average, and the length can be adjusted by traders to suit their trading preferences. Simply put, the SMA represents the average price over a set number of days and serves as the mean or the midpoint of the Bollinger bands.
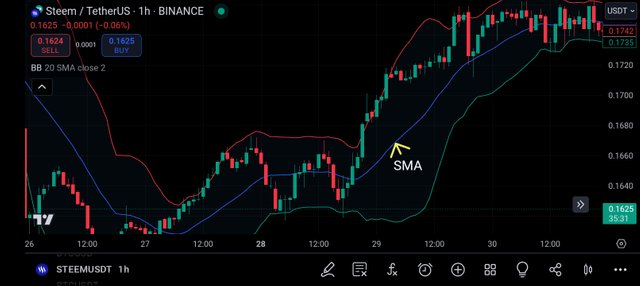
The purpose of the SMA in Bollinger Bands is to help traders identify the direction or trend in the market, which a rising simple moving average, is an indication of an upward trend, whereas a falling simple moving average is an indication of a downward trend, meaning the market is experiencing bearish trend.
Upper Band
This is the band that is plotted above that of the simple moving average which is also set as two standard deviations from the simple moving average (SMA). As a trader, you can adjust the distance to suit your preference if you so wish.
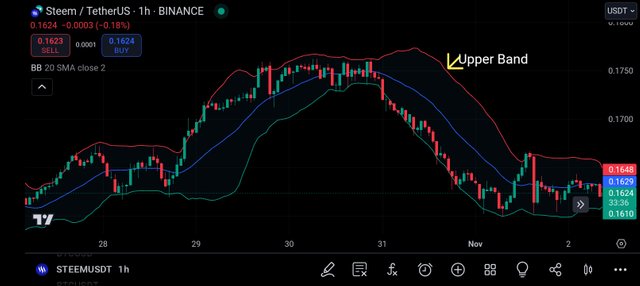
The purpose of the upper is to represent a potential resistance level, where the price of the asset that a trader is analyzing may encounter selling pressure if they touch or approach it. To this when the price of the asset you are trading exceeds or approaches the upper band, it can be a suggestion that the asset is currently overbought signaling a potential pullback or reversal.
Lower Band
This is the band that is plotted below the simple moving average which is also set as two standard deviations from the simple moving average, mirroring that of the upper band.
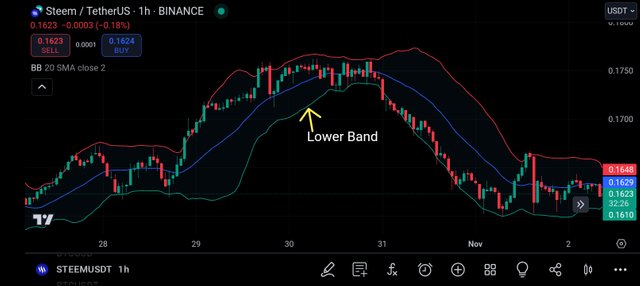
The purpose of the lower band is to serve as a potential support level where the price of the asset you are analyzing using Bollinger bands may find buying interest if they move closer to it. When prices move below the lower band, it means that the price of the asset is experiencing oversold.
How the components works
Based on market volatility, it is the distance between the upper band and lower band that reflects (tells) traders about market volatility. A narrow band suggests lower market volatility, whereas a wider band suggests higher volatility which as a trader we need to take note of.
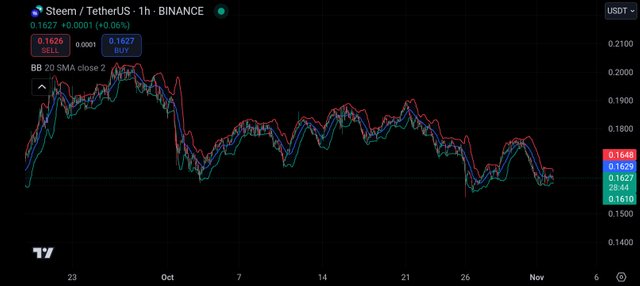
Based on trading signals, the Bolinger bands don't give us a signal about when we are to buy or sell an asset, they only Indicate for us the possible overbought or sold condition of the asset we are analyzing using the Bollinger bands. For example, if the price of STEEM/USDT is moving towards the upper band, Bollinger bands will suggest an overbought signal for us.
Question 2: Analyzing Market Conditions with Bollinger Bands
For me, to analyze market conditions for Steem/USDT using Bollinger bands, we will have to go through the steps that I have shared how and the Bollinger bands would help us to look for the historical price of STEEM/USDT.
Identifying Overbought Conditions.
If the price of STEEM/USDT consistently touches or moves above the upper band, it may suggest an overbought condition for us. This indicates that the price of Steem/usdt has risen significantly and could be due for a correction. Let's take a quick look at the chart below.
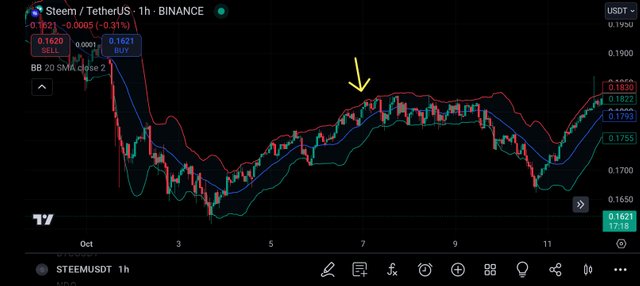
For example, from the chart, suppose the price of Steem/USDT approaches or breaks above the upper band, forming a pattern where multiple candles close near this level, it could be a signal that Steem/usdt is overbought, hinting that a selling opportunity may arise if there is a pullback for STEEM/USDT.
Identifying Oversold Conditions
If the price of STEEM/USDT consistently touches or drops below the lower band, it may suggest an oversold condition for us. This indicates that the price of STEEM/USDT has fallen, i.e. undervalued or it is due for a bounce back.
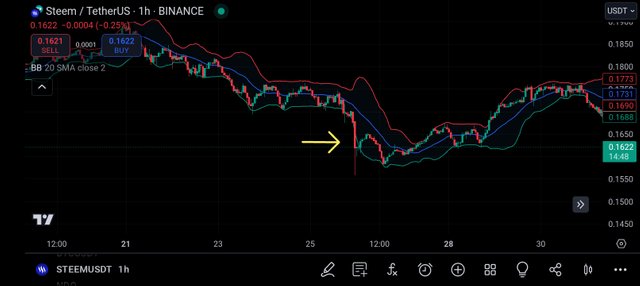
For example, from the chart, if the Steem/usdt price continuously hits or drops below the lower band, it could suggest oversold conditions. Traders can see this signal as a buying opportunity, most especially if there is a price reversal or sign of support level for the price of STEEM/USDT.
Neutral Market Conditions
Now, when the price of Steem/usdt is trading near the middle simple moving average (SMA) 20-day MA without it touching neither the band, it means the market is generally in a neutral state. This suggests that buying and selling pressure are equal (balanced) and is there is no stronger oversold or overbought signal.
For example, if you see that the price of Steem/usdt is consistently moving along the simple moving average (SMA) with low volatility it may suggest indication or consolidation meaning the market is waiting for further direction.
Question 3: Identifying Volatility Patterns with Bollinger Bands
One of the purposes of using Bollinger bands is to assess market volatility in trading the financial markets. The distance between the upper band and lower band is what reflects the love of price volatility.
Expanding Bands
When the band gets widened, it indicates increasing volatility, which usually follows a strong price movement or a breakout. This can be the start of a new trend. To this, when the bands are narrow and squeeze close together, it indicates low volatility. This often follows with a significant price move as the market may be resting before a breakout.
Example
Let's take a look at how Bollinger bands might contract and expand on responding to the movement of price.
Squeeze and Low Volatility Bollinger:
Supposing there is a period where Steem/USD is trading within a narrow range, or sideway, and the Bollinger bands contact forming a squeeze. This narrow bandwidth indicates that the volatility of the market isle, and the market is consolidating.
After the Bollinger squeeze, if the price of Steem/USDT suddenly moves above the upper Bollinger bands, it suggests an uptrend breakout, leading to the bands increasing to accommodate the rise in volatility.
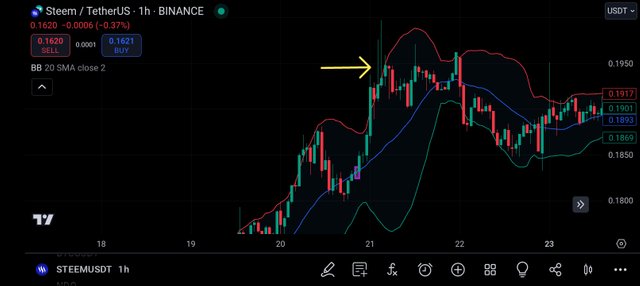
For example, if STEEM/USDT breaks above the upper band with strong volume, the movement may likely cause the bands to expand, signaling the beginning of an uptrend as buyers push the price higher. In summary, a sudden shift from the upper band to the lower band can signal a reversal or change in trend, with the bands expanding as volatility returns to the market.
Question 4: Developing a Bollinger Bands Trading Strategy
For me to create a Bollinger bands trading strategy, I will have to focus on the entry and exit signals of Steem/USDT based on interaction with the bands along with risk management techniques to improve my decision.
Bollinger Bands Trading Strategy
- Buy signal
We can enter (place) a buy position when the price of Steem touches or moves slightly below the lower Bollinger bands suggesting an oversold condition. We also have to look for a bullish reversal signal, like a green candle closing within the bands after prior closing outside them. The confirmation for this can be price movement back towards the middle line or the SMA.
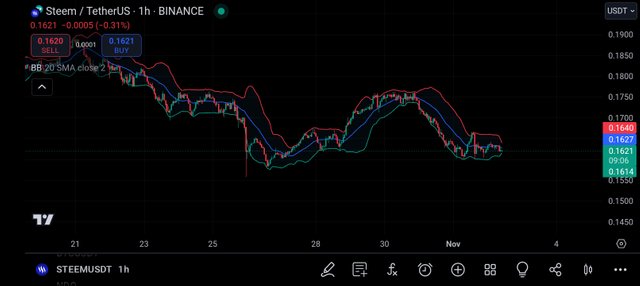
For example, supposing the price of Steem/USDT falls and touches the lower band at $0.1614. If a reversal candle forms a bullish candle pattern or bullish engulfing, may suggest a good time for buying Steem.
Exit Points
- Selling Signal:
We can exit the market or consider to sell position when we have seen that the price of STEEM/USDT touches or slightly moves above the upper Bollinger band, suggesting an overbought condition. A bearish reversal candle is what forms near or above the upper band, suggesting a potential downside momentum move.
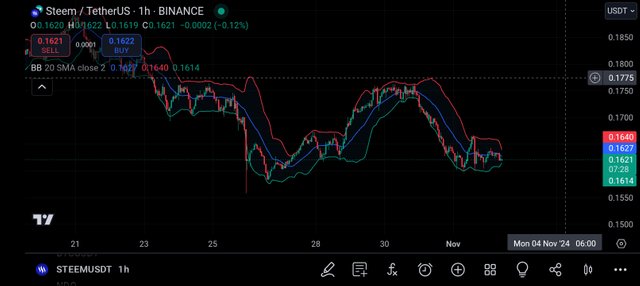
For example, let's assume that STEEM/USDT rises to $0.1775, reaching the upper band. With this kind of rise, a bearish engulfing or shooting star candle pattern is likely to form which can be an exit signal.
- Take profit:
As a trader, you can consider taking your profits when you have seen that the price of STEEM/USDT has reached the middle line of SMA. However, if the trend is strong you can wait for a reversal.
Question 5: Predicting Price Movements with Bollinger Bands
Based on the above chart of STEEM/USDT which we have applied Bollinger bands, we will be looking at the future movement of the price of Steem.
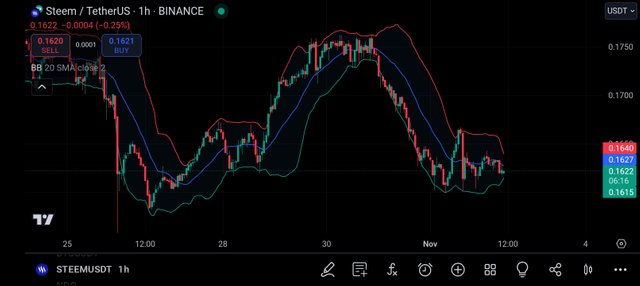
Currently, the price of Steem is trading at the range of $0.1622 which is closing at the lower band which is at $0.1600 suggesting a strong support level to be formed.
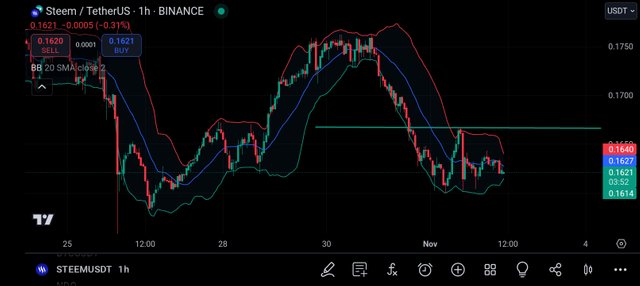
The upper band can be considered the resistance level. Based on what we are seeing currently, the price of the Steem can bounce off the lower band and cross above the middle band 20 period moving average, signaling potential upward movement. A sell signal may show up if the price of Steem approaches or touches the upper band without breaking through suggesting resistance level.
I am inviting my friends; @dave-hanny, @ruthjoe, and @vickyson to also join me.
Cc:-
@kouba01
All the screenshots images are gotten by me from my Tradingview App.
This post has been upvoted by @italygame witness curation trail
If you like our work and want to support us, please consider to approve our witness
Come and visit Italy Community
Downvoting a post can decrease pending rewards and make it less visible. Common reasons:
Submit
Hi @jasminemary,
my name is @ilnegro and I voted your post using steem-fanbase.com.
Come and visit Italy Community
Downvoting a post can decrease pending rewards and make it less visible. Common reasons:
Submit