Hello my beautiful and Handsome looking friend I welcome you to my homework post that was given by professor @utsavsaxena11, on the topic: 'Puria Method Indicative Strategy'. Remain Bless as you read through

Question 1: Explain Puria method indicative strategy, what are its main settings. which timeframe is best to set up this trade and why? (Screenshot needed and try to explain in detail)
Pluria Method Indicative Strategy has been in existence for years. Many traders make use of the Indicator due to its efficiency and simplicity. In a very simple understanding, Puria method indicative strategy is the type of trading strategy that is use for intra day trading by many exchange traders for the so purpose of making little profit. The Puria method indicative strategy consist on three (3) Indicators that are of highly standard; different types of confirming oscillator MACD and moving averages. The strategy of the Puria method Indicative works based on the following trends.
The first strategy a trader need to look for is the signal of the entry point. This signal occur when the slow MA line crosses the fast MA line either downward or upward and the entry points is then verified by the MACD. With this strategy the author that profound has claims in various ways that the strategy is more profitable with his own prefer choice of setting the orders base on the type of pair of currency and time-frames that one is using to trade.
What are its main settings.
The main settings for Puria method Indicative strategy can be setup as;
For MACD I plot it using the following settings;Fast period 15, Signal Period 1 and Slow period 26
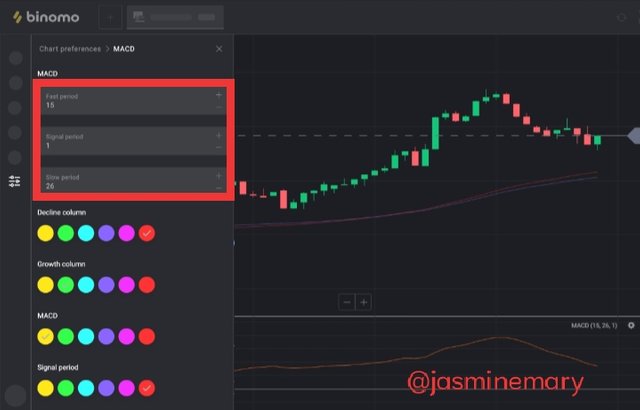 Screenshot gotten from Binomo
Now in terms of using the appropriate settings base on the moving averages the Indicator is set as follows;
First Moving Averages
The first Moving Averages is to be setup using the following settings which I have use Period:75 Weighted type; Color: Red and I then leave the remaining settings unchanged and apply them the way it is.
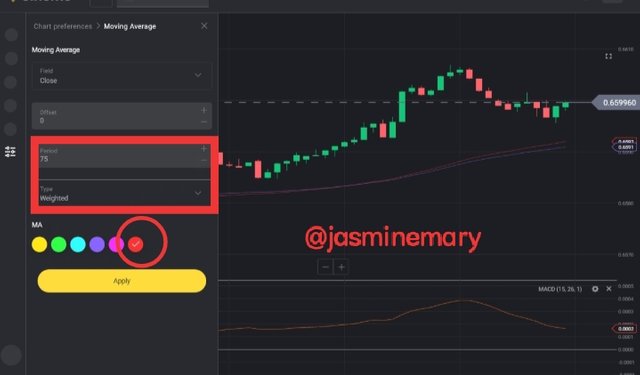 Screenshot gotten from Binomo
Second Moving Averages
I plot the second moving average using the following settings: Period: 85 Weighted type: Color: Purple. The remaining settings can be use as it's which doesn't really need to be modify.
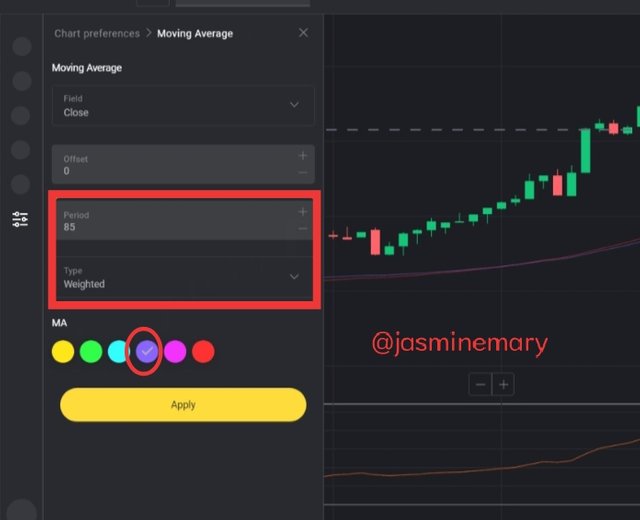 Screenshot gotten from Binomo
Which timeframe is best to setup this trade and why?
The best time timeframe used for the setup of Puria method Indicative strategy is the timeframe that is lower since it's intra-day trading. The use of timeframe like M5, M15 and H1 are the best timeframe that are used for intra-day trading. Although,the strategy works for all timeframe but the aforementioned timeframe are the best timeframe to use since it's can generate several signal within a short period of time which is the best timeframe that is use by traders to make profits.
Question 2: How to identify trends in the market using the Puria method. Is it possible to identify trend reversal in the market by using this strategy? Give examples to support your article and explain them. (screenshot needed)
The best way to identify trend in the market using the Puria method is to follow the trend. The second Moving Averages will help you to identify the trend, and the Moving Averages Convergence Divergence (MACD) will equally help you spot the incipient wave of the trend that is either moving in an uptrend or downtrend.
Identifying an Uptrend (Bullish)
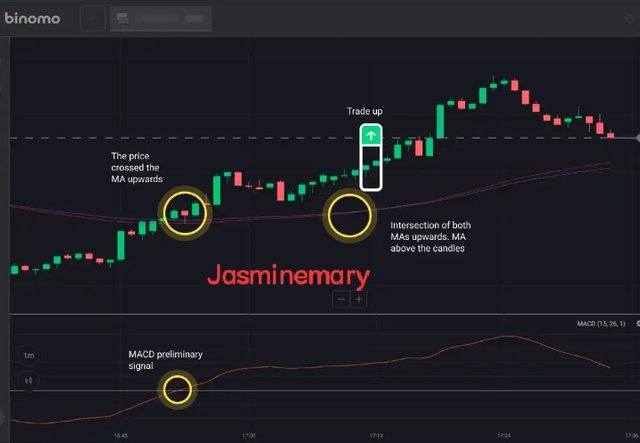 Screenshot gotten from Binomo
For identifying a uptrend (bullish), what you have to do is to look at when the MACD line crosses the zero and moved up. Mostly when it happen like this it just a mere beginner signal, telling when you are to make a trade on the right point, meaning you have to wait for other Indicators signal. In a situation whereby the price of the traded asset has crosses up above the both moving average, it is a confirmation that the bullish trend is okay. As for the moving average it will cross up and fall below the price which is the actual signal as shown from the screenshot.
Identifying a Downtrend (Bearish)
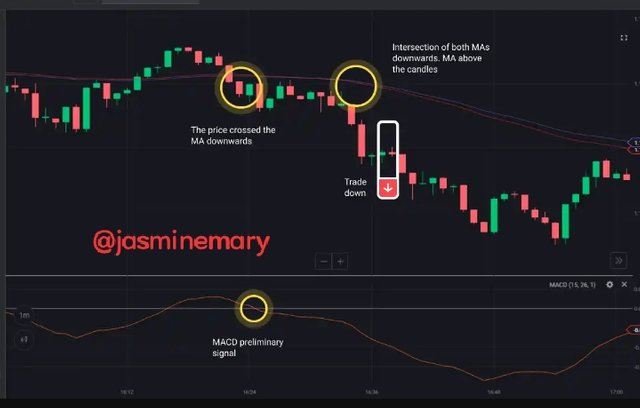 Screenshot gotten from Binomo
For identifying a downtrend (bearish), what you have to look at when the MACD line crosses the zero and move downward. It is also a beginner signal, which means you have to wait for other Indicators to confirm the signal. The moving averages cross down and get higher above the price of the traded asset which is the actual signal that identify that a trend is down.
Iss it possible to identify trend reversal in the market by using this strategy?
Yes it is possible to identify trend reversal in the market using Puria Indicative strategy. In other for you to identify trend reversal,you have to know the current trend of the traded asset in the market.Now let us take a look at the chart below.
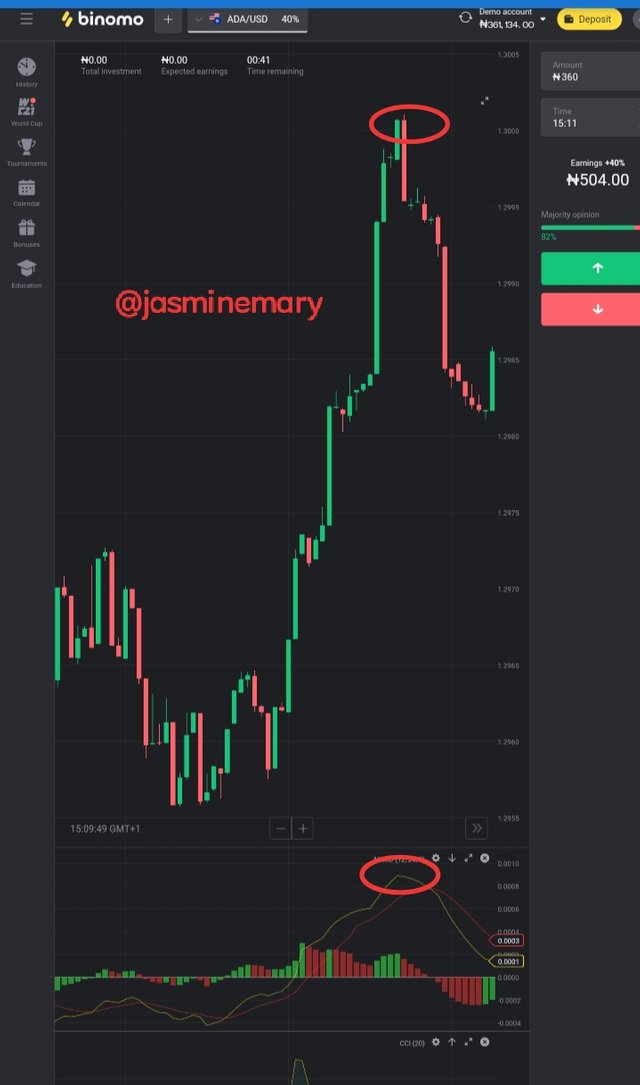 Screenshot gotten from Binomo
From the above screenshot we can see that at first the market was trading in a bullish trend having a higher-high and a higher lows whereby the trend was confirm by the market movement. Looking at the screenshot we can also see that the prices of the traded asset is above the MACD and the moving averages crossed up above the zero, which means the next trend is a bullish trend.
Question 3: In the Puria strategy, we are using MACD as a signal filter. By confirming signals from it, we enter the market. Can we use a signal filter other than MACD in the market for this strategy? Choose one filter(any Indicator having 0 levels) and Identify the trades in the market. (Screenshot needed).
Here I will be using a signal filter Indicator known as Commodity Channel Index (CCI) Indicator on the Puria method. Commodity Channel Index (CCI), is an indicator that is used to know when a trend has change in the market, i.e when a market is Overbought and Oversold which has a zero (0) level that be used in the absent of MACD Indicator. In CCI Indicator, when the line is move across above the zero (0) level, the CCI will gives a signal in the trade and crosses above the +100 like to identify a bullish trend and bring out a buy signal. In the case when the CCI line crosses above the zero level and crosses below the -100 like to give out a sell signal which is a bearish trend.
The below screenshot, show a Buy Signal using Commodity Channel Index (CCI) on Puria Method Indicative Strategy.
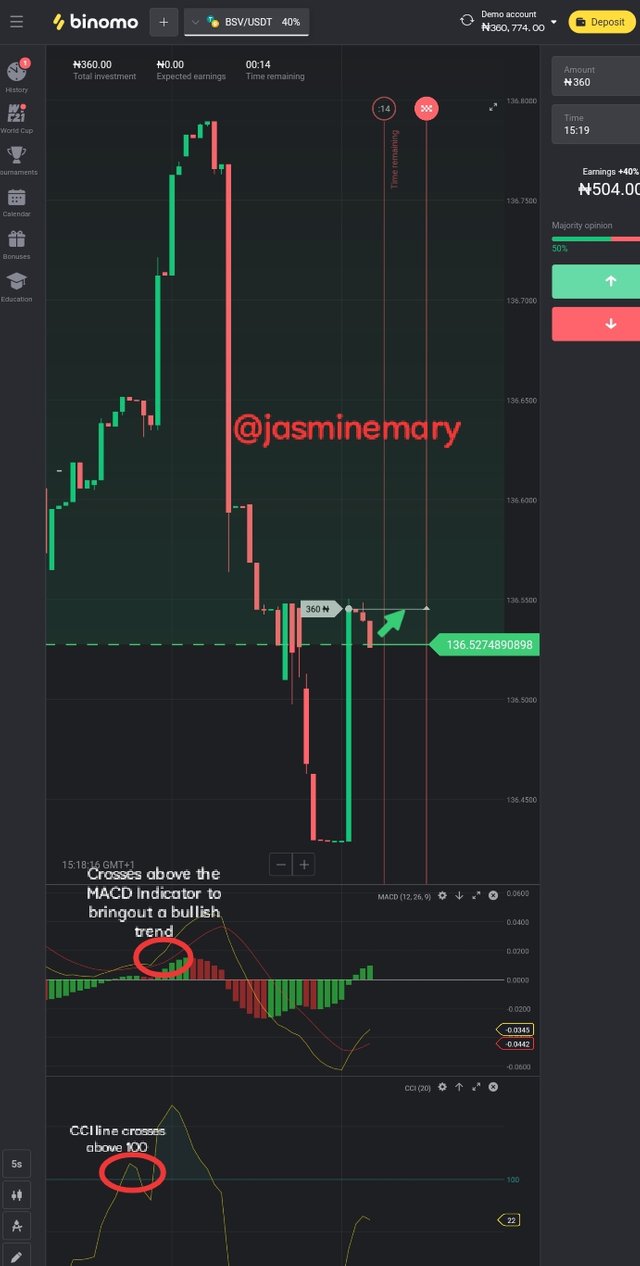 Screenshot gotten from Binomo
Looking at the above screenshot, is a chart of BSV/USDT pair, where the price of the traded asset move cross above the moving average to bring out a buy signal as I have earlier said. The signal was confirms by the CCI Indicator when the CCI line move above the zero (0) levels and crosses above +100 line as shown from the screenshot.
The below screenshot, show a Sell Signal using Commodity Channel Index (CCI) on Puria Method Indicative Strategy.
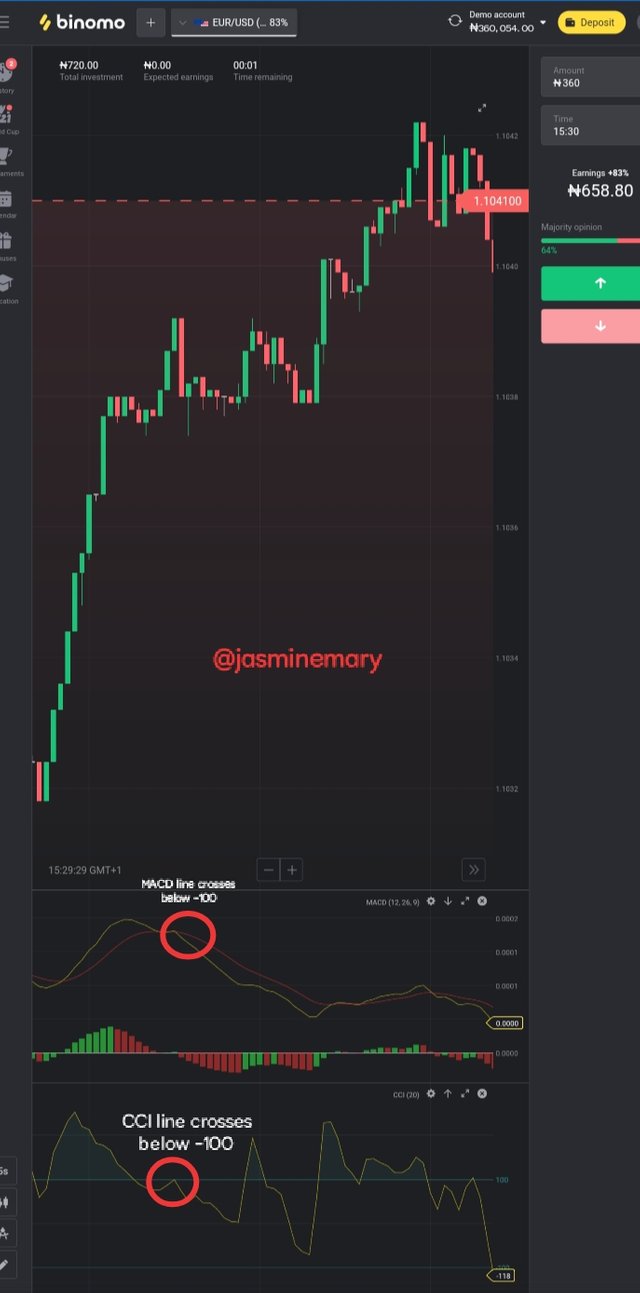 Screenshot gotten from Binomo
Looking at the above screenshot, is a chart of EUR/USD pair, where the price of the traded assets move and cross above the moving averages to bring out a sell signal as I have earlier said. The signal was confirms by the CCI Indicator at the time the CCI line move above the zero (0) levels and crosses below the -100 line as shown from the screenshot below.
Question 4: Set up 10 demo Trades (5 buying and 5 selling ) on 5 cryptocurrency pairs using puria method indicative strategy. Explain any 2 of them in detail. Prepare a final observation table having all your P/L records in these 5 trades.
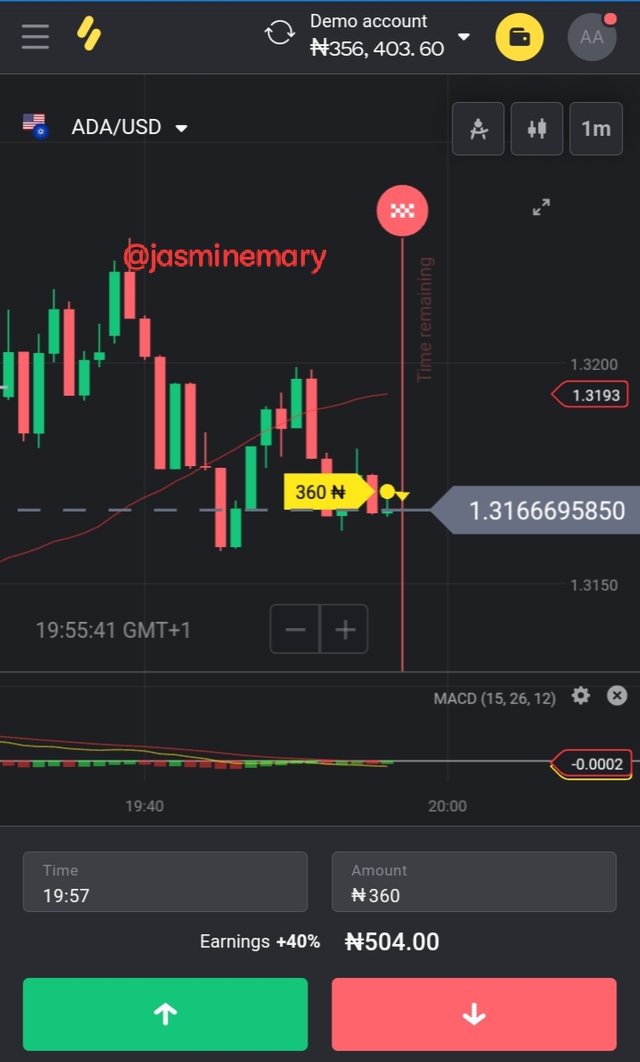
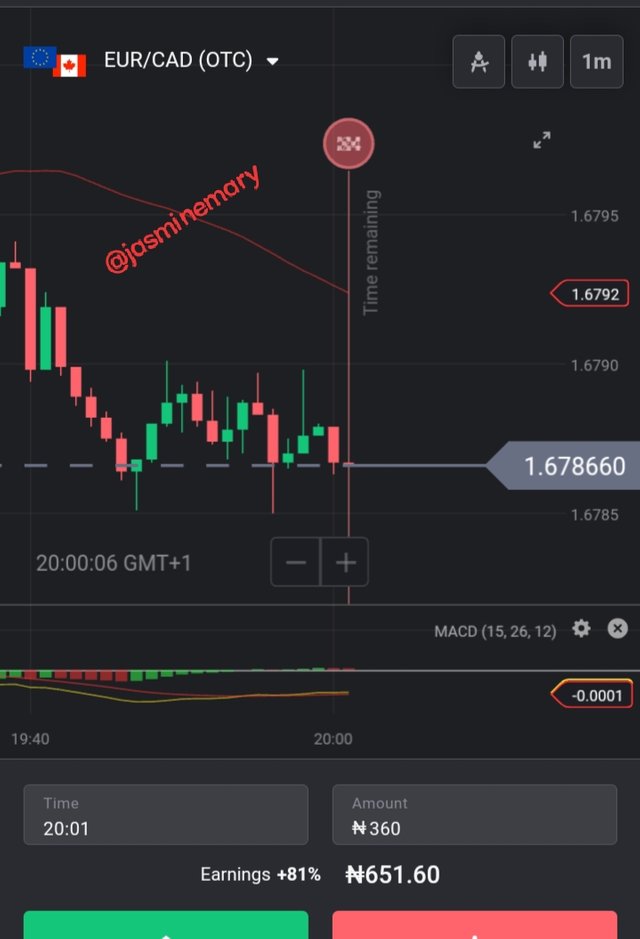
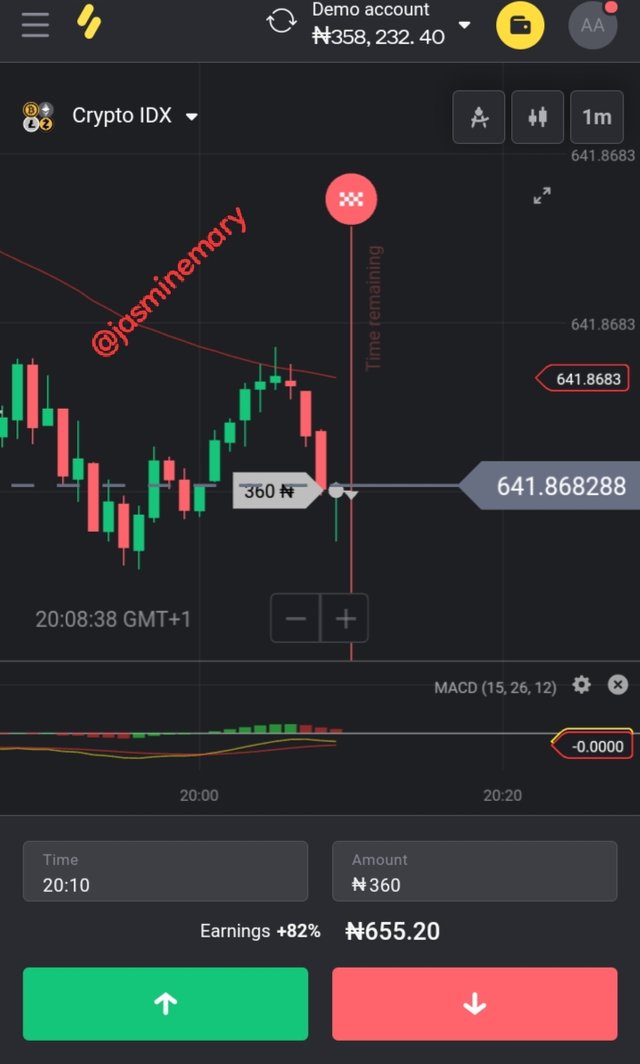
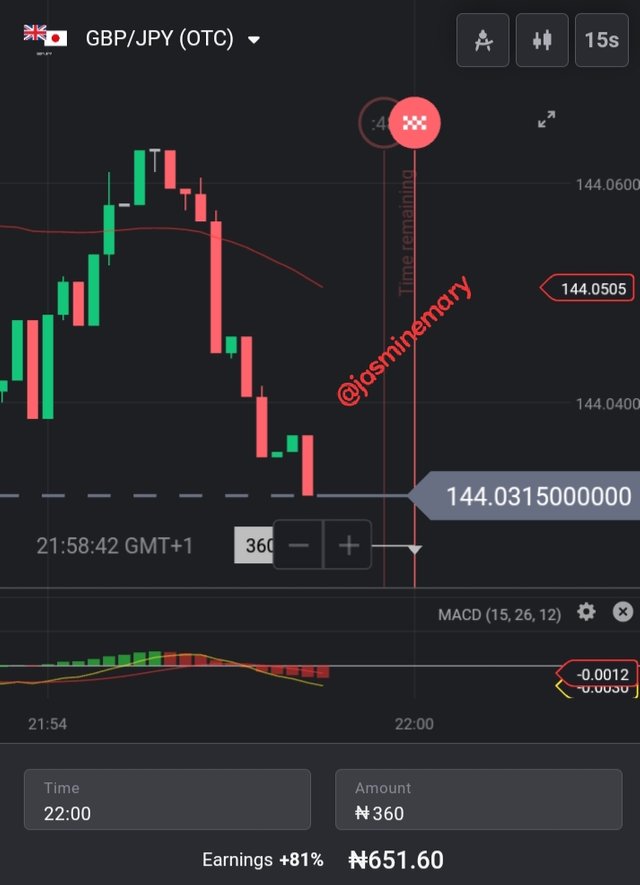
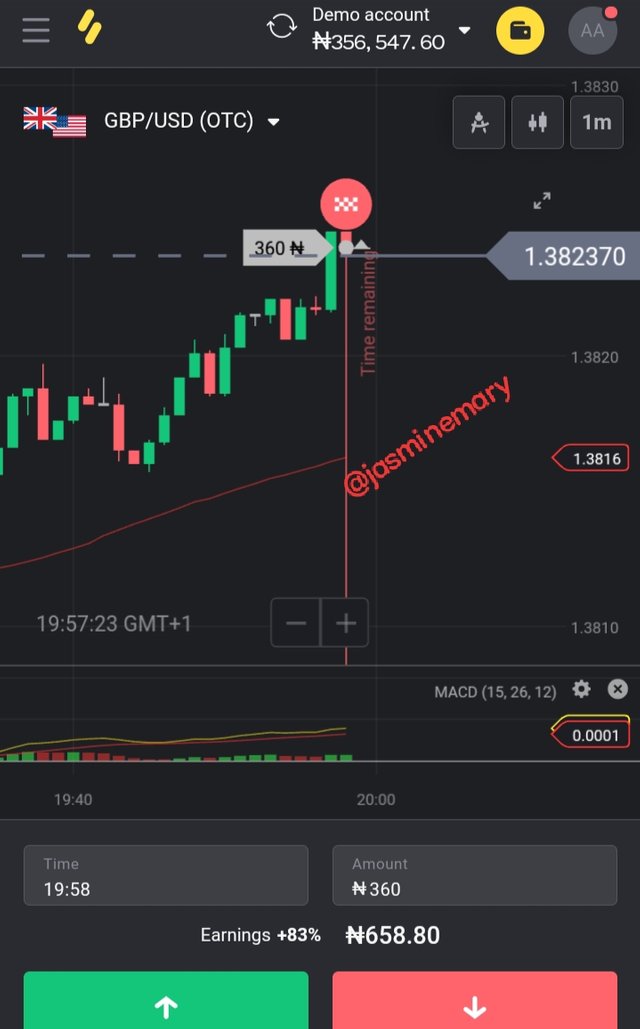
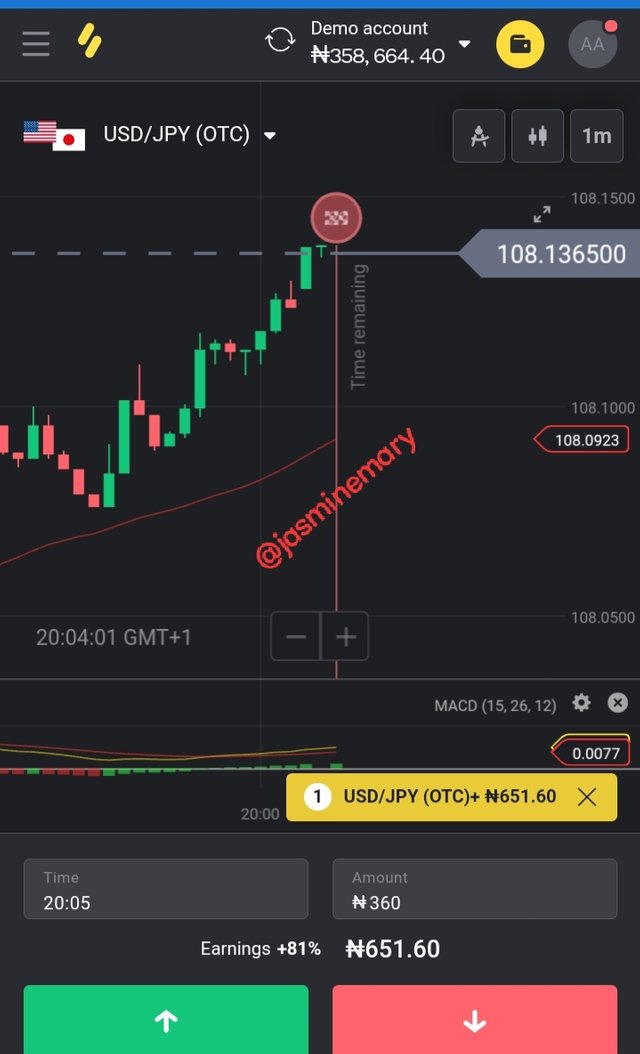
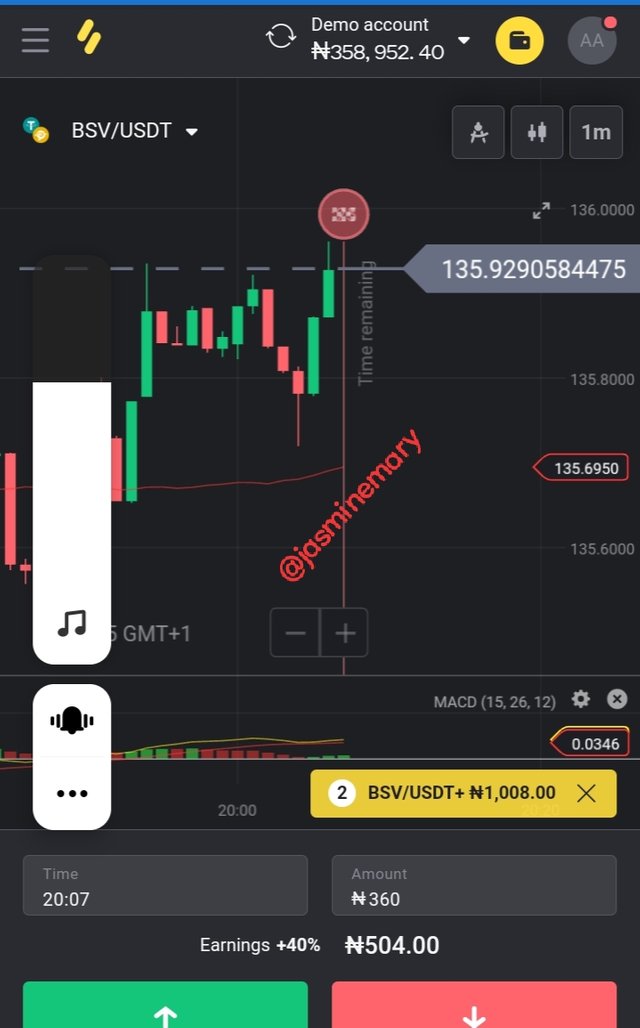
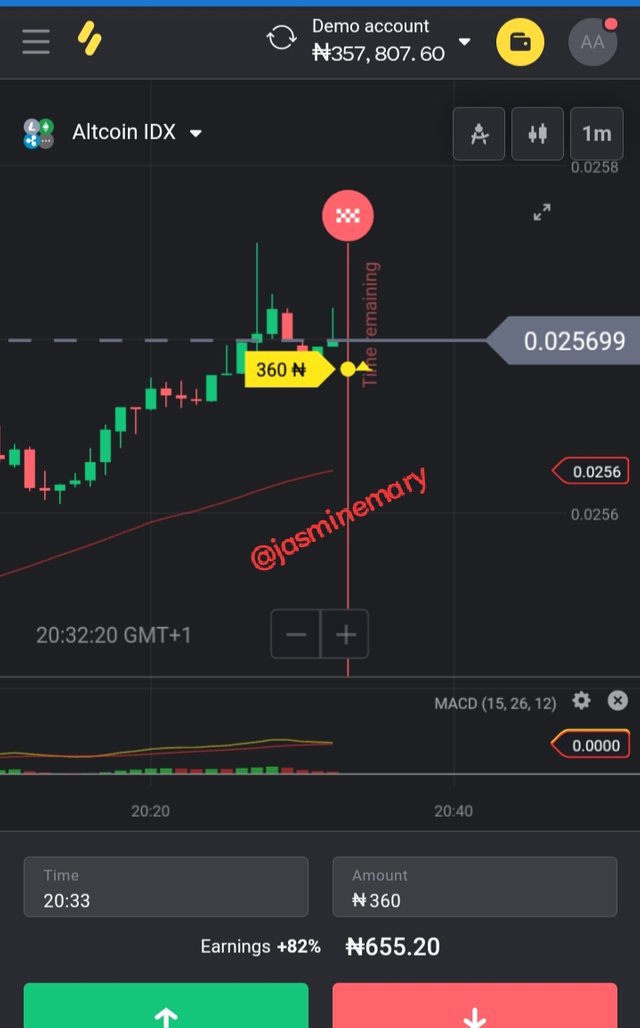
At this point I went to Binomo trade to perform both my sell and buy order as shown from the screenshot below.
Sell Trade
ADA/USD
EUR/CAD
Crypto IDX
GBP/JPY
Buy Trade
GBP/USD
USD/JPY
BSV/USDT
Altcoin IDX
ADA/USD
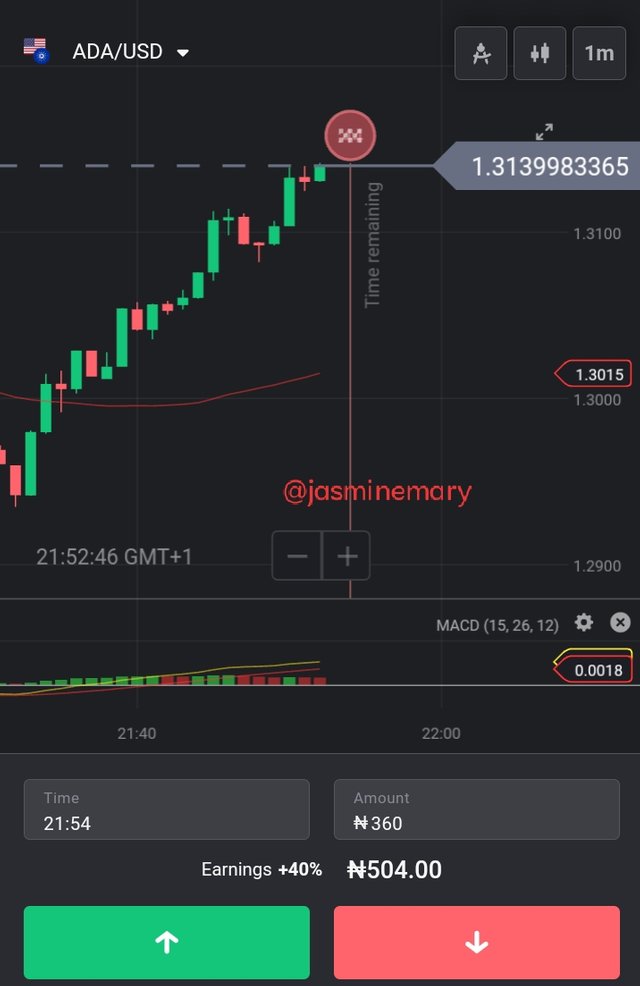
Trade History for Both Buy And Sell.
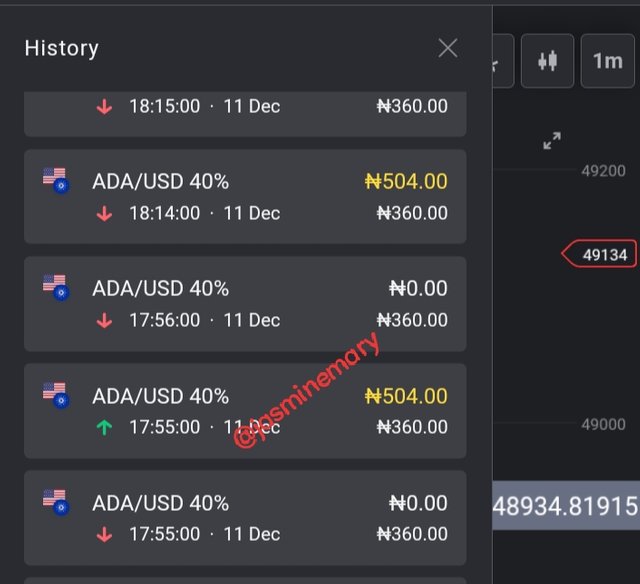 | 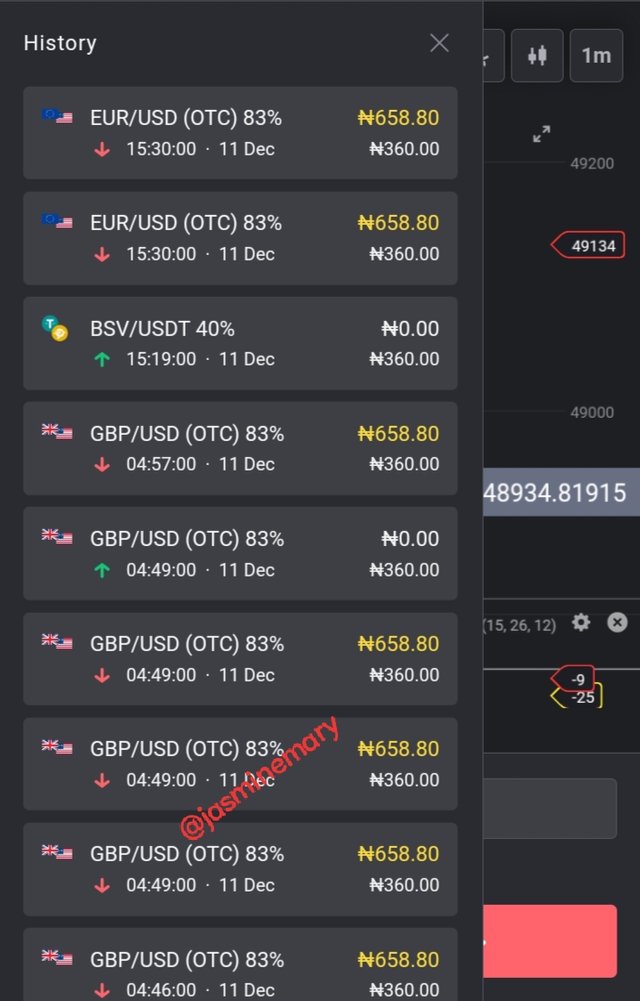 | 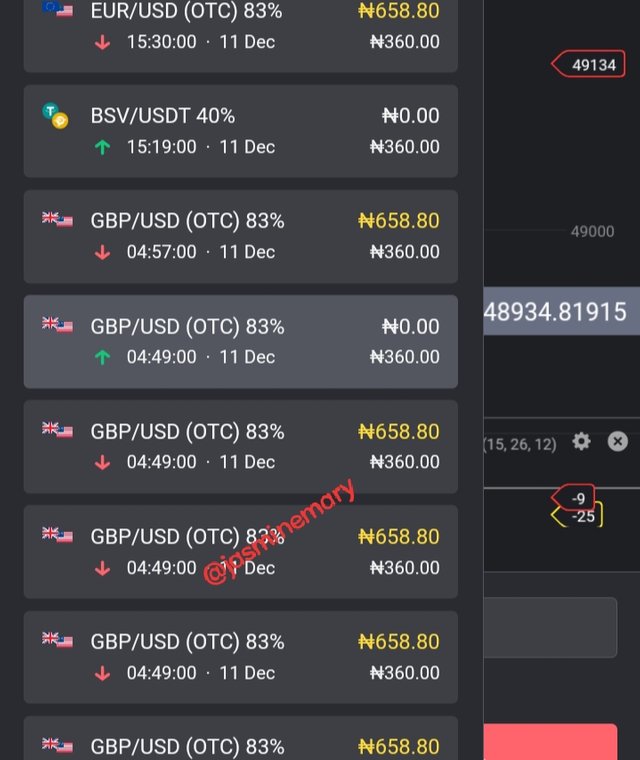 |
|---|
| S/N | Pair | Buying Price | Selling Price | Profit | Loss | Time frame | |
|---|---|---|---|---|---|---|---|
| 1 | ADA/USD | 1.3193 | 504 | 1M | |||
| 2 | EUR/CAD | 1.6791 | 360 | 1M | |||
| 3 | Crypto/IDX | 641.88683 | 655.20 | 1M | |||
| 4 | AUD/CAD | 0.93551 | . | 360 | 1M | ||
| 5 | GBP/JPY | . | 144.6505 | 651.60 | 1M | ||
| 6 | GBP/USD | 1.316 | 360 | 1M | |||
| 7 | USD/JPY | 108.0923 | 651.60 | 1M | |||
| 8 | BSV/USDT 135.6950 | 1008.00 | 1M | ||||
| 9 | Altcoin IDX | 0.0256 | . | 360 | 1M | ||
| 10 | ADX/USD | 1.3015 | . | . | 360 | 1M |
Question 5: You have to make a strategy of your own. It could be pattern-based or indicator-based. Please note that the strategy you make must use the above information. Explain full strategy, including a time frame, settings, entry-exit levels, risk management, and place two demo trades, one for buying and the other for selling.
For the purpose of this homework task, I will be giving a details about a which I call a Simple Crossover Strategy. Let's look at how this strategy can be use.
Timeframe and expiration:
When creating a strategy timeframe is the number one thing to look at. As a trader when you open a trade you need to choose the timeframe and expiration or your trade since is what will help you out to get your profit. The best opinion is for you to choose a short timeframe, that will make you not to wait a long for signal to pop up. The timeframe that you are using should be the best timeframe for the Indicator you're using for instance moving average requires a lower timeframe that is within 1M, 5M and 15M is best used.
Market Ideology:
Market ideology is the principle that takes one to understand a strategy. The market ideology of simply crossover strategy, is for you to understand the buying and selling pressure that confront price movement. This strategy called simply crossover strategy make use of EMA to ascertain the direction of price. When there is crossing of line above the moving average it's an indication that either the market demand has increase or the supply of the asset has increase.
Level of Risk Management
As a trader one of the best way that you can possibly avoid risk is that you should not use all your fund in trading instead start investing in want you can afford to lose. What am trying to say here is that do not use more than 5% of the funds in your trading account for a trade that you're not too sure of. It is recommendable that if you are placing a trade let the ratio of your stop loss and take profit be at 1:1.
Entry Point and Exit Point
As a trader you need to focus on your entry point or buy point signal as to know when the EMA 10 line crosses above the EMA 25, and the exit point or sell signal shows trader when the EMA 10 line crosses below the EMA 25 line.
Indicator to False Signal (Relative Strength Index)
In other to filter false signals relative strength index Indicator is one of the best Indicator that is used to filter out false signal in the market. Relative Strength Index also shows the signal of buy and sell, which involves a single line with oscillator up and down that is shown on the chart. It scale start from 0-100. A scale of 20 below is regarded as an Oversold, whereas the scale of 80 mad above is regarded as Overbought. Literally, this mean that the RSI line crosses 20 and fall below is a sign of oversold buyers strength are more than that of a sellers. In a situation where the RSI line crosses above 80 scale and above it means sellers are controlling the market.
Simple Crossover Strategy
This is a type of trading strategy that make use of line crossing of EMA before either a buy or sell order can be made. As I earlier said, the EMA are of EMA 10, and EMA 25. The buy signal is when the EMA 10 line crosses above that of the EM 25 line. Whereas when the EMA 10 line crosses below that of the EMA 25 line it is a sell signal. With this strategy traders can be able to identify their entry and exit point easily, and when their are to bout asset and sell asset.
Let's consider looking at the Demo Trade of a Buy Order chart below.
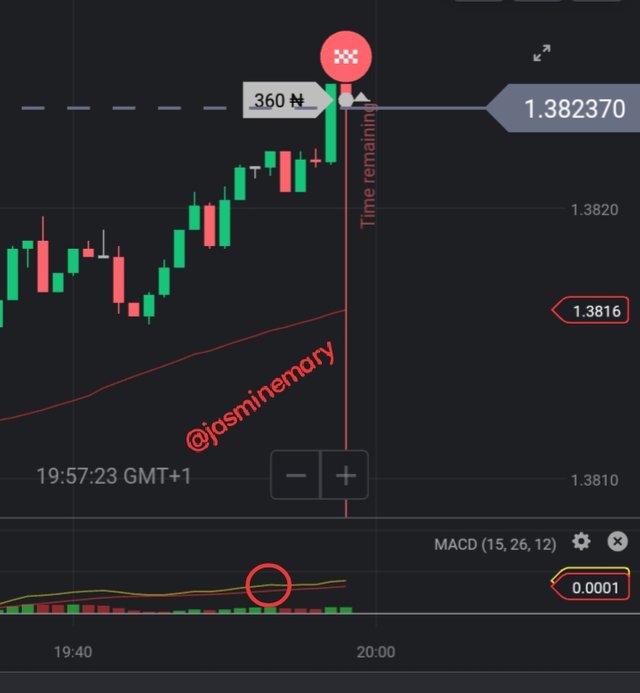
From the above screenshot of the simple Crossover Strategy we can see that the EMA 10 line has crosses that of EMA 25 line which give out a buy signal. The buy signal was confirms by the Relative Strength Index Indicator as its line pass across the zero (0) and head above 70 line to bring out a bullish trend.
Let's also consider looking at the Demo Trade of a Sell Order chart below.
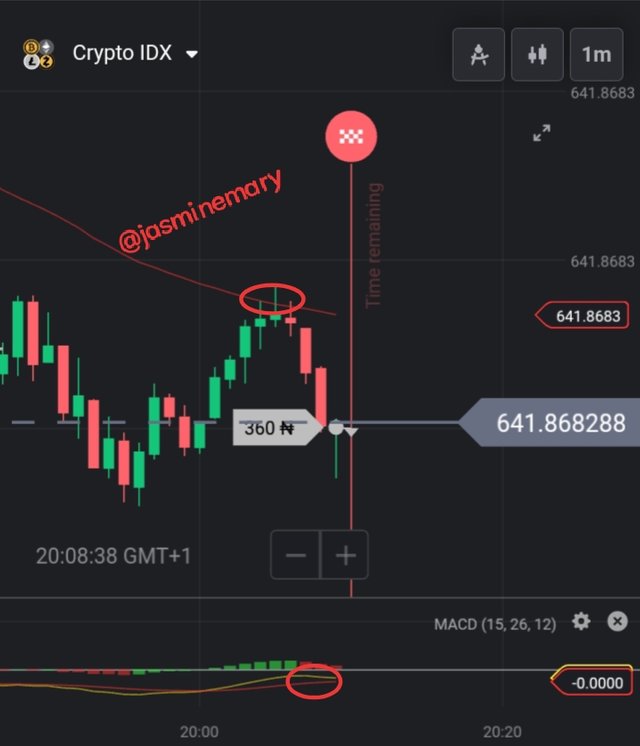
Looking at the above screenshot,we can see that the EMA 10 line crosses below that of the EMA 25 line which give out a sell signal. The signal signal was comfirm by the Relative Strength Index Indicator as its line crosses below zero (0) line.
Conclusion:
Puria method indicative strategy, is and Indicator that worth it name, it is easy to use Indicator that is very profitable in the area of forex trading. Although, the Indicator might be good for some traders and be worst for some traders at the same time. Thanks to professor @utsavsaxena11 on the wonderful lesson which I have learned a lot of strategy concerning trading and also the backbone to this homework post.
Thank You For Your Time Here My Lovely Friend
Best regards;
Cc:-
@utsavsaxena11