Hello Friend You're Welcome To My Homework Post, That Was Given By Professor @allbert On Topic: Trading With Accumulation / Distribution (A/D) Indicator
1- Explain in your own words what the A/D Indicator is and how and why it relates to volume. (Screenshots needed)
The A/D is a short term for Accumulation Distribution Indicator that make used of price and volume to ascertain the trend of a cryptocurrency, stock or any traded asset, through the used of volume and the price of the traded asset. The word accumulation stands for the buying level, whereas distribution is for the selling level of the traded asset. Looking at the meaning of the A/D indicator we can see that it is design to measures the cumulative inflow and out flow of money of a traded asset. The indicator is relates to volume in such a way that it makes use of price of the asset and the inflow of the volume of the asset to determine the trend of the asset.
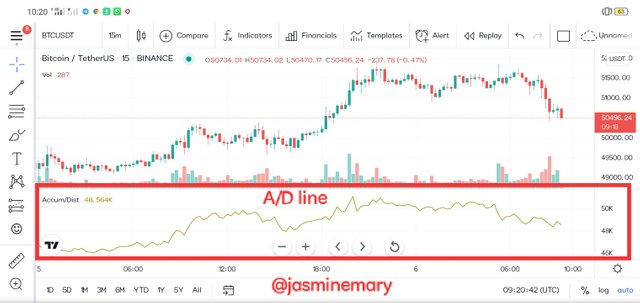
Looking at the above screenshot, is a chart of BTC/USDT showing the accumulated/distribution A/D chart for a period of 15 minutes. The line that is in orange color is the price variation of the asset over the period, whereas the line that is color in grey is the A/D line. Now as we, can see from the screenshot, the accumulation/distribution (A/D) line is relative to the orange color line that is the price variation of the asset. This means that when the price of the asset get low, the A/D indicator line will equally become low vice versa.
2- Through some platforms, show the process of how to place the A/D Indicator (Screenshots needed).
For the purpose of this part, I will be using TradingView platform to show the process of how to place A/D indicator.
- The first, step to take in placing A/D indicator is to visit https://www.tradingview.com and click on chart as shown below.
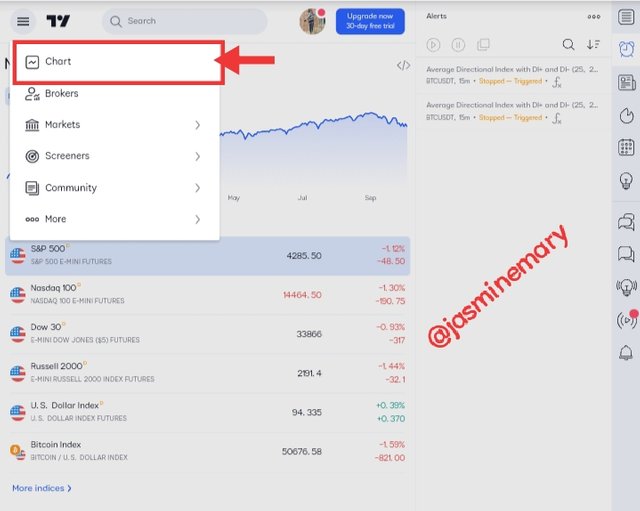
Screenshot gotten from TradingView
- After you have click on the chart you will be taking to the chart Interface, click on fx indicator as shown from the screenshot below.
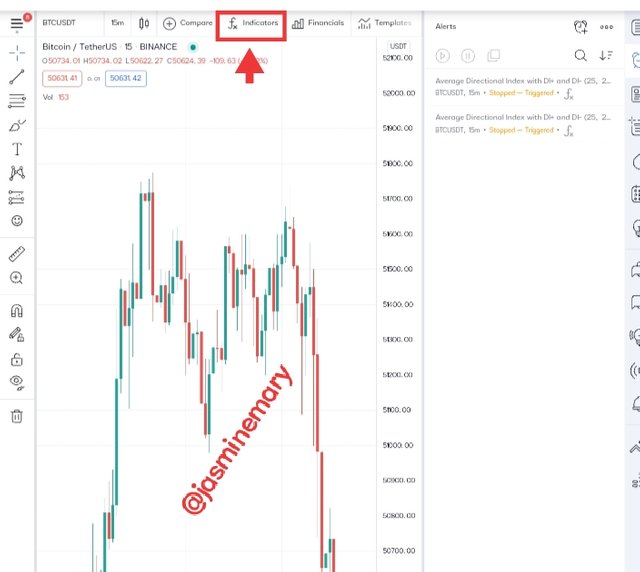
Screenshot gotten from TradingView
- At the search box that appear after you have click on fx indicator, enter the search box and type in Accumulation/Distribution and select it from the search result as shown from the screenshot below.
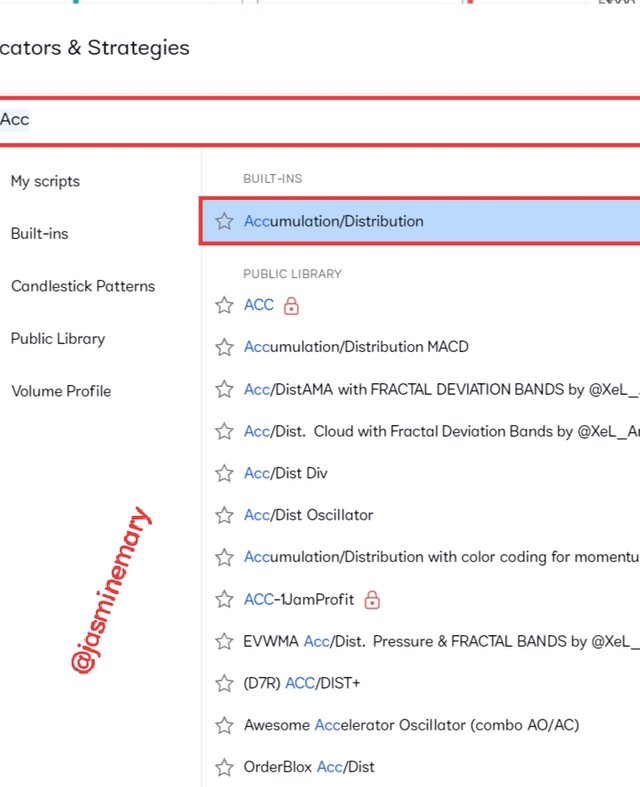
Screenshot gotten from TradingView
- Once you have select the A/D, it will be place on your chart as shown from the screenshot below.
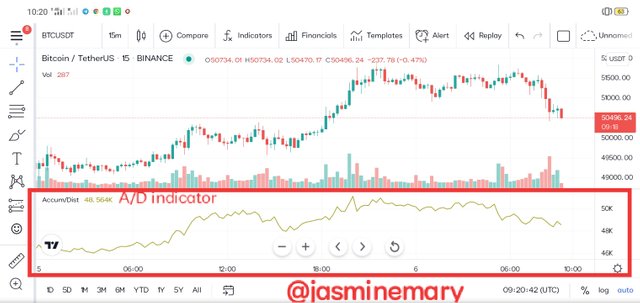
Screenshot gotten from TradingView
3- Explain through an example the formula of the A/D Indicator. (Originality will be taken into account).
The formula below is what is use in calculating the A/D indicator, and I will be explaining how we can simply use it.
Now looking at the above, we can probably see a word like money flow multiplier (MFM) in the formula. In calculating the A/D indicator using the above formula, we must first, calculate the money flow multiplier (MFM) before calculating the money flow volume (MFV) and the A/D indicator. Now let take at quick look at the explanation below.
Firstly, the MFM is to be calculated when we have first calculate the low price and closing price. After calculating this the next thing is to minus the closing price from the high price and then minus the two figures and divide it with the high price minus (-) low price.
Secondly, after you have calculated the MFM the next step is to Calculate the MFV by multiplying it with the volume of the period.
Thirdly, is to calculate the A/D line by adding the prior A/D line together with the current period MFV. Note that by doing this the A/D usually fluctuate between the range of +1 and -1.
4- How is it possible to detect and confirm a trend through the A/D indicator? (Screenshots needed)
To be able to detect and confirm a trend through the A/D indicator, we need to ensure that the chart we are using is a trending chart.
If the price of the asset and A/D indicator rise together and get higher,the uptrend is much likely to continue to increase. But in a situation where the price of the asset and the A/D indicator fall together and get low the downtrend would be much likely to continue. Although, in a specific period where the A/D indicator is falling down, the selling which is the distribution might likely go higher meaning their is a downtrend breakout ahead. But in a case where the A/D indicator is rising, the buying which is the accumulation might be higher meaning there is a uptrend breakout ahead.
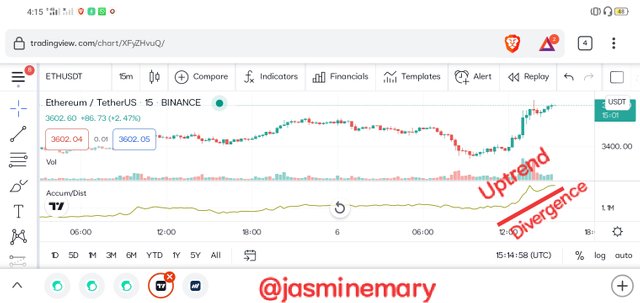
Screenshot from TradingView
Another best possible way to detect and confirm A/D indicator is through divergence. Divergence is the direction of the A/D indicator that moves against the direction of the price of the asset. If the price of the asset that is traded continues to move in uptrend while the A/D indicator moves in downtrend,the uptrend might then likely to stall. But in a situation where the price of the asset that is trade moves in downtrend while the A/D move in uptrends, the downtrend might likely to stall. This implies that divergence of indicator help us to know when our profit is ready to be take and also when we are to buy or sell asset with the trend change that it shows us.
5- Through a DEMO account, perform one trading operation (BUY or SELL) using the A/D Indicator only. (Screenshots needed).
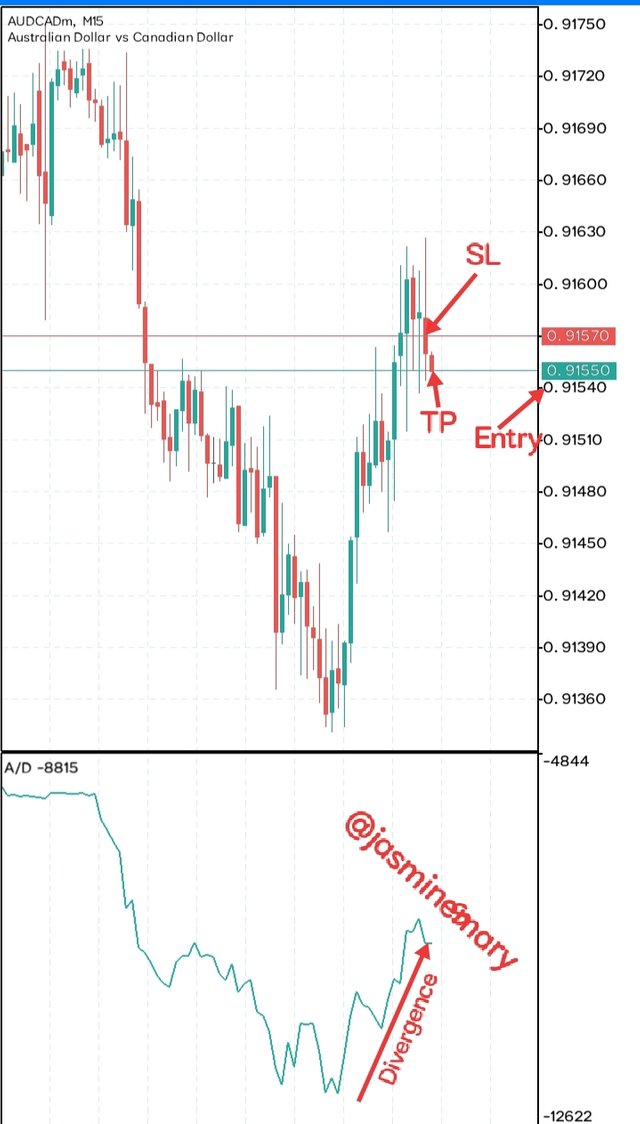
Screenshot from Metatrade5
At this point, I make use of Metatrade5 trading Platform to place a sell order. My Take profit is at the range of $0.91550, Sell stop is at the range of $0.91570 and market entry is at $0.91540. Here the order was placed using 15 Minutes period. The ratio used in placing this order was 1:1 risk/reward ratio.
6- What other indicator can be used in conjunction with the A/D Indicator. Justify, explain and test. (Screenshots needed).
The other indicator that can be used with the A/D indicator is based on individuals concept. Although, the best indicator to use with A/D indicator is the On-Balance Volume (OBV) indicator that determine the cumulative volume flow of the asset that is traded. The OBV and A/D indicator are 99,% similar indicators when they are place on a chart which we can see from the screenshot below.
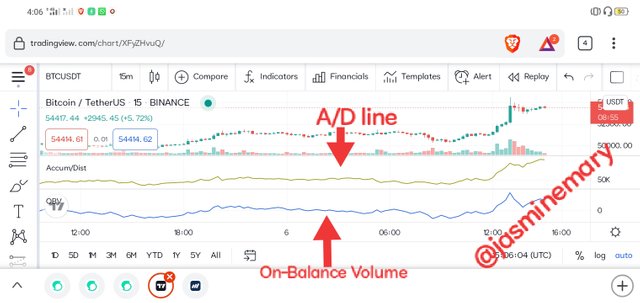
Screenshot from TradingView
Now looking at the screenshot above, we can see that the both indicator are volume indicator with a slight different in them. The reason to why I said the OBV indicator is best used in conjunction with the A/D is that the OBV is determine to know if the current closing price is higher or lower than the previous closing price of which the A/D indicator doesn't focus on previous closing price instead it makes use of a multiplier to determine the closing price within the range. Therefore, in a nutshell, it means that OBV is one of the indicator that can be used in conjunction with A/D indicator.
Although another indicator that can be best used in conjunction with the A/D indicator is double exponential moving averages.Also indicator like Relative Strength Index (RSI) and Stochastic oscillator can be used in conjunction with the A/D indicator. The reasons why these aforementioned indicator can be used in conjunction with the A/D indicator is that there can be used to find divergences just as A/D indicator is used in finding divergence.
.webp)