
Introduction
Season greetings to you my lovely and good Steemians. I wish you & your loved ones a very happy new year and more years to celebrate. Today in this post we are going to be looking at a technical Indicator that is used to measure price momentum across three different varying timeframes which is called Ultimate Oscillator. The topic was given by professor @utsavsaxena11 on his homework lesson that was center on Trading with Ultimate Oscillator. Let's get started with our discussion below.
Question 1:
What do you understand by ultimate oscillator indicator. How to calculate ultimate oscillator value for a particular candle or time frame. Give real example using chart pattern, show complete calculation with accurate result.
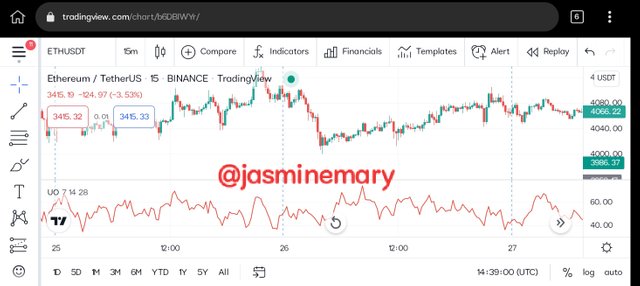
The word Ultimate Oscillator Indicator is a technical Indicator that is used by traders to measure the price momentum of an asset across three varying timeframes. The problem with Ultimate Oscillator Indicator is that after a decline in price or a rapid rise in price,a false divergence trading signals can be form.For instance, after a rapid rise in price,a bearish divergence signal may come up by itself,although price will continues to rise.
Ultimate Oscillator Indicator was developed by Larry Williams in 1976 as an attempts to put this into correction by using more than one timeframe in its calculation rather than using one timeframe that is used in other momentum oscillators.
How to calculate ultimate oscillator value for a particular candle or time frame.
In order to be able to calculate ultimate oscillator value for a particular candle or timeframe,is for we to first know that the ultimate oscillator have three steps that are use when calculating ultimate oscillator value for a particular candle or timeframe. Before we started let's know that the parameters that is uses is 7, 14 and 28.
Step 1: Is for you to defend your two variable; Buying Pressure and True Range. The Calculation will be calculated using the formula below.
Buying Pressure (BP) = Close - Minimum (Lowest between Current Low or Prior Close)
True Range (TR) = Maximum (Highest between Current High or Prior Close) - Minimum (Lowest or Prior Close)
Step 2: The figure in step 1 will be use by Ultimate Oscillator fo over three (3) time period.
A7 = (7 P BP Sum) / (7 P TR Sum)
A4 = (14 P BP Sum) / (14 P TR Sum)
A28 = (28 P BP Sum) / (28 P TR Sum)
Where:
A7 = Average7
7 P = 7 Period
28 P = 28 Period
BP = Buying Pressure
TR = True Range
Step 3: Is to calculate your Ultimate Oscillator using the formula below.
Ultimate Oscillator (UO) = 100 × [(4 × A7) + (2 × A14) + A28] / (4 + 2 + 1)
Example using a Chart Pattern
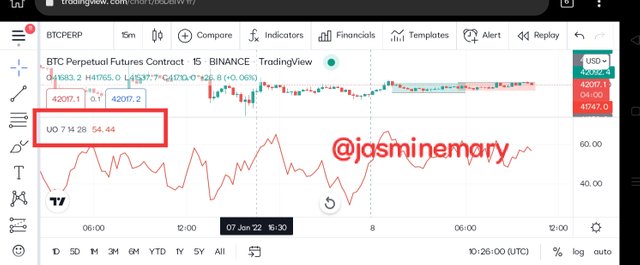
| n Period | Buying Pressure (BP) | True Range (TR) |
|---|---|---|
| 1 | 99.8 | 36 |
| 2 | 38.1 | 11 |
| 3 | 85.1 | 41.2 |
| 4 | 62.1 | 52.3 |
| 5 | 69.6 | 60.1 |
| 6 | 48.3 | 70.2 |
| 7 | 48.2 | 72.3 |
| Total | 451.2 | 343 |
| n Period | BP | TR |
|---|---|---|
| 8 | 55.7 | 58.6 |
| 9 | 47.2 | 30.9 |
| 10 | 36.5 | 67.5 |
| 11 | 60.3 | 48.1 |
| 12 | 48.3 | 53. |
| 13 | 61.4 | 63.4 |
| 14 | 30.2 | 20.2 |
| Total | 339.6 | 293.6 |
| n Period | BP | TR |
|---|---|---|
| 15 | 42.1 | 30.1 |
| 16 | 21.2 | 11.3 |
| 17 | 53.4 | 39.3 |
| 18 | 45.3 | 28.7 |
| 19 | 51.2 | 45.3 |
| 20 | 31.2 | 30.1 |
| 21 | 25.5 | 24.2 |
| 22 | 47.2 | 32.3 |
| 23 | 50.1 | 28.3 |
| 24 | 25.2 | 30.1 |
| 25 | 34.6 | 29.7 |
| 26 | 40.1 | 28.2 |
| 27 | 10.9 | 12.8 |
| 28 | 22.5 | 28.8 |
| Total | 500.5 | 399.2 |
- A7 = 451.2 / 343 = 1.315
- A14 = 339.6 / 293.6 = 1.156
- A28 = 500.5 / 399.2 = 1.253
Ultimate Oscillator (UO) = 100 × [(4 × A7) + (2 × A14) + A28] / (4 + 2 + 1)
UO = 100 × [(4 × 1.315) + (2 × 1.56) + 1.253] / (4+2+1)
UO = 100 × (5.26 + 3.12 + 1.253) / 7
U0 = 1.376 × 100 = 137.6
From the above Calculation it seem my data is wrong seen is given me 137.6 instead of 54.44.
Question 2 :
How to identify trends in the market using ultimate oscillator. What is the difference between ultimate oscillator and slow stochastic oscillator.
In order for you to identify trends in the market using ultimate oscillator, is not that difficult. We all know that wether it's forex trading or crypto trading,that whenever buying Pressure is strong, that is when our trends will rises, but when it is weak or trends will falls. That is how it's in ultimate oscillator, when the buying pressure of the traded asset is strong, the ultimate oscillator rises and when the buying pressure of the traded asset becomes weak, the ultimate oscillator will falls. In indentifying trends in the market using ultimate oscillator, is for you to know that when ultimate oscillator has fall below 30 range, is an indication that the traded asset is oversold, and the market will rise up and show up trend in the market. This mean that too much buying pressure causes price to rise which make ultimate oscillator to be moving in an uptrend.
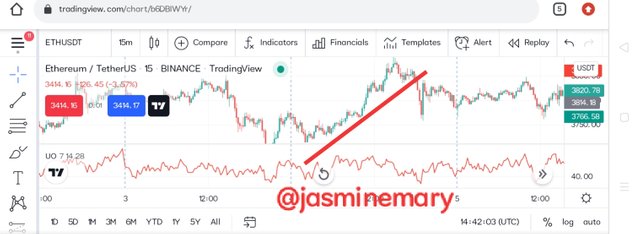
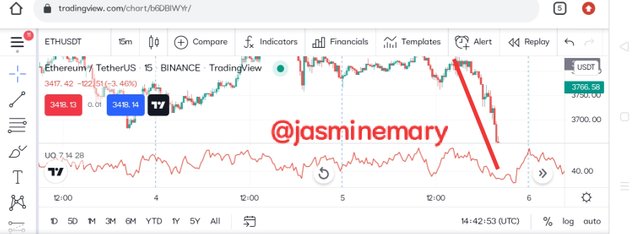
In other way round, in other for to be able to identify downtrend in the market using ultimate oscillator, is also not that difficult, but the opposite of how the uptrend is been identify. When selling pressure is strong ultimate oscillator will falls, but when selling pressure is weak ultimate oscillator will rises. In the downtrend, you will see that the ultimate oscillator has rise above 70 range which is an indication that the traded asset is overbought, which is telling you that ultimate oscillator start from overbought and will begin with a downtrend. This means that too much selling pressure has causes the price of the traded asset to fall, which make ultimate oscillator to be moving in a downtrend.
What is the difference between ultimate oscillator and slow stochastic oscillator.
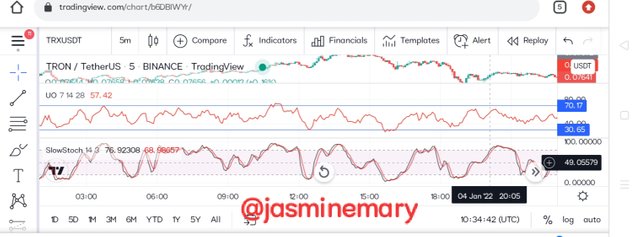
| Ultimate Oscillator | Slow Stochastic Oscillator |
|---|---|
| Ultimate Oscillator make uses of three (3) separate time-frames or periods | Slow Stochastic Oscillator make use of just one (1) |
| Signal line is not included in Ultimate Oscillator but can literally be added | Signal is included in Slow Stochastic Oscillator |
| In ultimate oscillator the range of 30 below is oversold and 70 above is overbought | In slow stochastic oscillator the range of 20 below is oversold and 80 above is overbought |
| In ultimate oscillator few signals are generated | in slow stochastic oscillator too many signals are generated |
Question 3:
to identify divergence in the market using ultimate oscillator, if we are unable to identify divergence easily than which indicator will help us to identify divergence in the market.
Here I will be discussing on how to identify divergence in the market using ultimate oscillator.Our Identification will be based on bullish divergence and bearish divergence. Let's get started below.
Bullish Divergence
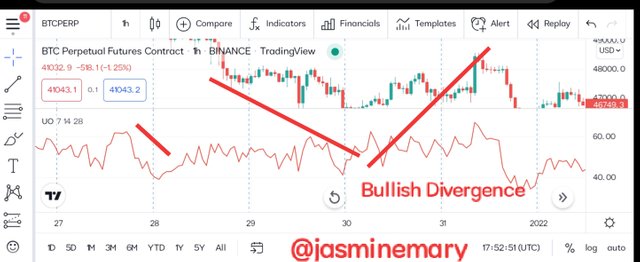
To Identify Bullish divergence in the market using ultimate oscillator. In the bullish divergence the price of the traded asset forms a lower low whereas ultimate oscillator then makes a higher low.The low is the divergence in the market should be at the range of 30 below. Ultimate Oscillator breaks above the high of the Divergence in the market. This logically mean that the price of the traded asset would be in a downtrend, while ultimate oscillator would be in an uptrend.
Bearish Divergence
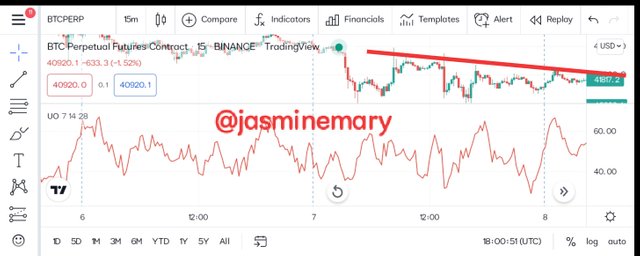
To identify a Bearish in the market using ultimate oscillator. In the bearish divergence the price of the traded asset forms a higher high whereas ultimate oscillator makes then makes a lower high. The high is the divergence in the market and should be at the range of 70 above. Ultimate Oscillator falls below the low of the divergence in the market. This logically mean that the price of the traded asset would be moving in an uptrend, while ultimate oscillator would be moving in a downtrend.
Question 4:
what is the 3 step- approach method through which one can take entry and exit from the market. Show real example of entry and exit from the market.
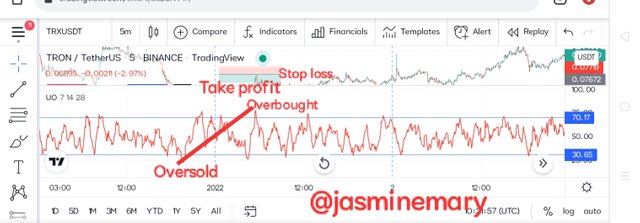
The use of divergence (overbought) and non divergence (oversold) can be use to take our entry and exit from the market. Now I will be discussing on the approach that we can use to take entry and exit from the market.
Buy Entry:
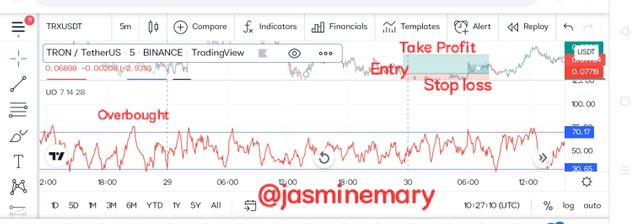
Firstly, a bullish divergence has to be form. The formation is when the price of the traded asset makes a lower low but the Indicator is still making a higher low.
Secondly, the low of the divergence should be at the range of 30 below. This implies that the divergence begins from oversold condition and is most likely to result in an uptrend.
Thirdly, the ultimate oscillator breaks above the divergence high which is the point between the two lows of the divergence.
Sell Entry:
The following approach is what we can use to take a sell entry and exit from the market.
Firstly, a bearish divergence has to be form. The formation is when the price of the traded asset makes a higher high but the Indicator is still making a lower high.
Secondly, the first high of the divergence should be at the range of 70 above. This implies that the divergence begins from overbought condition and is most likely to result in a downtrend.
Thirdly, the ultimate oscillator falls below the divergence low which is the point between the two highs of the divergence.
Question 5:
What is your opinion about ultimate oscillator indicator. Which time frame will you prefer how to use ultimate oscillator and why?
My opinion, about ultimate oscillator Indicator is that since ultimate oscillator Indicator is more suitable for technical analysis due to how it make use of more standard momentum oscillators, and take of calculation to strengthen weakness. My opinion her is that by using ultimate oscillator Indicator which brings about multiple timeframe is a way of reducing false signals on our trade. Base on my observation, I came to find out that ultimate oscillator Indicator should not applied as a stand alone signal on our trade.
Ultimate oscillator Indicator make uses of three different timeframe in its calculation which are; 7, 14 and 20 periods. The timeframe that I prefer is the shorter timeframe which is 7 period. The reason to why I prefer the 7 period is that shorter timeframe is weighted most in the calculation than the longer timeframe which are 14 and 15 periods that has the least weight in the calculation.
Question 6:
Conclusion
Ultimate oscillator Indicator is just like any other type of Indicator that is use for trading, but ultimate oscillator Indicator it seem to be somehow different from them as it involves strength and weakness. Ultimate oscillator Indicator make use of three different timeframe which are 7, 14 and 20 periods in its calculations. The timeframe that is higher has the least weight whereas the shorter timeframe has more weight in its calculation compared to the longer timeframe.
I sincerely, thank professor @utsavaxena11 for his wonderful lesson which has make me to understand a lot about ultimate oscillator and how to perform its calculation. Honestly, I found his lesson so interesting and recommendable for everyone to read and understand before he/she can perform a trade.
Thank you my dear friend for your time here.....<
Best Regards;
Cc:-
@utsavaxena11

Hi.. @jasminemary , Thank you for participating in the 8th Week steemit crypto academy course in its 5th season. You have completed the talaterand according to your work your rating is given in the table below:
Review:
The author shows her clear understanding of the ultimate oscillator in which she tried to analyze each and every single part of the oscillator. EXCELLENT. The author also tries to demonstrate a complete and correct calculation of the UO valuebblurry she fails to deliver the correct answer. hence we considered it as incorrect soltion.
Both buying and selling trades are correct and both divergence indications are also correct. Your opinion about this indicator is valid and very useful.
Author shows clear understanding about the difference between ultimate oscillator and ss indicator, good job.
your screenshots are blurr and poorly edited focus while performing such assignments.
Final word:
Good!!!
Your homework task is correct and all the answers are complete. Thank you for taking part in the week 8 steemitcryptoacademy. We look forward to reading your next work.
Sincerely, @utsavsaxena11
Downvoting a post can decrease pending rewards and make it less visible. Common reasons:
Submit
Thank you so much professor
Downvoting a post can decrease pending rewards and make it less visible. Common reasons:
Submit