Una vez más quiero saludar a la Steemit Crypto Academia, y al profesor @stream4u, quién nos ha brindado una excelente clase acerca de otra técnica de gran utilidad para la lectura de gráficos y así poder crear buenas estrategias para nuestros negocios dentro del crypto comercio.

PIVOTAR Es la palabra que se emplea para describir cambios de dirección partiendo de un punto en específico. En baloncesto, cuando un jugador cambia su dirección girando sobre un pie de apoyo, a esto le llaman pivote.
En el caso del trading, el PIVOTE es el cambio en el precio de un activo, sea creciente o decreciente, y esto deja en la gráfica, ciertos picos que, los analistas, utilizan para poder predecir el mercado y poder planificar estrategias para el ingreso o salida del mismo.
A lo largo del tiempo, surgieron varias concepciones de esta técnica.
.jpeg)
Los números según esta teoría, sigue un patrón basado en el punto más bajo, y la suma porcentual de ambos, nos da cómo resultado la siguiente sucesión, luego la segunda más la tercera nos daría la cuarta. Ejemplo: 0,1,1,2,3,5,8,13,21....

En este caso, Ken Woodie, actúa sobre los gráficos utilizando el indicador CCI, sin tomar en cuenta, casi en lo absoluto, el precio del activo. Woodie utiliza además una parte de MOTIVACIÓN PSICOLÓGICA.
Existen otras técnicas de predicción basadas en los Puntos de Pivote, la de Camarilla que toma en cuenta 8 niveles de resistencia y soporte. El de Tom Demark, el cuál no es como tal un pivote pero sirve para anticipar los máximos y mínimos del mercado.
En este post me baso en el método Tradicional que tomando en cuenta concepto básico de pivote, y los distintos movimientos en el mercado, los estudiosos y analistas que generaron esta teoría pudieron dar a los distintos pivotes las siguientes clasificaciones:
- Pivote Principal:
Este es el punto medio del Gráfico de aquí parte el análisis de los soportes y las resistencias. Marca el valor 0
- Soportes:
Estos definen los rebotes en el precio cuando el precio baja por un momento y luego vuelve a subir. En el método Tradicional existen 3 soportes ( S1, S2, S3).
- Resistencia:
Es el tope máximo en el cual el precio del activo intenta superar pero no puede, por lo tanto se denota un rebote hacia abajo. Al igual que los soportes la resistencia tiene tres tipos ( R1, R2, R3).
Existen formulas matemáticas para poder calcular los puntos de pivote, y dependiendo de cada teoría la fórmula puede variar. Aunque hay formas automáticas para estos cálculos, les dejaré las distintas fórmulas que existen.
- Método Tradicional:
P.P = (H + L + C) / 3
R1 = P + (P – L)
R2 = P + (H – L)
S1 = P – (H – P)
S2 = P – (H – L)
En las que H es el valor máximo, L es el valor más Bajo y C es el Cierre.
- Método Woodie:
PP = (H + L + 2 X C) / 4
R1 = (2 X P) – L
R2 = P + H – L
S1 = (2 X P) – H
S2 = P – H + L
- Método de Tom Demark
Si Cierre < Apertura, entonces X = H+2×L+C
Si Cierre > Apertura, entonces X = 2xH+L+C
Si Cierre = Apertura, entonces X = H+L+2xC
Nuevo Máximo = X / 2 – L
Nuevo Mínimo = X / 2 – H
- Método Según Camarilla:
R4 = (H – L) X 1.1 / 2 + C
R3 = (H – L) X 1.1 / 4 + C
R2 = (H – L) X 1.1 / 6 + C
R1 = (H – L) X 1.1 / 12 + C
S1 = C – (H – L) X 1.1 / 12
S2 = C – (H – L) X 1.1 / 6
S3 = C – (H – L) X 1.1 / 4
S4 = C – (H – L) X 1.1 / 2
Al ver las gráficas, podemos notar que al pasar del tiempo, los coin cambian de tendencia. Esto, debido a varios factores sociales o psicológicos, los cuales hacen que las personas se interesen en invertir más en algún activo, en el cambio a la alza, o que vendan los activos en caso del cambio a la baja.
Estos cambios de tendencia en los activos son definidos como comercio en inversa, es aquí donde los inversionistas deben presentar atención para así poder realizar inversiones o un Stop Loss para protegerse de las pérdidas.
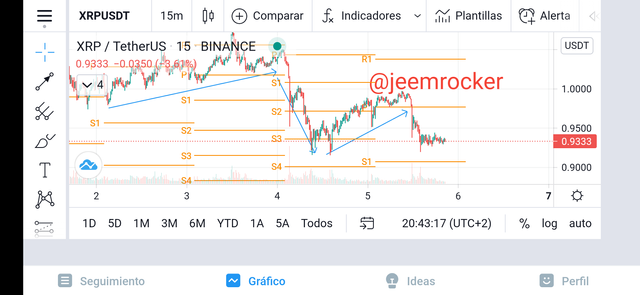
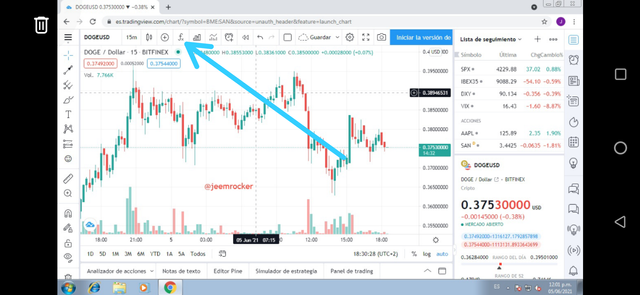
- Paso 1
Seleccionamos la opción Función (Fx)
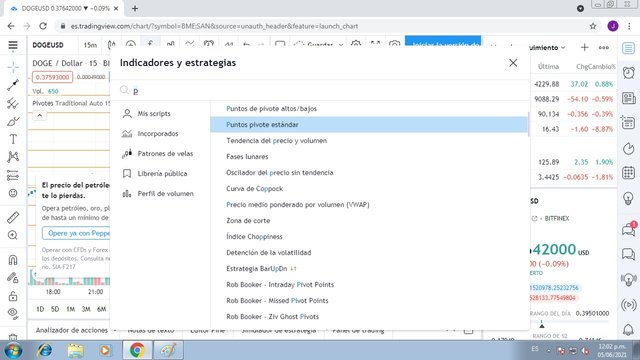
- Paso 2
En la opción " Patrones de Vela " seleccionamos, PUNTOS DE PIVOTE ESTANDAR.
- Paso 3
Una vez que aparezcan los Puntos de Pivote en el gráfico, buscamos la opción de configuración. En entrada de datos, dejamos la configuración predeterminada, Pivots Timeframe, queda en Automático y Numbers of Pivots Back queda en 15
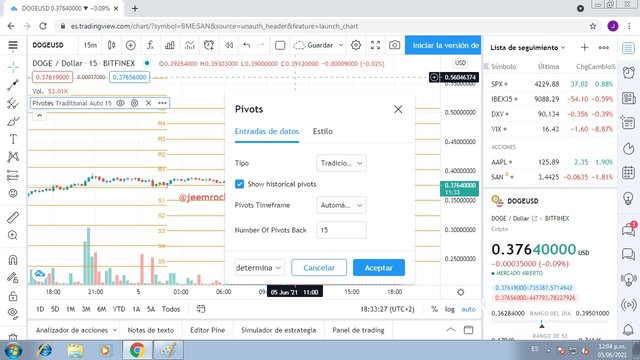
- Paso 4
En la opción Estilo, seleccionamos el número de S/R que queremos que aparezcan, el grosor de la linea y el color para diferenciarlos.
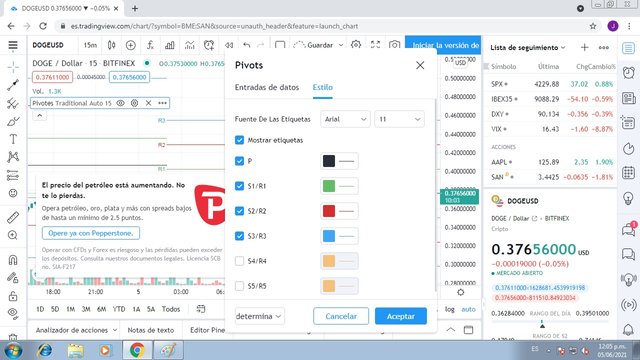
De esta forma obtendremos los puntos de pivotes que consideremos necesarios para nuestro análisis.
Un error común es creer que este método es 100% efectivo. Al ser una técnica basada en la predicción, se debe tomar en cuenta que los valores no son 100% seguros, y aunque es un método altamente comprobado, también hay un margen de error del que se debe estar al pendiente.
Por lo que es necesario practicarlo hasta entender bien el comportamiento y de esa forma el margen de error se irá haciendo más chico.
Otro error es no leer bien las tendencias y no anticipar las rupturas, de esa forma es fácil que un novato crea estar siguiendo una tendencia que luego cambie en una ruptura y traiga pérdidas.
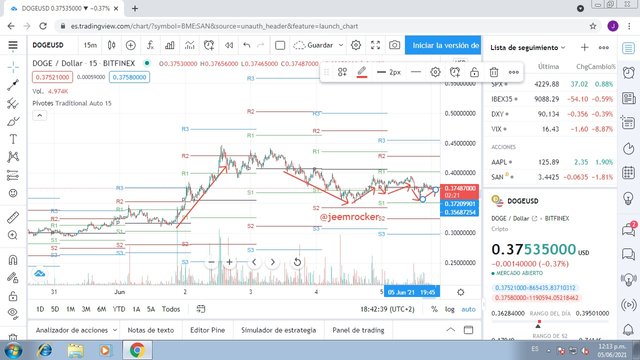
Vemos como desde el 31 el Dogecoin viene con una tendencia alcista moderada y no es sinó hasta el 2 de junio cuando partiendo del Pivote Principal, su alza toma un giro importante llegando hasta R2, alcanzando un precio de más de 0,400$, invitando a los inversionistas a invertir. Esto coincide que el twit de Musk tomando en cuenta, este coin para su marca Tesla Motors.
El precio se mantuvo oscilante hasta el día 3 de junio cuando el comercio se invierte y el mercado cae hasta S2, lo que supone varios Stop Loss y ventas de acciones.
Desde mitad del día 4 hasta el dia 5, podemos apreciar una recuperación en el capital, el cual sobrepasa el Pivote Principal habiendo un nuevo cambio de tendencia aunque corto.
En la actualidad el indicador nos muestra una tendencia al alza marcando un Precio de 0,375 $.
He elegido el Dogecoin debido a su popularidad, posicionándose en el puesto Nro 6 de tendencia según Coinmarketcap y tiene un mercado de 48.412 millones de Dólares y cerca de 130 mil millones de dólares en acciones circulantes. Sumado a las recientes declaraciones de Elon Musk, podemos tener para la próxima semana una tendencia Alcista que sobrepase el R3, y su precio puede sobrepasar los 0,500$.
Los Puntos de Pivote es una gran herramienta para predecir los precios del mercado, en lo particular recomiendo tomarla en cuenta a la hora de practicar la lectura de los gráficos y aunque al principio es fácil errar, al volvernos hábiles, tenemos una gran probabilidad de éxito en nuestras inversiones a corto plazo.
Añadiendo esto a las teorías de lectura de gráficos como las de Elliott o Wyckoff, reduciremos al máximo el margen de error.
Espero que esta tarea cumpla con las expectativas de la clase. Agradezco al profesor @stream4u por darnos esta interesante herramienta.

Once again I want to greet the Steemit Crypto Academia, and professor @stream4u, who has given us an excellent class about another very useful technique for reading graphs and thus being able to create good strategies for our businesses within crypto commerce.

** PIVOT ** It is the word used to describe changes of direction starting from a specific point. In basketball, when a player changes his direction by turning on a supporting foot, this is called a pivot.
In the case of trading, the PIVOT is the change in the price of an asset, whether increasing or decreasing, and this leaves on the graph, certain peaks that analysts use to predict the market and plan strategies for income or departure from it.
Over time, various conceptions of this technique emerged.
.jpeg)
The numbers according to this theory, follow a pattern based on the lowest point, and the percentage sum of both, gives us the result of the following sequence, then the second plus the third would give us the fourth. Example: 0,1,1,2,3,5,8,13,21 ....

In this case, Ken Woodie, acts on the charts using the CCI indicator, without taking into account, almost at all, the price of the asset. Woodie also uses a PSYCHOLOGICAL MOTIVATION part.
There are other prediction techniques based on Pivot Points, the Camarilla one that takes into account 8 levels of resistance and support. Tom Demark's, which is not as such a pivot but serves to anticipate the highs and lows of the market.
In this post I am based on the Traditional method that, taking into account the basic concept of the pivot, and the different movements in the market, the scholars and analysts who generated this theory were able to give the different pivots the following classifications:
- Main Pivot:
This is the midpoint of the Chart from here the analysis of the supports and resistances starts. Mark the value 0
- Supports:
These define the rebounds in price when the price falls for a moment and then rises again. In the Traditional method there are 3 supports (S1, S2, S3).
- Resistance:
It is the maximum limit in which the price of the asset tries to overcome but cannot, therefore a downward rebound is denoted. Like the supports, the resistance has three types (R1, R2, R3).
There are mathematical formulas to be able to calculate the pivot points, and depending on each theory the formula can vary. Although there are automatic forms for these calculations, I will leave you the different formulas that exist.
- Traditional method:
P.P = (H + L + C) / 3
R1 = P + (P – L)
R2 = P + (H – L)
S1 = P – (H – P)
S2 = P – (H – L)
In which H is the maximum value, L is the Lowest value and C is the Close.
- Woodie method:
PP = (H + L + 2 X C) / 4
R1 = (2 X P) – L
R2 = P + H – L
S1 = (2 X P) – H
S2 = P – H + L
- Tom Demark Method
Si Cierre < Apertura, entonces X = H+2×L+C
Si Cierre > Apertura, entonces X = 2xH+L+C
Si Cierre = Apertura, entonces X = H+L+2xC
Nuevo Máximo = X / 2 – L
Nuevo Mínimo = X / 2 – H
- Camarilla Method:
R4 = (H – L) X 1.1 / 2 + C
R3 = (H – L) X 1.1 / 4 + C
R2 = (H – L) X 1.1 / 6 + C
R1 = (H – L) X 1.1 / 12 + C
S1 = C – (H – L) X 1.1 / 12
S2 = C – (H – L) X 1.1 / 6
S3 = C – (H – L) X 1.1 / 4
S4 = C – (H – L) X 1.1 / 2
When looking at the graphs, we can notice that as time passes, the coins change their trend. This, due to various social or psychological factors, which make people interested in investing more in an asset, in the upward change, or to sell the assets in the event of a downward change.
These trend changes in assets are defined as reverse trading, it is here where investors must pay attention to be able to make investments or a Stop Loss to protect themselves from losses.

- Step 1
We select the option Function (Fx)

- Step 2
In the option "Sail Patterns" we select, STANDARD PIVOT POINTS.

- Step 3
Once the Pivot Points appear on the graph, we look for the configuration option. In data entry, we leave the default configuration, Pivots Timeframe, it remains at Automatic and Numbers of Pivots Back remains at 15

- Step 4
In the Style option, we select the number of S / R that we want to appear, the thickness of the line and the color to differentiate them.

In this way we will obtain the pivot points that we consider necessary for our analysis.
A common misconception is that this method is 100% effective. As it is a technique based on prediction, it must be taken into account that the values are not 100% safe, and although it is a highly proven method, there is also a margin of error that one must be aware of.
So it is necessary to practice it until you understand the behavior well and that way the margin of error will get smaller.
Another mistake is not reading trends well and not anticipating breakouts, that way it is easy for a newbie to believe that they are following a trend that then changes in a breakout and brings losses.

We see how since the 31st the Dogecoin comes with a moderate upward trend and it is not until June 2 when, starting from the Main Pivot, its rise takes an important turn reaching R2, reaching a price of more than $ 0.400, inviting the investors to invest. This coincides with Musk's tweet taking into account, this coin for his Tesla Motors brand.
The price remained oscillating until June 3 when the trade is reversed and the market falls to S2, which means several Stop Loss and share sales.
From the middle of day 4 to day 5, we can see a recovery in the capital, which surpasses the Main Pivot having a new change in trend although short.
Currently the indicator shows us an upward trend marking a Price of $ 0.375.
I have chosen Dogecoin due to its popularity, ranking No. 6 in trend according to Coinmarketcap and it has a market of 48,412 million dollars and about 130 billion dollars in circulating shares. In addition to the recent statements of Elon Musk, we may have an uptrend for next week that exceeds the R3, and its price may exceed $ 0.500.
The Pivot Points is a great tool to predict market prices, in particular I recommend taking it into account when practicing reading the charts and although at first it is easy to make mistakes, when we become proficient, we have a great probability of success. in our short-term investments.
By adding this to chart reading theories like Elliott or Wyckoff, we will minimize the margin of error.
I hope this assignment meets the expectations of the class. I thank professor @ stream4u for giving us this interesting tool.

You've got a free upvote from witness fuli.
Peace & Love!
Downvoting a post can decrease pending rewards and make it less visible. Common reasons:
Submit
Hi @jeemrocker
Thank you for joining The Steemit Crypto Academy Courses and participated in the Homework Task.
Your Homework Task verification has been done by @Stream4u, hope you have enjoyed and learned something new.
Thank You.
@stream4u
Crypto Professors : Steemit Crypto Academy
#affable
Downvoting a post can decrease pending rewards and make it less visible. Common reasons:
Submit
Thanks so much @stream4u, im glad to participated in your class! 🤗
Downvoting a post can decrease pending rewards and make it less visible. Common reasons:
Submit