
OVERVIEW
When trading crypto, it is important that we take into consideration, the various technical indicators available on the candlestick chart. These indicators can be very useful in making profitable decisions while trading. In this homework post, I'll be expounding on one of such technical indicators - the Ichimoku Kinko Hyo indicator.

WHAT IS THE ICHIMOKU KINKO HYO INDICATOR?
The Ichimoku Kinko Hyo indicator is best described as an equilibrium chart. It literally translates in English to 'equilibrium chart at a glance'. It helps the trader to measure future price momentum as well as ascertain future support and resistance points, all in a trending market.
It is increasingly popular these days amongst traders not the least due to its ease of use as it shows trading opportunities at a glance when all its components are combined.
This multi component tongue twisting indicator was surprisingly developed by a journalist named Goichi Hosoda, with the help of some mathematically sound sidekicks. This happened in Japan, in the 1930s, though the indicator was released in the 1960s and was only recently adopted by the western world.
When fully applied, the indicator, with all of its components fully paraded, can intimidate any audience. This is because it consists of five components, lines really, drawn to scary specifications, making the chart all crowded and 'clouded' up.
Fortunately, in this post, I'll explain each of these lines and show how friendly these lines can be to a trader despite their halloween costume.

WHAT ARE THE DIFFERENT LINES THAT MAKE IT UP? (SCREENSHOTS REQUIRED)
There are 5 different lines that make up the indicator. They are:
Tenkan Sen (Conversion Line)
Kijun Sen (Base Line)
Senkou Span A (Leading Span A)
Senkou Span B (Leading Span B)
Chikou Span (Lagging Span)
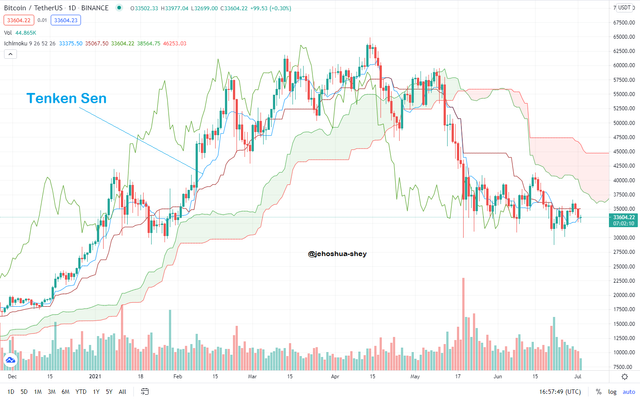
TENKAN SEN (Conversion Line)
This is a line drawn through points which each represents the average of the highest point and the lowest point of the past nine periods.
Kinda hope you get that.
Basically, a point on the Tenkan Sen is approximately the average of the highest point and the lowest point of the previous nine periods. The formula is given by:
CL = (HP9 + LP9) / 2
Where
HP = Highest point
LP = Lowest point
CL = Conversion Line
Tenkan Sen is usually the blue line by default. I'll show an easy hack to identifying each of the lines later in this post.
Tenkan Sen (conversion line)
KIJUN SEN (Base Line)
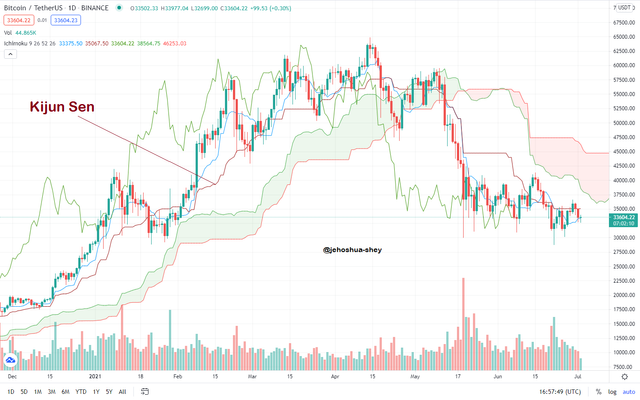
The Kijun Sen is so similar to the Tenkan Sen, the only difference being the period. The Kijun Sen is a line drawn through points which each represents the average of the highest point and the lowest point of the past twenty-six periods.
If you read the last sentence correctly, you'd notice that the difference between Kijun Sen and Tenkan Sen is that Kijun Sen considers 26 periods while Tenkan sen considers 9 periods.
The formula for Kijun Sen is given by
BL = (HP26 + LP26) / 2
Where
HP = Highest point
LP = Lowest point
BL = Conversion Line
Kijun Sen is usually the dark red line.
SENKOU SPAN A (Leading Span A)
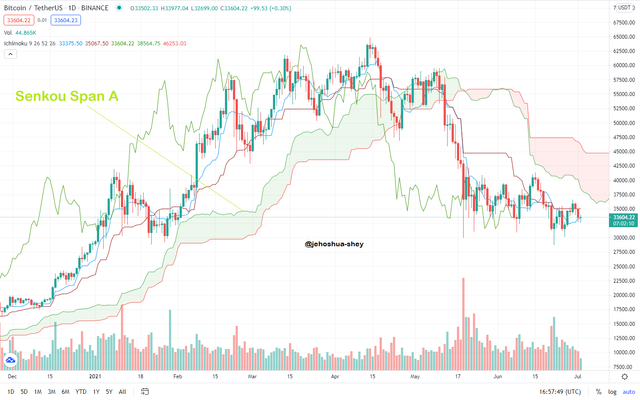
This line is sometimes called SSA, it is the average of the Tenkan Sen and the Kijun Sen and it is projected 26 periods into the future. This is why the line doesn't stop at the last candle.
The formula for Senkou Span A is given by
SSA = (Kijun Sen + Tenkan Sen) / 2
Senkou Span A is usually the lighter of the two green lines.
SENKOU SPAN B (Leading Span A)
This line is sometimes called SSB, it is the average of the highest point and the lowest point of the past 52 periods and it is also projected 26 periods into the future. This is why the line also doesn't stop at the last candle, just like the Senkou Span A
The formula for Senkou Span B is given by
SSB = (HP52 + LP52) / 2
Senkou Span B is usually the light red line.
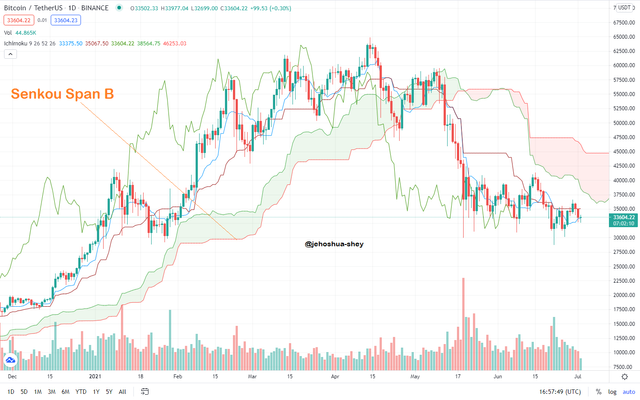
The area between Senkou Span and A and Senkou Span B is usually coloured on the chart. This area os called 'Kumo' or 'Cloud'.
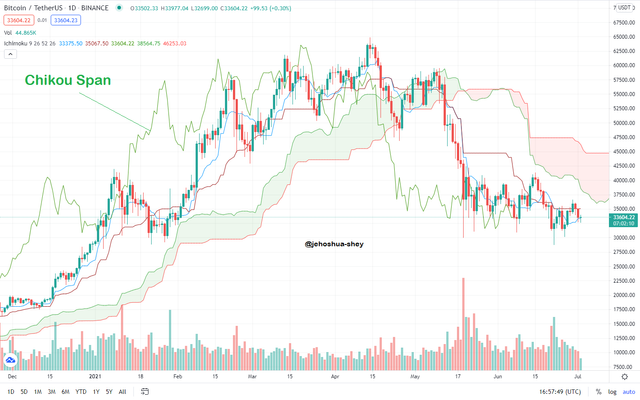
CHIKOU SPAN (Lagging Span)
The Chikou Span is also referred to as market sentiment. The closing price of the latest period is used in calculating this Span, only that it is plotted 26 periods behind.
It is usually a green line just like SSA but is easier to spot. This is because, Chikou Span stops at the 26th-to-the-last period, that's why it's called lagging span.

ADDING THE ICHIMOKU INDICATOR TO THE CHART
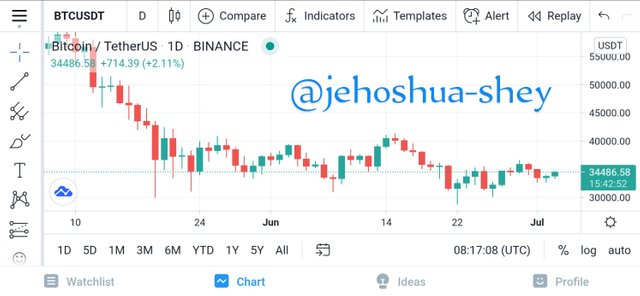
Here's how to add the Ichimoku indicator to the candlestick chart. For this illustration, I'll be using Trading view.
Select any trade pair on Tradingview to open the candlestick chart
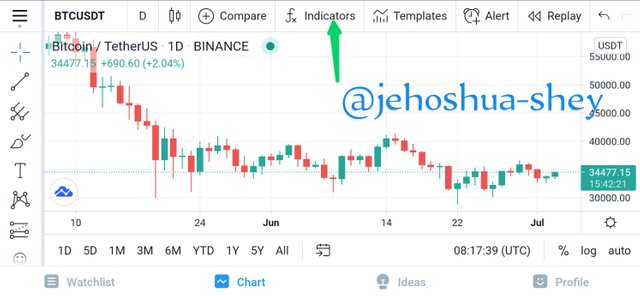
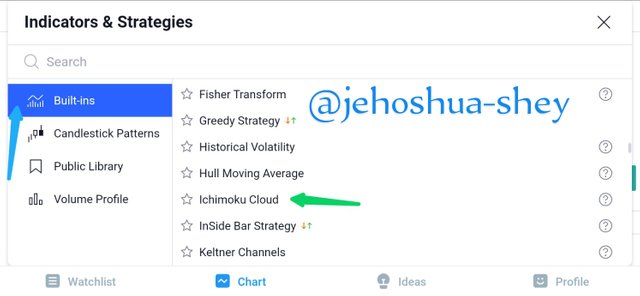
Next, click on 'indicators' as shown below
Next, make sure 'Built-ins' is selected on the left, then scroll down to letter 'I' and select 'Ichimoku cloud'
Now, that brings up the horror show that is the Ichimoku indicator
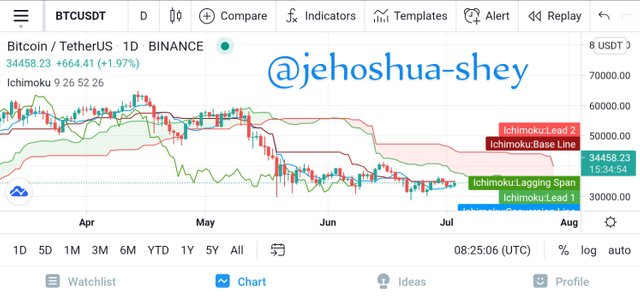
If changing the colors of these scary clustered lines will do any good, here's how to do it.
Click on the indicator on the left side of the chart (like in the image below)
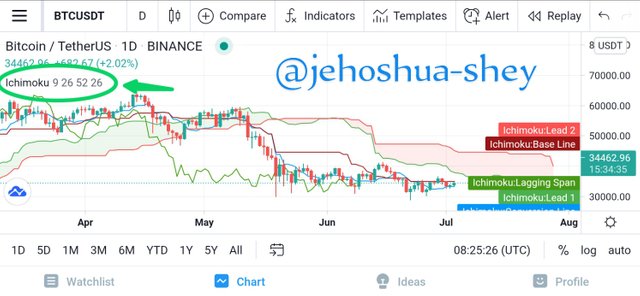
Then click on the settings icon
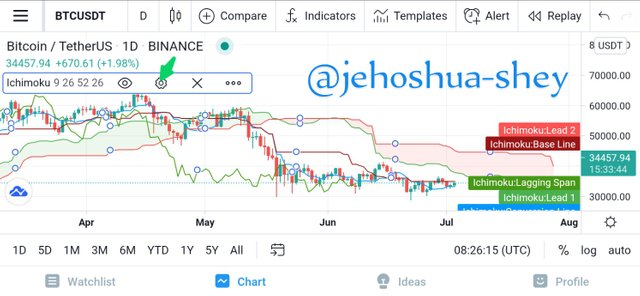
Now you can re-innovate your chart. Just be sure you know what line you're giving each color.
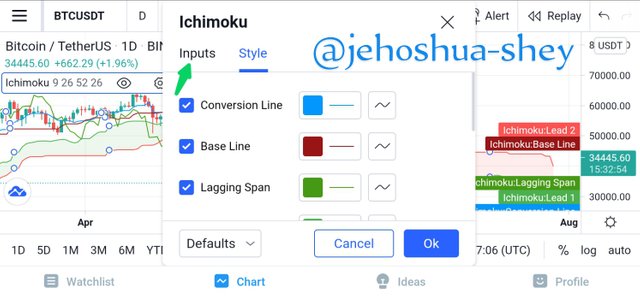
The names are in English and in this post, I ensured that I also added the English names to each line. That should help.
NB: This is the hack to identifying which line is colored what, which I spoke of earlier.
ICHIMOKU INDICATOR DEFAULT SETTINGS
The default settings on the chart can be shown by clicking on 'inputs' just like in the last image shown.
Once that is done, the defaults settings will be shown like in the image below
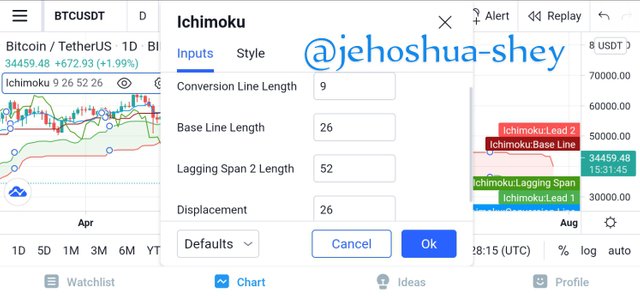
The default settings are
Conversion line length (Tenkan Sen periods) - 9
Base line length (Kijun Sen periods) - 26
Leading span 2 length (Senkou Span B periods) - 52
Displacement (SSA & SSB projection period and Chikou lagging period) - 26
SHOULD THE ICHIMOKU INDICATOR DEFAULT SETTINGS BE CHANGED?
The answer to the above question depends on the trader and the market they are trading in. We know that the default settings were selected by the inventor of the indicator due to the nature of the market it was first applied (take with a pinch of salt that someone said it was first used for trading rice in Japan).
Then, working days were 6 days in a week and approximately 26 in a month, summing up to about 52 days in 2 months. The 9 periods was tod account for the days in one-and-a-half working week (6 + 3 days) while the 26 and 52 for one and two working months respectively.
That said, changing the default settings totally depends on the trader.
For me, considering that all days are currently trading days, (really, there's no day in the week that binance or coinbase or huobi reports 0$ trading volume) I'll go for
30 days (rather than 26) for working month (applicable in displacement and base line length)
60 days (rather than 52) for two working months (applicable in leading span 2 length)
7 days for a working week and 10 days for one-and-a-half working week.
Now, whether I'll stick to using 1 month, 2 months and 1.5 weeks for my indicator, will depend on my success with the particular trading pair. I might try out other multiples to see which one works best if the default ones are not so impressive.

HOW TO USE THE TENKAN SEN AND KIJUN SEN
Generally, the cloud (kumo) is the most important feature of this indicator as it depicts the trend of the market, whether it's up or down or sideways. However, the momentum signal of the price is identified by the relationship between the market price, the Tenkan Sen (conversion line) and the Kijun Sen (base line).
USING THE TENKAN SEN
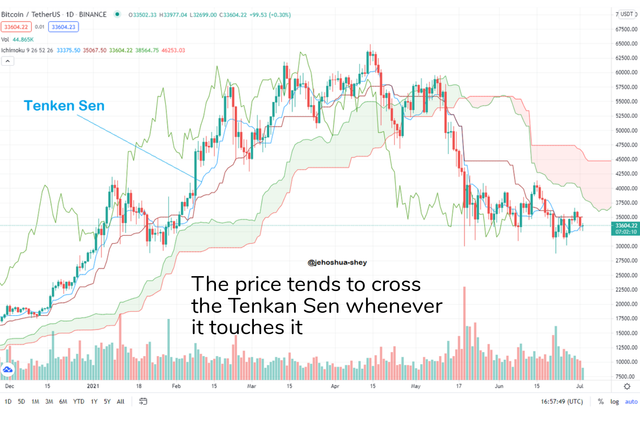
The Tenkan Sen plots closest to the price than any other line. Reading the Tenkan Sen, you can discover that whenever the candle bar touches the Tenkan Sen, the price tend to cross the line and proceed in that direction for some time.
In other words, touching the Tenkan Sen might be a signal of the start of a bullish or bearish trend. This signal however, is not to be used conclusively as it may be false.
USING THE KIJUN SEN
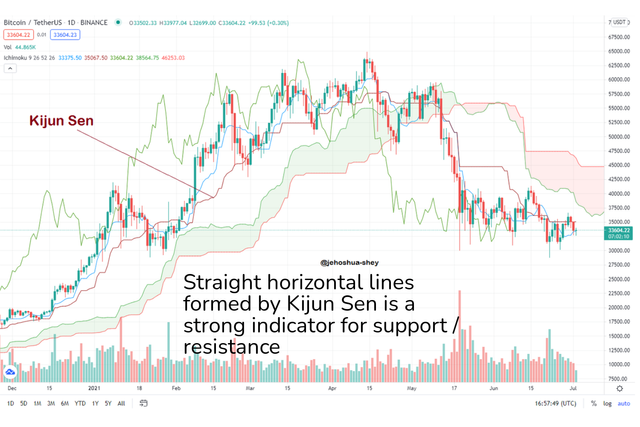
The Kijun Sen takes more periods into consideration and provides stints of straight lines which can be very useful in determining support and resistance depending on if the Kijun Sen is above the cloud or below.
Looking at the Kijun Sen closely, we see that whenever a straight line is formed above the cloud, there is strong indication of a support and whenever it is formed below the cloud, there is a strong indication of resistance.
The prices at these respective times is most likely a support or a resistance point.
USING TENKAN SEN AND KIJUN SEN SIMULTANEOUSLY
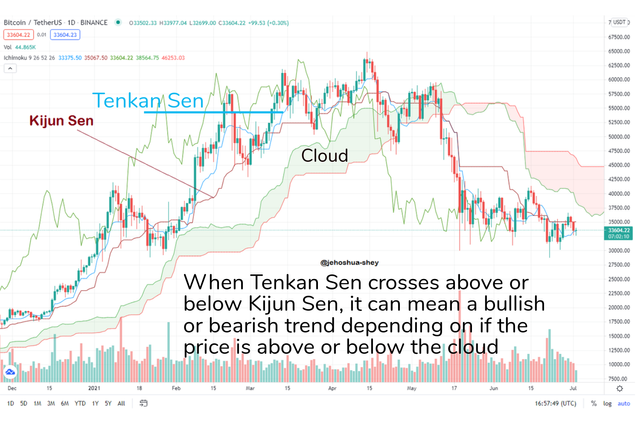
Using Tenkan Sen and Kijun Sen simultaneously can help to identify signals in a trending market. Whenever the price is above the cloud (kumo), there's an uptrend. During this period, when the Tenkan Sen crosses above the Kijun Sen, it indicates a bullish signal.
However, if Tenkan Sen crosses below Kijun Sen in a down trend, ie. when the price is below the cloud (kumo), it indicates a bearish signal
Take a close look at the crossover points of the Tenkan Sen and Kijun Sen in the images below

THE CHIKOU SPAN AND WHY IT IS OFTEN NEGLECTED
The Chikou Span (lagging span) is also called market sentiment. It is calculated using the closing prices of the latest period but it is plotted 26 periods back by default. It doesn't get to the last period, instead it stops at the 26th-to-the-last period, depending on the displacement setting.
USING THE CHIKOU SPAN
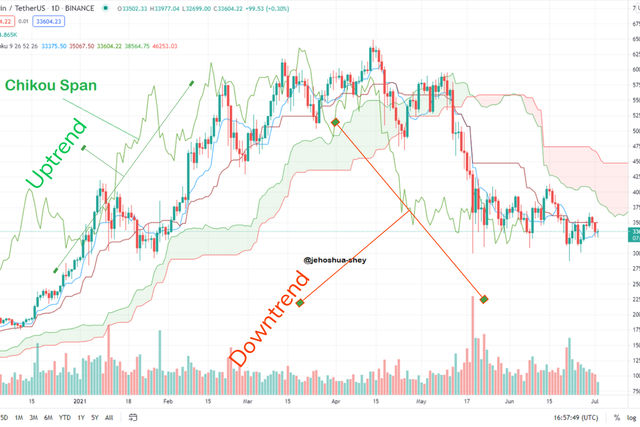
The Chikou Span should be preferably used together with other indicators. This way, it's usefulness will be optimized. It can be used to confirm a bullish trend when it moves above the market price and a bearish trend when it moves below.
Take a look at the image below
WHY THE CHIKOU SPAN IS OFTEN NEGLECTED
I'm one of those who neglect the Chikou Span, and I'll give you my reasons.
The Chikou Span has no inherent predictive characteristic. It's just a representation of price history
The Chikou doesn't give any information the current period since it stops about 26 periods before. So, talking of current analysis or analysis of up to the past 25 periods, the Chikou Span isn't available.
I'm not saying it's not useful, but it doesn't actually predict and it is not available for the latest periods.
It is however very efficient in confirming a bullish trend and a bearish trend.

BEST TIMEFRAME FOR ICHIMOKU INDICATOR AND THE BEST AUGMENTING INDICATOR
The timeframe to be used depends on the trader. A scalper will prefer a shorter timeframe like 15 mins to 1hr while a long-term trader will want to go for a longer time frame.
I prefer basing my analysis on the 4hr timeframe, cross-checking occasionally with the 1hr and 1 day timeframe. However, the Ichimoku indicator is very efficient accross timeframes, only the analysis shouldn't be applied to a different timeframe.
I also like to use the RSI and since it doesn't appear on the chart, it will be a good companion for the Ichimoku (I'm not about to read a seismograph). The RSI tells when there is likely to be a reversal and I need to know this when I'm trading in a trending market.
See both combined in the image below
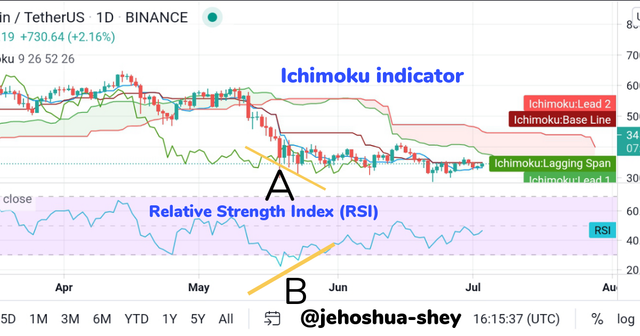
Above, we see the RSI indicating a higher low at point B but at point A there's a lower low. Normally, this means a reversal but then, the Ichimoku indicator says something else.
Through the Ichimoku cloud we see that the market is in a bearish trend. The Kijun Sen line also shows us resistance though there's a straight line indicating that the price is soon returning to equilibrium. Later on the price meets the Kijun Sen.
The fact that the cloud indicates bearish tells is not to expect a drastic reversal to the uptrend. With only the RSI, one might be tempted to go all in expecting a huge market reversal.

CONCLUSION
The Ichimoku indicator is a very potent technical analysis tool especially when applied properly and/or combined with a suitable indicator like RSI. It's very robust in the sense that it contains lots of useful indicators. It is applicable on any timeframe and is very useful in a trending market.
Thanks for reading
Cc:
@kouba01