
LIQUIDITY LEVEL
In crypto trading, liquidity refers to assets made available for trade. Liquidity level is therefore the level of price action where lots of assets are being traded. What happens at this level is that it is the price at which both buyers and sellers have placed orders for the asset to be bought and sold respectively.
Also, the liquidity level could be the point where stoplosses have been set buy traders who were looking to exit their trades should the rades go against them up till that point.
IDENTIFYING LIQUIDITY LEVELS
To identify a liquidity level on the candlestick chart, you need to look out for areas of instant significant reversals of price from a particular level. You can identify this through pinbars or hammers in the candlestick pattern.
Consider the following example below
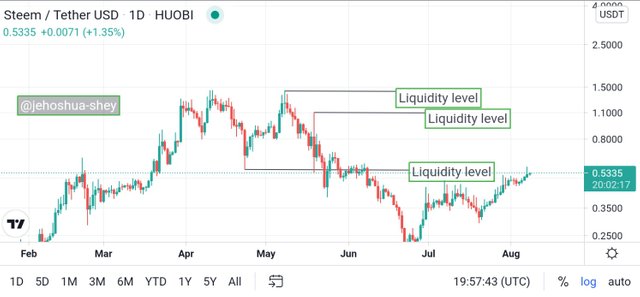
A Steem/USDT chart on a 1 day timeframe
Note: In the image above, not all the liquidity levels are labeled, just about three of them.
The three liquidity levels labeled give a clear hint on liquidity levels on the candlestick chart.
Consider another example below
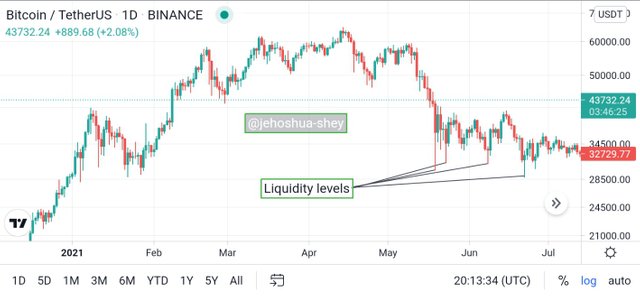
A BTC/USDT chart on a 1 day timeframe
In the example above, there are four liquidity levels labeled to further explain the concept of liquidity levels on a candlestick chart.

WHY TRADERS GET TRAPPED IN A FAKEOUT
In crypto trader, a Fakeout is a false price action trend. in some cases like at significant liquidity levels, Fakeouts are usually due to some market manipulations. When these Fakeouts happen, many retail traders usually get trapped in. But why?
Sometimes, when a very significant liquidity level is reached, especially when it is in the domain of stoplosses set by traders, some big financial institutions take advantage of the liquidity to take out the stoplosses set by traders.
These institutions do this by injecting money at the point of liquidity to make the price break through the set stoplosses. On the candlestick, this action by these big institutions creates a price breakout and this instigates traders to begin to enter trades.
However, after the big institution has broken through and taken out the stoplosses the big institutions inject money in the opposite direction to revert the price action. This reversal leaves traders who entered trades stranded or trapped in their trades and they find out that they traded a false breakout.
Below are typical examples of fakeouts
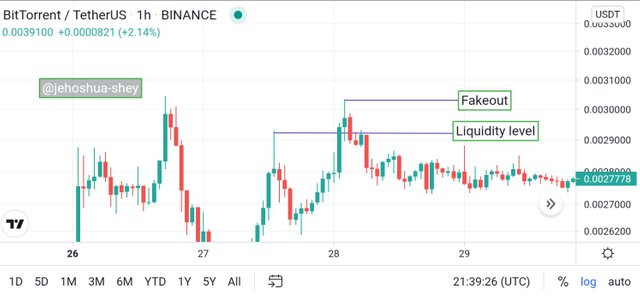
A BTT/USDT chart on a 1 hr timeframe
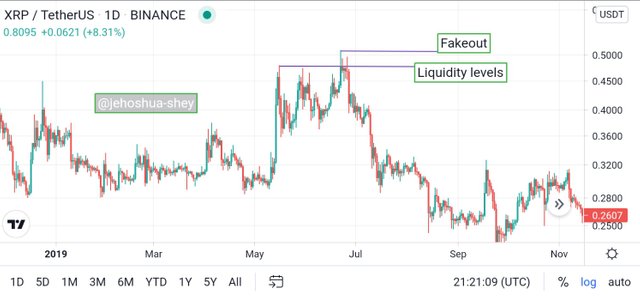
An XRP/USDT chart on a 1 day timeframe

TRADING LIQUIDITY LEVELS THE RIGHT WAY
Whenever there's a liquidity level on the candlestick chart, it could mean 2 things.
The price will continue and breakout (i.e a MSB)
The price may continue for a short time or may not at all and revert back in its former direction (i.e BRB).
Before making a trade, the trader should check to ascertain the possible scenario about to be created by price action. The scenario created, whether MSB or BRB will determine the teade criteria.
For MSB
If the price action forms a higher low after a series of lower lows, and it seems to break through the resistance line (neckline) on the chart, then it is likely an MSB.
STRATEGY OR CRITERIA
Buy:
Entry:
Observe the market and ensure that it's bearish (i.e lower low repeatedly formed)
Wait for the formation of a higher low, then identify the resistance line on the chart.
Allow price action to break through the resistance line. The candle should close above the line and continue upwards.
Take a buy entry just below the closing price of the breakout candle.
Exit:
Stoploss should be set just below the higher low
Take profit should be measured by Risk to Reward ratio, which is usually 1:1 for beginners.
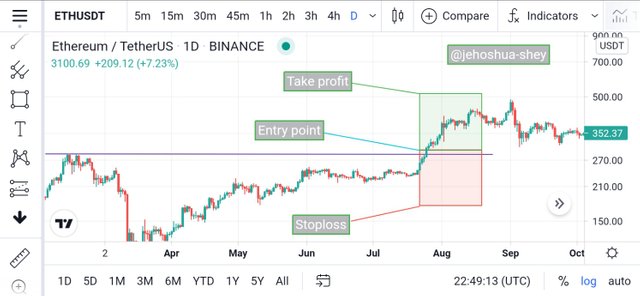
An ETH/USDT chart on a 1 day timeframe
Sell
Entry:
Observe the market and ensure that it's bullish (i.e higher high repeatedly formed)
Wait for the formation of a lower high, then identify the support line on the chart.
Allow price action to break through the support line. The candle should close below the line and continue downwards.
Take a sell entry just above the closing price of the breakout candle.
Exit:
Stoploss should be set just above the lower high
Take profit should be measured by Risk to Reward ratio, which is usually 1:1 for beginners.
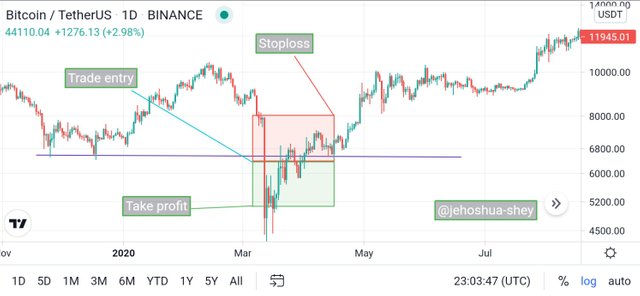
A BTC/USDT chart on a 1 day timeframe
For BRB
If the price action forms a lower high after a series of higher highs, and it seems to break through the support or resistance line (neckline) on the chart, then it comes back to the neckline to retest it before returning back then it is likely a BRB.
Buy
Entry:
When the price approaches the resistance level and goes above it to form new swing high, then comes back to the resistance level to retest it, and goes back up again, breaking the new swing high, there is a confirmation of BRB.
Place order just above the new swing high broken.
Exit:
Set stoploss a little below the resistance level that was tested.
Take profit should be in a ratio to stoploss. Usually 1:1 for beginners.
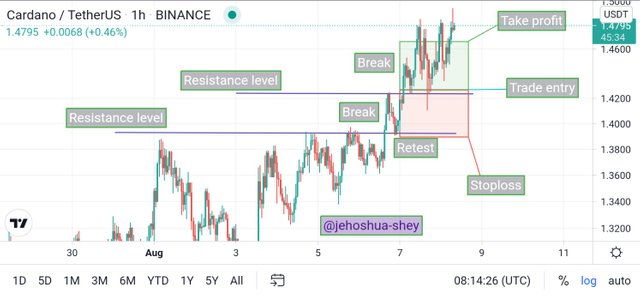
An ADA/USDT chart on a 1 hr timeframe
Sell
Entry:
When the price approaches the support level and goes below it to form new swing low, then comes back to the support level to retest it, and goes back down again, breaking the new swing low, there is a confirmation of BRB.
Place order just below the new swing low broken after the retest.
Exit:
Set stoploss a little above the support level that was tested.
Take profit should be in a ratio to stoploss. Usually 1:1 for beginners.
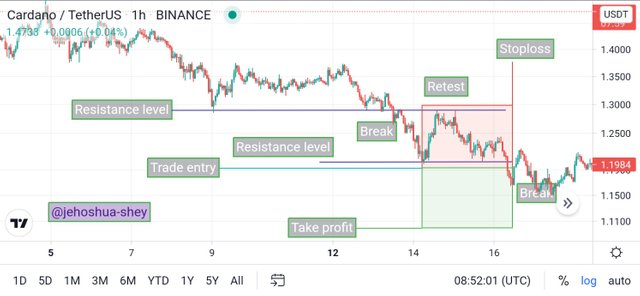
An ADA/USDT chart on a 1 hr timeframe

LIQUIDITY LEVEL SETUP ON CRYPTO ASSETS
Below, I'll show the right liquidity level trade setup on 4 different crypto assets which are:
Ripple (XRP)
Steem (STEEM)
Tron (TRX)
Ethereum (ETH)
RIPPLE (XRP)
For XRP, we see liquidity levels and also find MSB (Market Structure Break) formed. We trade according to MSB criteria.
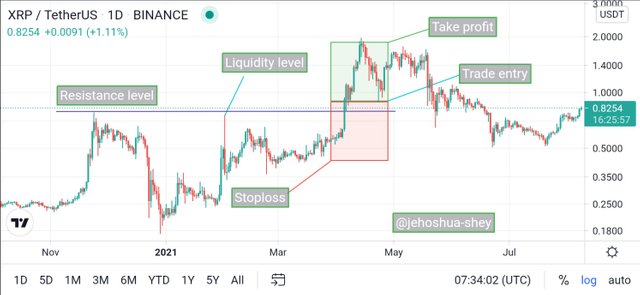
An XRP/USDT chart on a 1 day timeframe
STEEM (STEEM)
For STEEM we also find the formation of Market Structure Break (MSB) where we find liquidity levels and so, we trade according to MSB criteria.
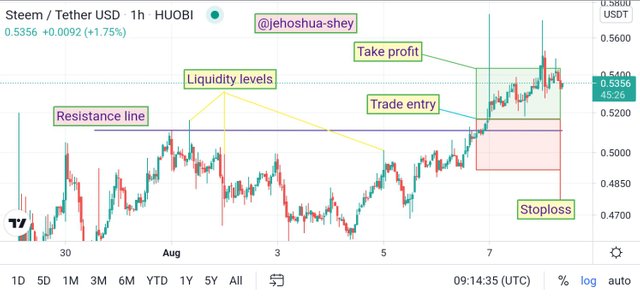
A STEEM/USDT chart on a 1 hr timeframe
TRON (TRX)
For Tron, we find Break Retest Break (BRB) pattern formed where we have liquidity levels. Here we trade according to BRB criteria.
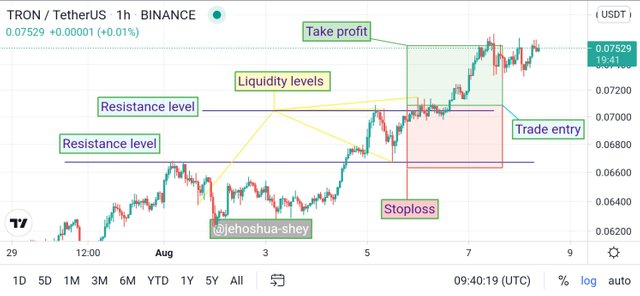
A TRX/USDT chart on a 1 hr timeframe
ETHEREUM (ETH)
ETH also forms Break Retest Break (BRB) where we find liquidity levels. This implies that we trade according to the BRB criteria like we did for STEEM.
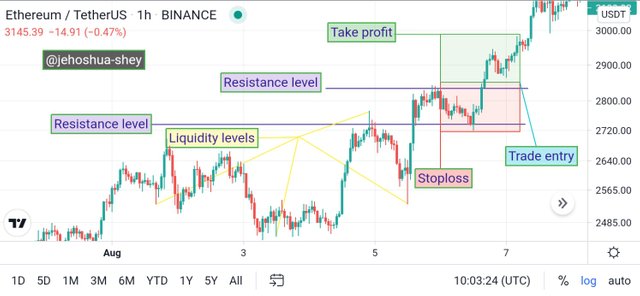
An ETH/USDT chart on a 1 hr timeframe

CONCLUSION
Lots of retail traders gets trapped in fakeouts as a result of their limited knowledge of liquidity levels. These levels are price levels where lots of trade go on and sometimes it could involve market manipulation.
We however learnt from this course that liquidity levels don't show exit or entry strategies for trading but the price action formed around or after the liquidity levels.
When a Market Structure Break (MSB) forms around or after liquidity levels, we trade according to the MSB criteria. But if a Break Retest Break (BRB) forms around or after liquidity levels, we trade according to (BRB) criteria.
Thanks for reading.
Cc:
@cryptokraze
Downvoting a post can decrease pending rewards and make it less visible. Common reasons:
Submit