HOMEWORK TASK 2
INSTITUTION: STEEMIT CRYPTO ACADEMY
COURSE: HOW TO READ CANDLESTICK CHARTS IN DIFFERENT TIME FRAME & INFORMATION ABOUT BUY-SELL (SUPPORT & RESISTANCE)
CRYPTO PROFESSOR: STREAM4U
HOMEWORK TASK: Steemit Crypto Academy | Course 2 | How To Read Candlestick Charts In Different Time Frame & Information about Buy-Sell(Support & Resistance).
This is my homework task 2 entry on the above-stated course lectured by the above-stated crypto professor.
Based on my understanding of the topics treated in this course, I'll be completing this homework task with the following points
- Candlesticks
- Timeframes
- Market traders
- Support and resistance
With these points, I'll be covering all the topics required in this homework task. I'll also mention the required topics for easy reading.
CANDLESTICKS

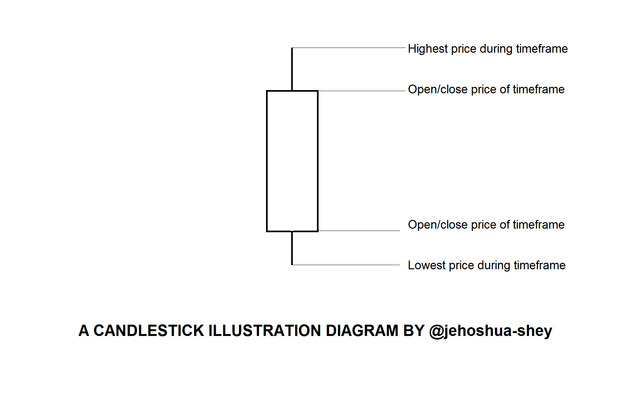
On a cryptocurrency candlestick chart, a candlestick is a bar usually with sticks attached at both ends. All the vertical points on a candlestick have their significance. I'll be explaining them with the image below.
Top and bottom stick
From the above image, the upper tip of the top stick is the highest price of the crypto asset during the timeframe being considered while the lower tip of the bottom stick is the lowest price of the crypto asset during the timeframe being considered.
Bar top and bar bottom
The top of the bar is the opening or closing price of the crypto asset for the timeframe being considered while the bottom of the bar is the opening or closing price of the crypto asset for the timeframe being considered.
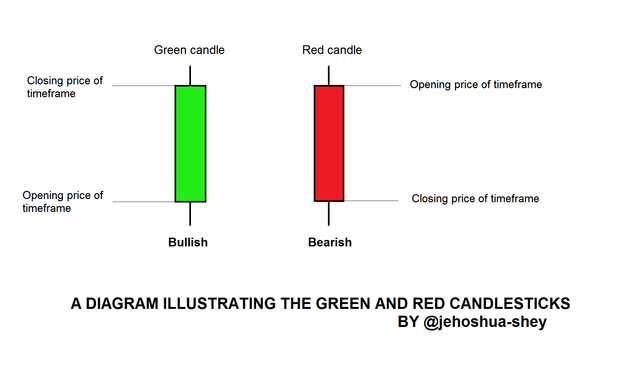
Let me clarify something here, there are two types of candlesticks, green and red. The type of candlestick determines if the top or bottom of the bar is the opening or closing price. Further explanation will be gotten as I cover the first required topic of this homework task.
Explain what is the meaning of the Green and Red candle and how to read the Green and Red candle, with candles image. (Screenshot Needed)
Now let's consider this image below
Green candle
The green candle is the candle that forms when there is a profit at the end of the timeframe. This is why the lower point is the opening price while the upper point is the closing price (indicating a profit as the closing price is higher than the opening price). The green candle can also be called the bullish candle.
Red candle
The red candle is the opposite of the green candle. It is formed when there is a loss at the end of the timeframe. This is why the upper point is the opening price while the lower point is the closing price (indicating a loss as the opening price is higher than the closing price). The red candle can also be called the bearish candle.
Reading both candles
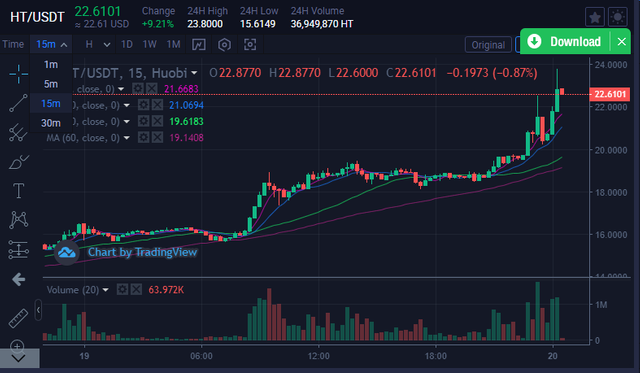
Let's use a real chart picture for an example of how to read the green and red candles. So, consider the image below
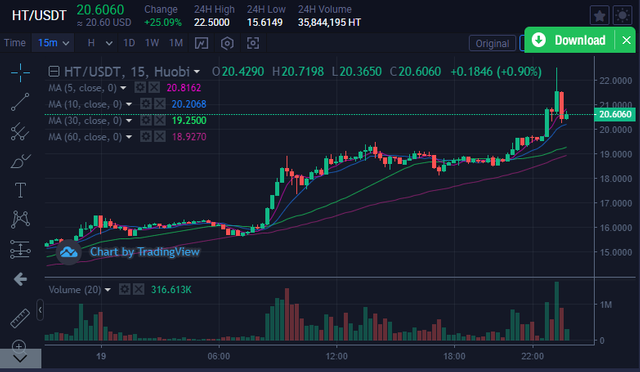
This is a 15min timeframe candlestick chart. Let's carefully consider the last 5 candlesticks at the right.
The fifth-to-last opened at ~$19.70 and closed at around ~$20.85 for that 15min-duration. That's a profit, so it's green.
The fourth-to-last opened at the point the previous candlestick closed - ~$20.85 and closed at ~$20.80 for that 15min-duration. That's a loss though it's only ~$0.05, so the candle is red.
The third-to-last opened at the point the previous candlestick closed - ~$20.80 and closed at ~$21.50 for that 15min-duration. That's a profit, so the candle is green.
The second-to-last opened at the point the previous candlestick closed - ~$21.50 and closed at ~$20.45 for that 15min-duration. That's a loss, so the candle is red.
The last opened at the point the previous candlestick closed - ~$20.45 and closed at ~$20.65 for that 15min-duration. That's a profit, so the candle is green.
TIMEFRAMES

These are simply time intervals that can be studied on the candlestick chart. Further explanation is given as I cover the second required topic of this homework task
Explain with Candle Chart, what are the time frames available that we can set into the chart, and why it needs to change the candle time frame? (Screenshot Needed)
There are different timeframes or time intervals on the candlestick charts. When a timeframe is studied, each candlestick shows the price movement for the period of time the timeframe stipulates.
For example, the screenshot I used to explain how to read candlestick was for a 15min timeframe. Each candlestick in that screenshot represents a 15min period (from the top of the bar to its bottom, including its sticks).
For Huobi Global, the timeframes or time intervals available are in minutes, hours, 1 day, 1 week, and 1 month

The hours are further divided into 1-hour and 4-hour intervals.
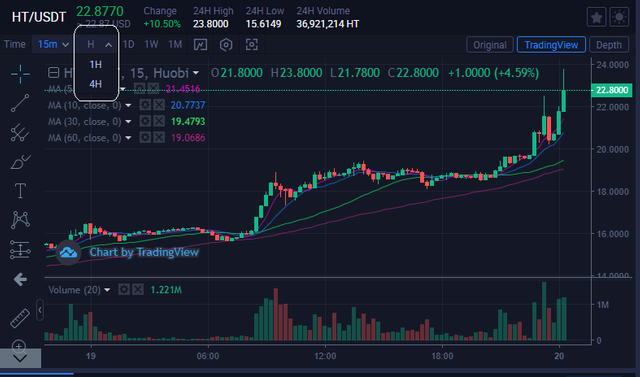
While the minutes' interval is further divided into 1-minute, 5-minute, 15-minute, and 30-minute intervals.
Changing timeframes is necessary depending on the trader. This I expound as I cover the third required topic for this homework task.
Why you may need to change the candle timeframe
If you want to study the candlestick chart, you need to know the timeframe you're studying. If you want to make a long-term decision, you need to study a long-term timeframe like 1-month or 1-week timeframes. If you study a short-term timeframe for a long-term investment decision, you're bound to make mistakes.
More about timeframes is explained as I cover the third topic required in this homework task.
Show any particular asset candle chart in a different time frame and explain in short what you see in the chart, like which trend we see, what are the price levels. (Screenshot Needed)
Let's study HT/USDT candlestick chart on Huobi Global for different timeframes,
15-minute (short-term)

And
1-week (long-term).
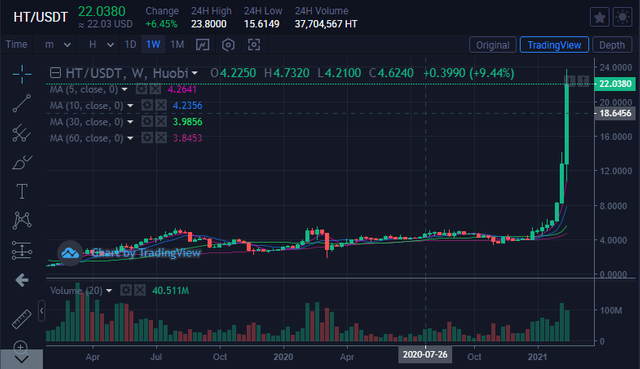
Notice the difference in trends of the two charts.
The first one (15-minute interval) shows some losses for later periods in the chart while the second one (1-week interval) shows profits for later periods in the chart.
The deduction is, during the last week on the 1-week interval chart, there were lots of 15-minute intervals that recorded losses. So, the short-term investor can be misled by the 1-week chart while the long-term investor can be discouraged by the 15-minute chart. In either case, it will be a wrong impression which can lead to a wrong investment decision.
MARKET TRADERS

There are different types of market traders. There are those who want to wait and there are also those who want the profit very quickly. You can call these traders patient and impatient traders respectively.
I'll throw more light as I cover the fourth required topic for this homework task.
What type of traders available in the market, explain how they work?
From this course, I learned about 3 types of traders - Short-term, long-term, and scalping traders
Short-term traders:
They buy an asset to sell within a short time. They can be seen as impatient and their profit is usually not as much as that of long-term traders. The candlestick charts most suitable for short-term traders are the charts with intervals less than 1-day
Long-term traders:
They buy an asset to sell after some time, from about 1-week to years. They can be seen as patient traders and their profit is usually more than that of other traders. The candlestick charts most suitable for short-term traders are the 1-day, 1-week, and 1-month chart
Scalpers:
These are super short-term traders. Very impatient in nature. They can exit the market in less than an hour. Their profit is usually the smallest and the charts most suitable for them can be any chart at all since they just profit from quick price movements.
SUPPORT AND RESISTANCE

In my own words, support and resistance is the action of the market at specific periods. When buyers are buying and affecting the price, it's known as support but when sellers are selling and affecting the price, it's known as resistance.
I'll explain this further as I cover the fifth required topic in this homework task.
In trading or investing in assets, what is the importance of Support and Resistance, explain how they work?
In trading or investment, support and resistance are important because it tells you the most favorable time to buy or to sell.
How it works?
When the majority of the market is wanting to buy, that means there's support for buying action. This is going to lead to an increase in price in the near future as most people are wanting to buy.
However, when the majority of the market is wanting to sell, that implies that there's a resistance to buying action. This is going to lead to a decrease in price in the near future as most people are wanting to sell.
I'll explain how to find support as I tackle the sixth required topic of this homework.
How we can find the Support in the candle chart, explain with one of the asset Candle charts with screenshot and point the levels. (Screenshot Needed)
Finding is quite simple. Consider the screenshot below
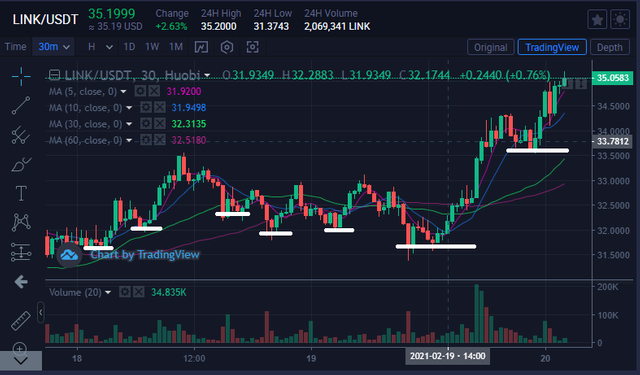
The above image is a 30-minute timeframe candlestick chart for one of the coins I hold - LINK.
Observe the areas marked with white lines. They are points at which the price tends to bounce back up. These points are referred to as Support. The support came at different levels. From Left-to-Right, support came at the following levels (in $$) - 31.60, 32.00, 32.35, 32.00, 32.00, 31.60, and 33.60.
To explain when to buy using support, let me cover the seventh and last required topic for this homework task
After finding Support, when and where we need to place a buy order, explain with a chart screenshot? (Screenshot Needed)

From the screenshot above, mark the last point of support and wait for the price to come down to that point then buy. Note that from the second point of support to the last, this principle paid off more than twice showing the authenticity of the advice.
CONCLUSION

Technical knowledge is very important as it gives the trader or investor an edge as it precisely tells them when to buy and when to sell.
Thanks for reading.

Cc:
@steemcurator01
@steemcurator02
@steemcurator04
@stream4u
Special mention:
To the attention of some notable steem promoters who keep inspiring me on my crypto journey which began here on steemit.
@stephenkendal
@trafalgar
@crypto.piotr
@steemchiller
@justyy
I also solicit the pardon of @steemitblog and @stream4u for the late submission of homework task 1 for this course. I didn't join the steemit crypto academy on time and it appears that that homework task wass essential for the completion of this homework task 2 which is currently on.


Hi @jehoshua-shey,
You made a good post on Homework task 2, explained it very well.
Thank You For Showing Your Intrest in Steemit Crypto Academy
You have completed the homework task and made a good post, explained very nicely about How To Read Candlestick Charts In Different Time Frame & Information about Buy-Sell(Support & Resistance).
Remark: Homework Task Completed.
Thank You.
@stream4u
Crypto Professors : Steemit Crypto Academy
Downvoting a post can decrease pending rewards and make it less visible. Common reasons:
Submit
Hi @stream4u,
Thank you so much, professor. I learned a lot of things from you. I'm looking forward to your next course.
Downvoting a post can decrease pending rewards and make it less visible. Common reasons:
Submit
Downvoting a post can decrease pending rewards and make it less visible. Common reasons:
Submit