HOMEWORK TASK 3
INSTITUTION: STEEMIT CRYPTO ACADEMY
COURSE: What is Chart Patterns? | Price Breakout - Continuation Patterns - Reversal Patterns | STOPLOSS.
CRYPTO PROFESSOR: STREAM4U
HOMEWORK TASK: What is Chart Patterns? | Price Breakout - Continuation Patterns - Reversal Patterns | STOPLOSS.
Hello everyone. This is my homework task 3 entry for the above-stated course lectured by the above-stated professor.
Having studied the above-stated course lectured by the above-stated professor, I'll be sharing what I've learned in this homework task. These are the points I'll be talking about -
- Chart pattern
- Price breakout
- Continuation pattern
- Reversal pattern
- Stoploss
I'll be using these above-stated points to cover all the topics required in this homework task. I'll also ensure that I mention each topic I cover for easy reading.
CHART PATTERN

With this point, I'll be addressing the first question of this homework task which is -
What is a Chart Pattern? Explain with Candlestick Charts.src
Pick up any cryptocurrency chart, especially one involving time and price, and what you'll be looking at is called a chart pattern. Chart patterns are simply the representations of the prices of crypto assets at different time periods. The image below shows the chart pattern for BTC/USDT for a 5min timeframe.
Chart pattern for BTC/USDT for a 5min timeframe
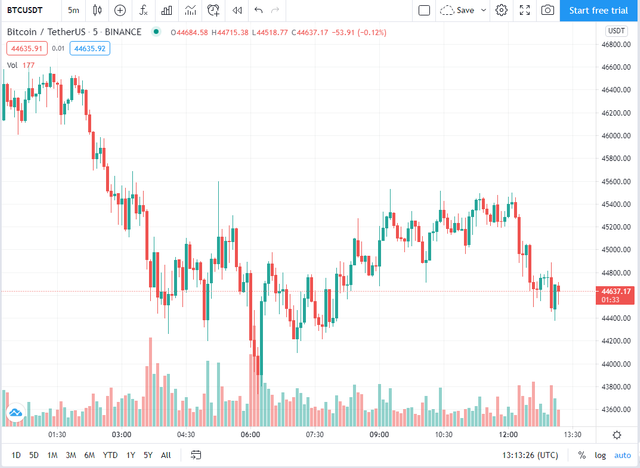
These chart patterns can be gotten for any timeframe you choose. They are very important as they show a lot of vital information needed for trading and investment. Studying how the price of an asset varies with time offers valuable suggestions on the entry and exit points of the asset for any trader or investor.
The rest of this post is about different valuable information that can be gotten from chart patterns - price breakout, continuation pattern, reversal pattern, stoploss.
PRICE BREAKOUT

Let me answer the second question of this homework post which is -
What is a Price Breakout? Explain with Candlestick Charts and mention the price levels.src
If you study price formations over time for a particular crypto asset, you'll discover some points from where the price seems to drop or rise. These points are called resistance and support respectively. Sometimes, whenever the prices reach these points, rather than dropping or rising (depending on if it's resistance or support) they seem to go above the resistance or below the support. This occurrence is known as price breakout
Example of price breakouts
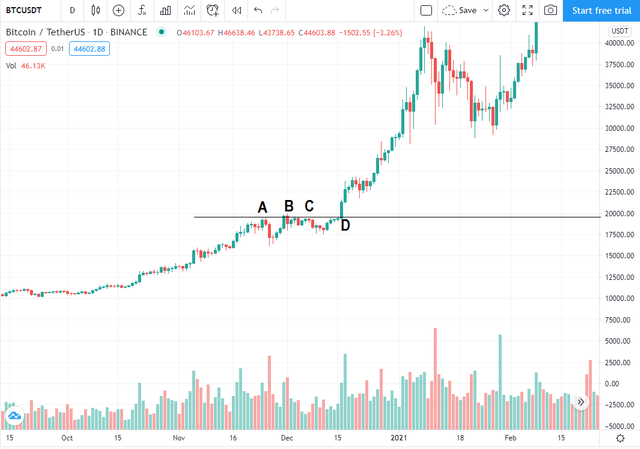
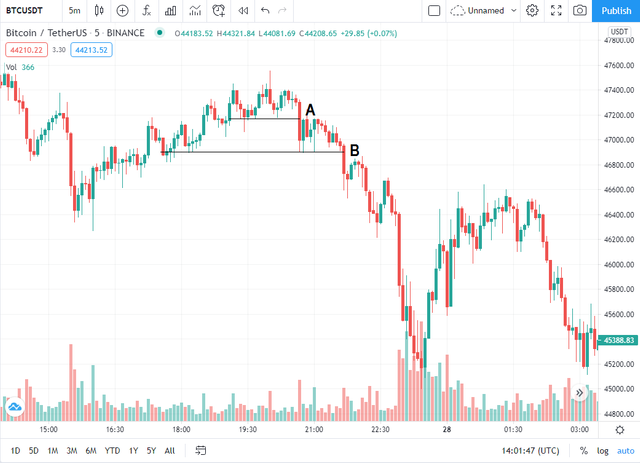
For the first chart, we see price breaking out at point D, moving above resistance, and in the second chart, we see price breaking out at points A & B, moving below support. These are examples of price breakouts.
In the first chart, the breakout price level (the price at point D) is ~$19,600.
In the second chart, the breakout price levels are
- For point A - ~$47,170
- For point B - ~$46,900
CONTINUATION PATTERN

The third question of this homework task will be answered as I explain continuation pattern. The question is
What is a Continuation Pattern? Explain with Candlestick Charts and mention the price levels.src
During the price breakouts, we can notice a pattern where the price seems to continue its movement until it moves above the resistance or it moves below the support. Consider the image below
Continuation patterns

At $19,000, the price of the assets continued in its upward trend and even broke through the former resistance point at point D and still continued moving up to ~$23,000.
This pattern is called a continuation pattern. In a continuation pattern, we find possibility of the price moving on in its current trend. Little wonder the pattern is named continuation. Identifying this pattern on the chart isn't more difficult than eating pizza. There are just two things to look out for, one is the higher high formation and the other is the lower low formation.
In talking about higher high and lower low formations, I'll be answering the fourth and fifth questions of this homework task. The fourth question is
What is a Higher High Formation? (Explain with one of the crypto coin charts where the Higher High Formation is identified.)src
HIGHER HIGH FORMATION
Perhaps, the name explains the terminology. A higher high formation is simply a high price formation(s) which is higher than the previous high price formation. The image below gives a visual insight.
Higher high formation on a BTC/USDT chart
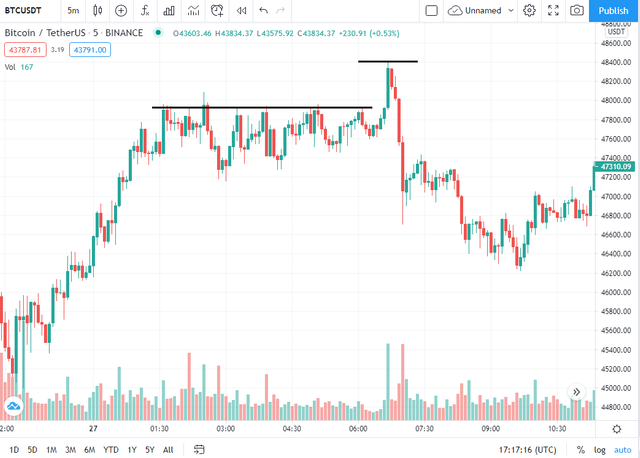
In the image above, we can clearly see a high above all the other previous highs.
What happens in the market at this point is that the buyers are more dominant and this leads to a surge in the prices. Note that the buyers bring the demand into the market and when demand dominates supply, price increases. So in the case of the higher high formation, the buyer s are dominant and the price is pushed back to the recent high and even further up.
Next question
What is a Lower Low Formation? (Explain with one of the crypto coin charts where the Lower Low Formation is identified.)src
LOWER LOW
A lower low formation is simply a low price formation which is lower than the previous low price formation(s). The image below gives a visual insight.
Lower Low formation on a BTC/USDT chart
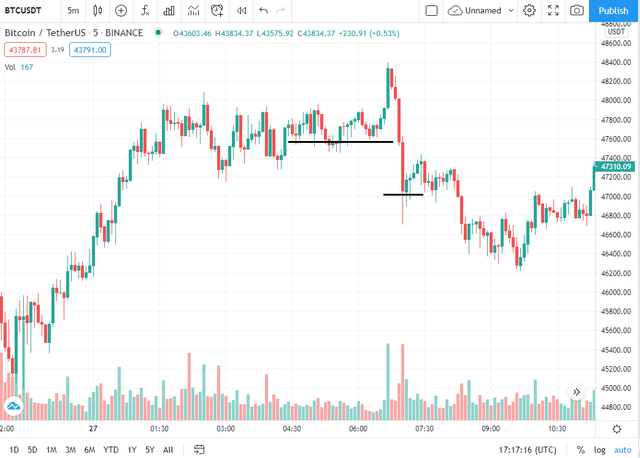
In the image above, we can clearly see a low below the other previous lows.
What happens in the market at this point is that the sellers are more dominant and this leads to a dip in the prices. Note that the sellers bring the supply into the market and when supply dominates demand, price reduces. So in the case of the lower low formation, the sellers are dominant and the price is pushed back to the recent low and even further down.
REVERSAL PATTERN

With this explanation of reversal patterns, I'll be answering the sixth question of this homework task which is
What is a Reversal Pattern?src
The reversal pattern is somewhat an opposite of the continuation pattern. Unlike the continuation pattern which shows the possibility of the continuation of a trend, the reversal pattern indicates that the current price trend might have come to an end and that the price movement will change direction.
Identifying reversal patterns is about as easy as identifying continuation patterns. You just have to look for double tops or double bottoms. These are patterns that preceed reversal.
Further explanation on double top and double bottom will answer the seventh and eighth questions of this assignment. The seventh question is
What is a Double Top Pattern? Explain with one of the crypto coin charts where the Double Top Pattern is identified.src
DOUBLE TOP PATTERN
It seems the name here also leaves a lot of hint on the meaning of this terminology. A double top pattern is a price formation where there are two consecutive price highs. The image below gives a visual insight.
Double top pattern on a BTC/USD chart
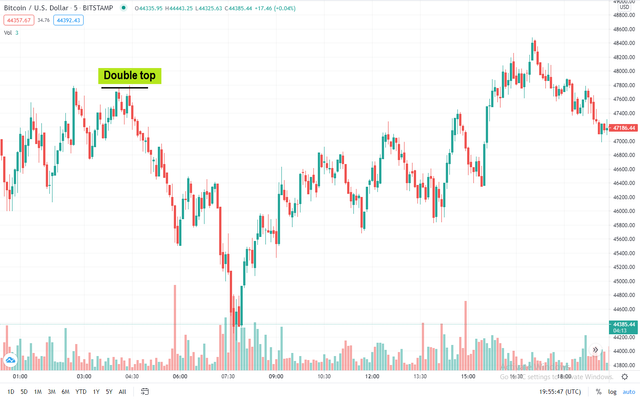
In the image above, we can clearly see a two consecutive highs close to each other.
What happens in the market at this point is that the price rises to the first high, then drops and rises again to the second high. Then, it seems the price is finding it difficult to surpass the level of the previous high, even if it does, it's not able to go significantly above it. As it struggles, it begins to fall. This indicates that the upward trend might be about to stop and the downward trend might be about to begin.
Investors who entered this market at the support level in between the double top can exit the market upon observing that a double top has formed on the chart. This is to prevent loss of assets.
Next question
What is a Double Bottom Pattern? (Explain with one of the crypto coin charts where the Double Bottom Pattern is identified.)src
DOUBLE BOTTOM PATTERN
A lower low formation is simply a low price formation which is lower than the previous low price formation(s). The image below gives a visual insight.
Double bottom on an ETH/USD chart
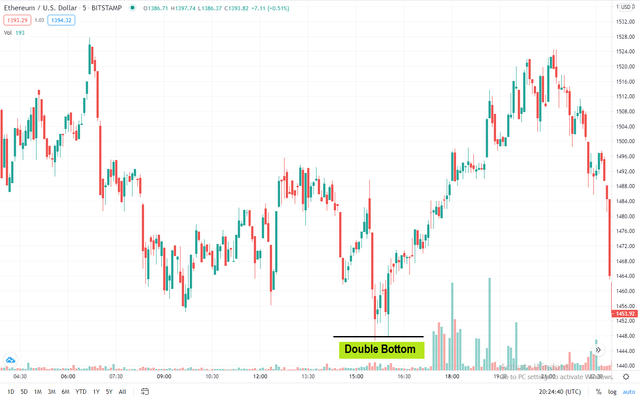
In the image above, we can clearly see a two consecutive lows close to each other.
What happens in the market at this point is that the price drops to the first low, then rises and drops again to the second low. Then, it seems the price is finding it difficult to go below the level of the previous low, even if it does, it's not able to go significantly below it. As it struggles, it begins to rise. This indicates that the downward trend might be about to stop and the upward trend might be about to begin.
Whenever this pattern is observed, investors who wish to, can enter the market. This is because of the possibility of the price reversing to an upward trend.
STOPLOSS

I'll be answering the ninth question of this homework task as I share my understanding of what stoploss means based on what I learned from the course. The question is
In Investing and Trading what is the importance of Stop Level (STOPLOSS)?
Where to find and how to set a Stoploss?src
Stop level or stoploss is simply an order you set (usually a sell order) at a certain price such that when the market price drops to that point, the order gets fulfilled and as such you exit the market. The importance of this kind of order is that it's done to prevent huge losses. When you have a stop level, you protect your investment from more loss even the price goes against you.
FINDING AND SETTING STOPLOSS
To find a stop level, simply look for at least 3 support levels and 3 resistance levels. Just like the image below
Stoploss on an ETH/USD chart
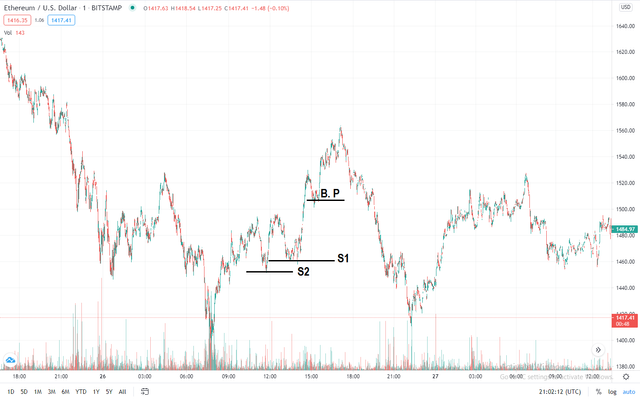
From the image above we have selected 3 support points - B.P, S1 & S2. Let B.P be our buy point, then the stoploss point can be set at the price level at support S2.
In my opinion, stoploss shouldn't be set at the support level closest to the buy point as you can have a Double bottom which could mean the start of a bullish. However, if the price drops to the level of the second support before the buy point, there is and indication of the possibility of a bearish market.
So, it is wise to set you stoploss at 2 support levels away from the buy point.
CONCLUSION

Chart patterns are very important technical details to study when making an investment or trading decision. They guide the investor or trader, ensuring that their profit is almost certain and/or their loss is limited. While it may sound like nerdy stuff, these concepts in chart patterns are not difficult to understand.
Continuation patterns tell you that a trend is likely to continue. This you can identify by a higher high or a lower low. While reversal patterns tells you that a price trend is likely to stop and go in the opposite direction. It can be identified by the presence of a double top or a double bottom on the chart. Stoploss ideally should be the second to last support level preceeding your buy point. This is set in order to limit losses when price action goes against you.
Thanks for reading.

Cc:
@steemcurator01
@steemcurator02
@steemcurator04
@stream4u



Hi @jehoshua-shey
Thank you for joining Steemit Crypto Academy and participated in the Homework Task 3.
Your Homework task 3 verification has been done by @Stream4u.
Thank You.
@stream4u
Crypto Professors : Steemit Crypto Academy
Downvoting a post can decrease pending rewards and make it less visible. Common reasons:
Submit
Thank you so much for your valuable comment. I ensured that my illustration images were captioned. Thanks once again.
Downvoting a post can decrease pending rewards and make it less visible. Common reasons:
Submit