Hello, great steemians, it's an honor to be here once again in the participation of this skillful and educative task, and I am glad to must-have gained a lot of knowledge from this wonderful course concerning the basic strategies with the use of harmonic patterns, let's continue.

Question 1
DEFINE IN YOUR WORD WHAT HARMONIC TRADING IS
Harmonic trading is simply the reoccurrence of past trends, this trading is waves that can predict the price direction of a market and are dependent on the Fibonacci retracement numbers. The market trade is reoccurrence to its previous pattern, both in bar height, opening point, and its closing point determining the theory of harmonic trading.
Harmonic trading deals with the repetition of historic candlestick pattern either an uptrend or downtrend motion after some percentage set back and impulses, these “setbacks” are also similar to each other in repetition, that is to tell you that everything happening in a market trade is a reoccurring signal from the past graphs. There is no new trend in the market but the repetition of past once.
As the setback disrupts the trend of the chart so are the (setbacks) similar to future and previous setbacks. The harmonic trading goes in hand with a technical indicator known as the Fibonacci retracement which we all know is based on the numerical sequence.
Fibonacci retracement:
The Fibonacci Retracement was invented by a man who was known as the most outstanding European mathematician during the middle age era, by name Leonardo Pisano known also as Fibonacci during the 13th century.
The Fibonacci retracement is a technical Indicator used in the determination of potential prices of the market Fluctuations. The number sequence was invented by adding the previous two numbers For instance; 0+1=1, 1+1=2, 2+1=3, tIll infinity.

Question 2
DEFINE AND EXPLAIN WHAT THE AB=CD PATTERN IS AND HOW CAN WE IIDENTIFY IT?
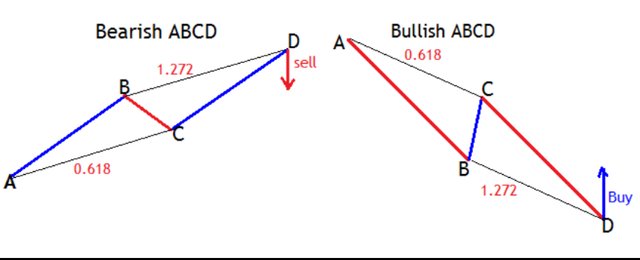
The AB=CD pattern helps Traders in the identification of price change in other to sell when the price is high and buy when the prices are low. This pattern together has a zig-zag structure With equal lengths (AB & CD)in both Bearish or Bullish directions.
This formula is a Harmonic pattern which aids traders in identifying price change in the market trend.
There is what we call the potential Reversal Zone (PRZ), and this is the Point “D” in a harmonic pattern that signals a reversal in price to the opposite direction. The PRZ is used by traders to Mark an entry point or exit point of trade on the AB=CD pattern.

Question 3
CLEARLY, DESCRIBE THE ENTRY AND EXIT CRITERIA FOR BOTH BUYING AND SELLING USING THE AB= CD PATTERN?
The entry point of the chart using the Fibonacci pattern is always at the “D” point of either the AB=CD bearish or AB= CD bullish which signals a change in the price direction of the market giving room for traders to either buy when the price is low and sell when the price is high, but must get to the “D” point of the Fibonacci pattern.
Setting up your stop loose and take profit to be 2% equal, for the stop loss, 2% below or above your entry point depending on whether you are to sell or buy and for your take profit above or below you buy point and sell point respectively.
For the exit signal This is similar to that of the entry point but opposite, with the addition of stop loss and take profit, just as explained in the entry point. This pattern signals when to leave a market, traders must be adhered to the technical analysis used in the Fibonacci pattern to end trading

practice (Question 1)
Entry point for uptrend :
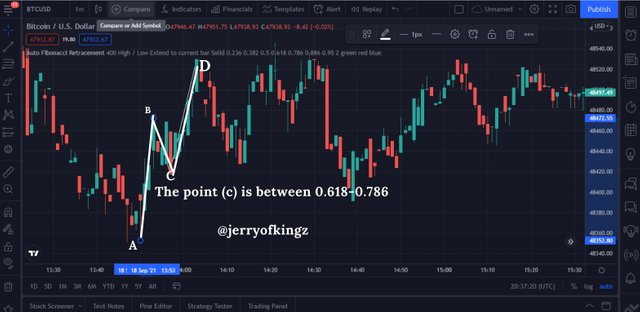
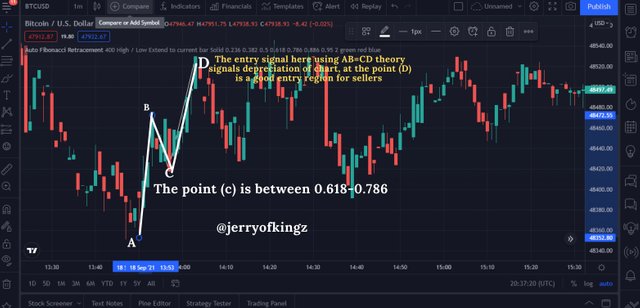
From the image below, I was trading on the BTC/USD. The entry point Was determined by the “D” point. Which after that, I waited for the formation of the next candlestick which was the bearish signal, and I made that my entry point.
This was since I observed the rules of the Fibonacci technical indicator theory to sell after the formation of the next candlestick is bearish. making sure that there were no repetitions of the pattern line AB at CD, also I checked the Fibonacci ratios if actually in place of correlation to its point.
Entry point for downtrend:
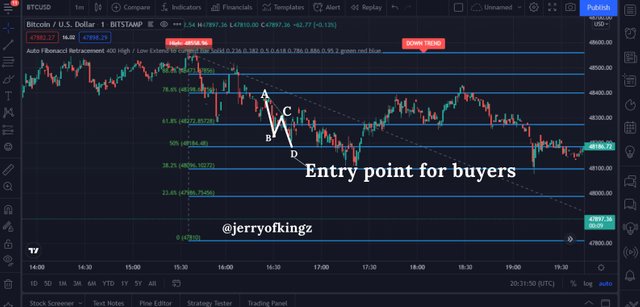
I identified the AB=CD pattern and then marked my point “D” which is the basic core of making entry into the market and I waited for the formation of a bullish candlestick which is a go-ahead to make entry, the illustration below

CONClUSION:
Harmonic trading which consists of a great technical indicator like the Fibonacci is not to be depended on without further use of other technical analysis and indicators, and it is advisable to make use of correspondent analysis that suits your pattern of trading. A great course indeed and I am happy to must have gained some knowledge on harmonic trading and Fibonacci retracement.
Thanks for reading.


