Price forecasting is a predicting commodity or service price which evaluates various factors like it characteristics,demand, offers from numerous suppliers etc.
In crypto, we can define price forecasting as the prediction of the price of a certain crypto coin at a given time in the future.forecasting crypto price allow you to greatly increase your earning.Crypto investment and trading are like a game in which winning or losing is determined based on market factors like demand and price.
These factors sometimes have to be determined quickly,even in a matter of minutes or even in a few seconds.Things in the crypto world moves very fast and you must be prepared for this when performing a crypto research in order to predict crypto currency prices and recognize trends.
WHY IS PRICE FORECASTING NEEDED?
Price forecasting is needed in order to get full information and not tomose in one's trading take for example if you know the price forecast of a coin like Bitcoin will below at a certain period of time this could enable sell that coin because it will not any tangible profit.
Also, it solve problems but not by a single approach and definitely not fir all conditions of the market, This is because when it comes to complex entities llike financial markets,All essential move are wrong but some or most are useful.
METHODS OF PRICE FORECASTING
Since the price of Bitcoin skyrocketed, the hype about digital currency has continued. Every day there is information about new digital currencies, some of them are proven to be scams, and some will become the new top currencies in a few months. Coin speculators usually buy and sell for a rumor. Naturally, some people try to use machine learning to analyze the price changes of digital currencies to find out the factors that affect the price changes of digital currencies
One of the best method of a trading strategies devised upon a machine learning techniques which comprises of linear models, random forex and so on.This model are validated in a period which is characterized by unexpected turmoil and tested in a period of bear markets, allowing the assessment of whether they are good prediction even when the direction changes between the validation and test period.
The classification and regressio method use attributes from trading , network activity for the period of over 4years
Fir the test period,five out of 18 individual models have success rate of less than 50%.The trading strategies are built on model assembling.The ensemble assumings that five model produce identical signals achieves the best performance for Ethereum and litecoin with an annualized sharp ratio of 80.17% and 91.35% respectively..These positive results support the chain that machine learning provides robust techniques for exploring the casting of crypto currency and for devising profitable trading strategies under the adverse market.
CRYPTO ASSETS CHART GRAPH AND PRICE FORECASTING
Crypto currencies are forecasted by getting real time crypto currency data, preparing data for trading and testing, predicting the price of the currency using LSTM,We will use a long short-term memory (LSTM) model, which is a specific model in deep learning that is very suitable for analyzing time series data (or any time/space/structure sequence data, such as movies, sentences, etc.).)neutral network and visualising the forecasting results .
There are some forecasted currencies like the forecast for Bitcoin for this year according to a research is 78.4% which is over $47,672.16.According to smartereum feature it was reported that the ripple value by 2030 will be between $200-$300,while wallet investors claim that ripple will not reach $5 over break $1 gain.


It is necessary to have the knowledge on how to read crypto currency chart,This is an important skill in crypto trading whether it is a day trading, swing trading ,scalp trading and any among others.Crypto is highly volatile which makes it price unstable in a wide range.it is crucial to know how to read crypto chart properly especially as a novice who wish to start
making funds from it.It can be shown with various time frame depending on your time (1 hour,1 week and so on)
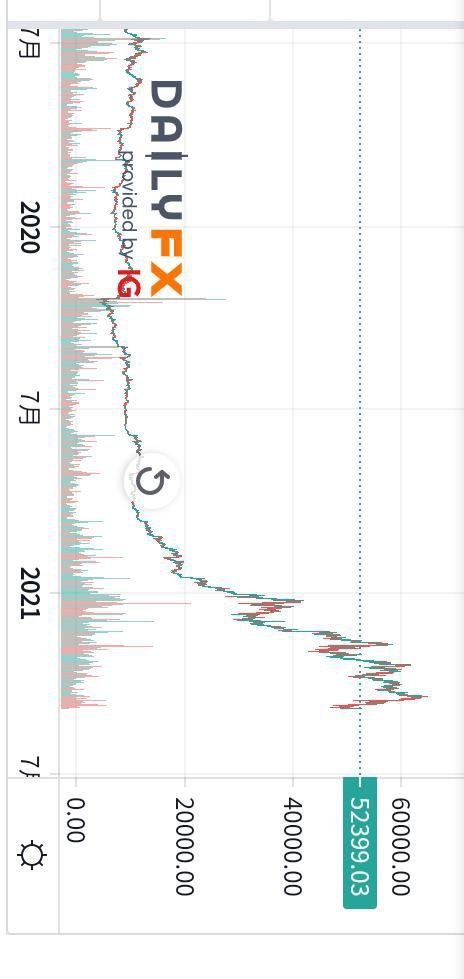
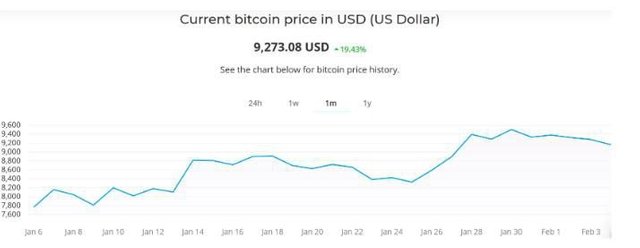
There are several types of Bitcoin charts, the most common of which is the basic line chart.The line chart is a simple graph of the relationship between price and time, which reflects the Bitcoin price in any historical period.
The first chart sent is an example of a Bitcoin price line chart , which reflects the Bitcoin price in the last week of November 2020. The Y-axis of the chart represents the price per bitcoin, the X-axis represents time, and the price line is composed of closing prices.
The accuracy of the chart depends on our degree of breakdown of time. This type of chart can provide limited information. It is a good visualization tool for simple understanding of prices, but many traders prefer more detailed charts to make more accurate investment and trading decisions.
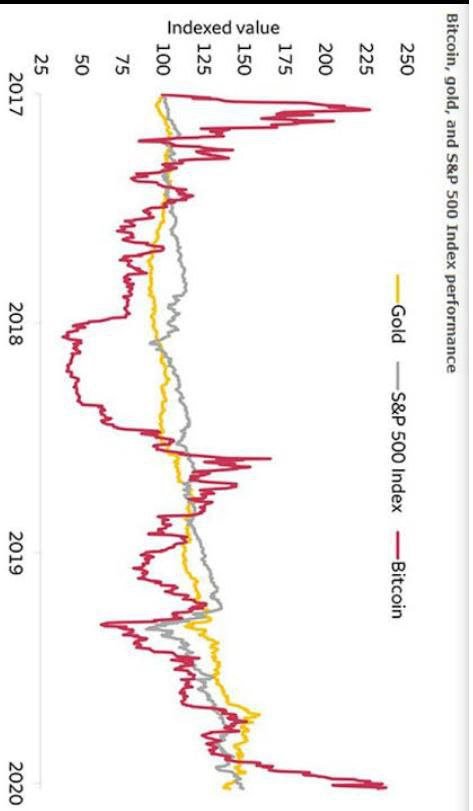
There are other chart that provided also explain how the Bitcoin has the higher bulk market (which means values of the coin is high) than the bear market(which means the value of the coin is low ).There are different analysis that at looked into when forecasting like the
Technical analysis : This analysis believe that what happened in the past will influence the future market movement.it is a basic technique in reading crypto currency chart.
Fundamental analysis: This analysis is all about examing factors that could have an effect on the currency price
Sentimental analysis:This analysis makes a currency volatile on a day to day basis.
Hi @jessica999
Thank you for joining The Steemit Crypto Academy Courses and participated in the Week 10 Homework Task.
Your Week 10 Homework Task verification has been done by @Stream4u, hope you have enjoyed and learned something new.
Thank You.
@stream4u
Crypto Professors : Steemit Crypto Academy
Downvoting a post can decrease pending rewards and make it less visible. Common reasons:
Submit