
I’m very excited to attend your lecture. Last season was great and I hope you continue to deliver like the previous seasons. This week’s lecture is about Trading with Strong, Weak and Gap Levels a topic I enjoyed very much. After reading the lecture notes and doing some research I present my assignment post for this task.
Q1
Graphically, explain the difference between Weak and Strong Levels. (Screenshots required) Explain what happens in the market for these differences to occur.
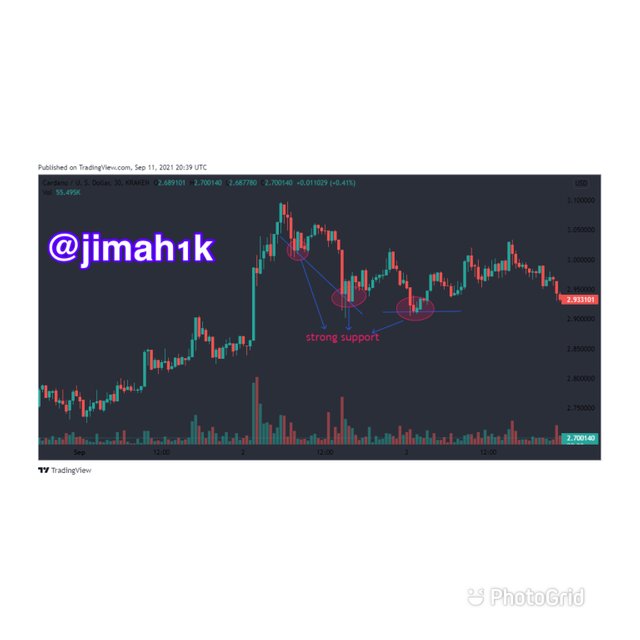
I actually didn’t know they were different types of supports and resistances until this lecture, after making Research and studying the notes given by the professor I found out that we have strong support levels strong resistance levels. However these resistance levels are more reliable than the other this means that the some levels affect the price of the asset. Let’s take a look at some graphs to clearly understand the types of weak and strong levels.
Strong support level
Below is the screen shot of a strong resistance level
Strong resistance level
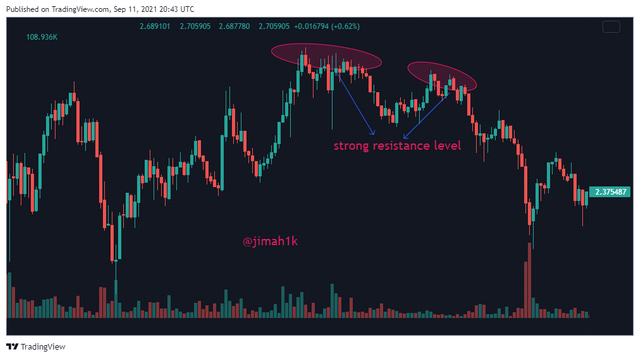
Now i am going to explain what the strong resistance and the support level is. The strong resistance level refers to the level the assets finds it hard to exceed as you can see from the screenshot above the assets price is hasn’t exceeded the circled region that is where the resistance is likewise the support level is where the price is the asset doesn’t fall below. Identifying strong resistance level and support level helps traders to know when to enter a trade and they right time to exit a trade. Strong resistance is as a result of a lot of traders who have placed buys orders. The same applies to the support when traders place sell orders it at a large quantities influences a strong support
Weak support level
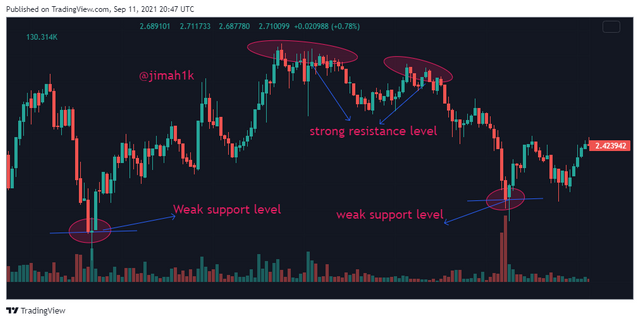
This occurs when the resistance and support are broken. Now the big question is how are they broken? When traders place either a buy or sell order in the market in smaller quantities and the price of the asset reaches that sell or buy order, since they are in small quantities they get executed and when the price of the asset hits the same level again since all the orders have been executed they aren’t any orders hence the support or resistance is broken.
Lets look at the differences between the two levels
1 - For strong levels like the strong support and resistance the traders mostly place either the buys and sell orders in larger quantities whiles the weak support and resistance level traders place the buy and sell orders in smaller quantities.
2 - The strong support and resistance shows that the price of the asset might go in a bullish trend whiles the weak support and resistance can shows the assets price might go in a bearish trend
3 - The direction of the bounced trend moves in a longer direction in the strong support or resistance whiles the direction of the bounced trend moves in a short direction in the weak support or resistance.
Q2
Explain what a Gap is. What happens in the market to cause It.
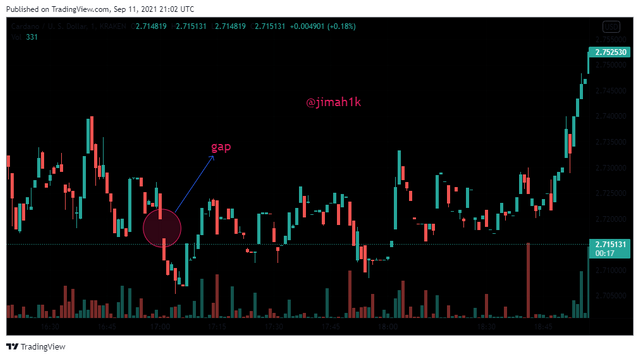
A gap in crypto market is just a space left between two candles such that the closing price of the preceding candle jumps to the opening price of the next candle. One might ask how does this occur?? Well this can occur when there is no trade that has been recorded at that particular time thereby creating that space left in between. The are three types of gap namely Breakaway Gap,Runaway Gap and Exhaustion Gap. Below is an illustration of a gap.
Q3
Explain the types of Gap (Screenshots required, it is not allowed to use the same images of the class).
In this task i will be explaining the types of gaps i mentions earlier which are Breakaway Gap,Runaway Gap and Exhaustion Gap. Let’s start with.
Run away gap
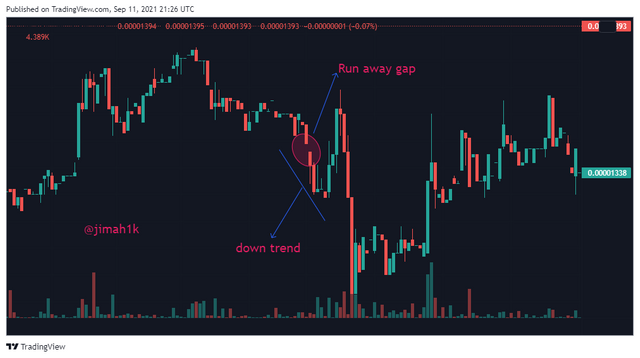
This type of gap are very difficult to spot due to their young nature they are often spotted in the middle of trends from the chart above you can clearly see that the candle has skipped or jumped to the other candle creating a gap however this gap is still young and can easily be mistaken for a breakaway gap.
Break away gap
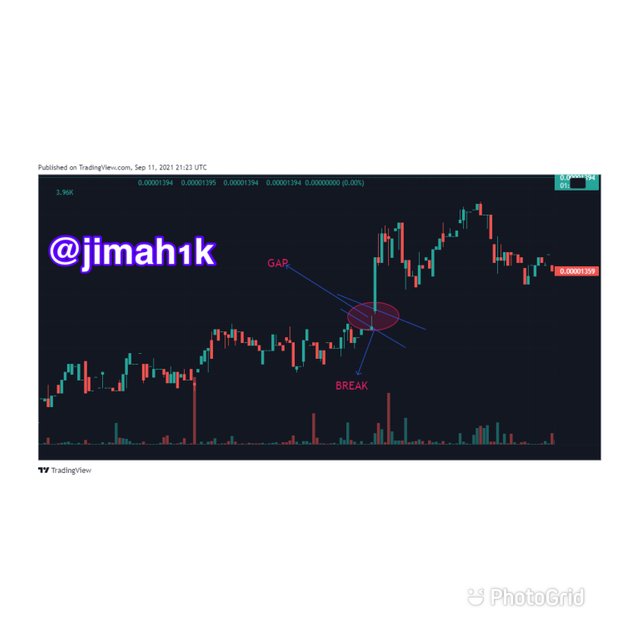
As the name suggests this is when there is an absolute breakout of the price of the previous trend this can be either the trend is in a downtrend and breakout and goes in an uptrend or from a uptrend and it breaks out to a downtrend. From the screenshot I provided above the candle jumped to the other candle breaking out from its current state by doing so creating a gap called the break out gap.
Exhaustion Gap
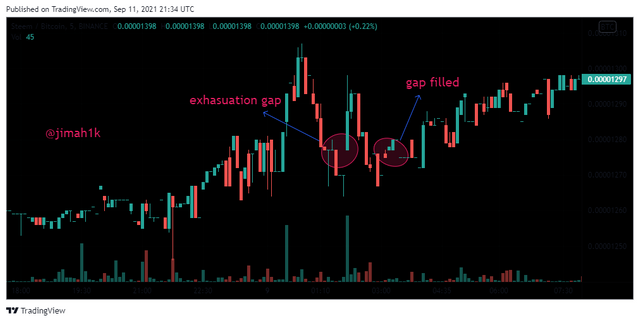
This is also another gap which is very difficult to identify as it is often mistaken for the runaway gap to be able to identity it effectively you have to wait for the movement to pass before you can identify this type of gap. The gap left by the candle in the other direction is mostly filled in the opposite direction as can be seen from the screenshot above.
Q4
Through a Demo account, perform the (buy/sell) through Strong Supports and resistances. Explain the procedure (Required Screenshots).
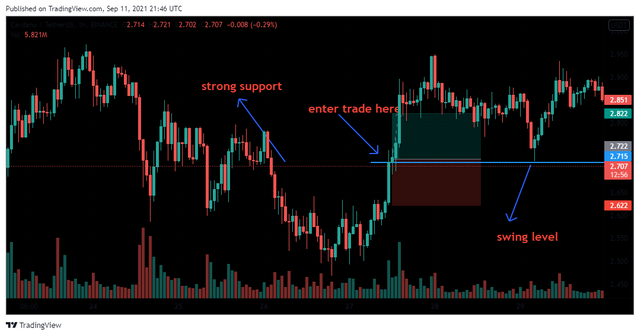
For this task I will be performing a buy order using the STEEM/BTC pair and set my time frame to 5mins. Identified my strong support In the case there is breakout of a strong support level, the entry buy is established at the swing point, and a stop loss is set just at the expired support. I set my stop loss and take profit to the ratio of 1:1 so that my risk won’t over power my reward.
Q5
Perform the (buy/sell) through Gaps levels
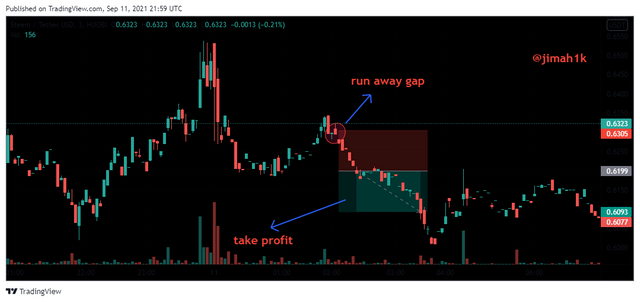
I placed a sell order for STEEM/BTC and set my timeframe to 5 mins I then spotted the run away gap a saw that it was going to downtrend I placed a stop loss and take profit with ratio of 1:1. As the professor tightly said it is ideal to use 1:1 or 1:2 ratio in other not to run at a loss.
conclusion
This has been an informative lecture and I want to thank the professor for this wonderful lecture I have really learnt a lot. What i want to add is that the strong resistance are as a result of the high number of traders who have placed a buy order. And the sting support is as a result of traders who have placed large number of sell orders. This implies to the weak levels, weak resistance implies small quantities of buy orders place and weak support shows small quantities of sell orders place.
It is very important to note the three types of gaps which are the run away gap, breakout gap and the exhaustion gap. For the exhaustion gap it is advised to wait for the movement to pass before you can identify the gap.
Wow Great
.
.
Get free upvote worth 0.17$ If you use our service | Triple 3x Your coins and Get Free Upvotes | How you may triple your coins : CLICK HERE
Downvoting a post can decrease pending rewards and make it less visible. Common reasons:
Submit
Hello @jimah1k Thank you for participating in Steemit Crypto Academy season 4 week 1.
Downvoting a post can decrease pending rewards and make it less visible. Common reasons:
Submit
Good presentation @jimah1k.
Thanks for your participation in the crypto Academy courses.
Downvoting a post can decrease pending rewards and make it less visible. Common reasons:
Submit
Thank you 🙏.
Downvoting a post can decrease pending rewards and make it less visible. Common reasons:
Submit