
It’s another week of this season cryptoacademy and I am very happy to be here once again to participate, after reading the lecture notes and doing my own research I will present solutions to the questions asked.

Explain Head and Shoulder and Inverse Head and Shoulders patterns in details with the help of real examples. What is the importance of voulme in these patterns(Screenshot needed and try to explian in details)

For someone or a trader to be very successful in the cryptospace, there is a need to analyze either the patterns of the asset your are to trade on or you use certain indicators that will help you to determine the future price of the asset.
Most of these patterns differ depending on the circumstances that trigger their formation, today I will be talking about two types of patterns the Head and shoulder pattern, inverse head and shoulder pattern. I will explain what entails about this types of patterns and how they are formed. Your absolute attention is needed.
Head and Shoulders Pattern
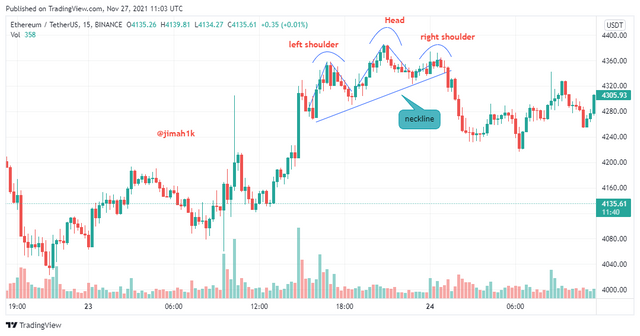
Actually this pattern drives it’s name from how the human head and shoulders are, that is to say the head stands tall whiles shoulders are adjacent the head.(you will understand better from the screenshot below) Now in crypto, the head and shoulder pattern is mostly used by a lot of traders to determine when a bullish trend or an uptrend is about to enter a bearish trend/downtrend.
The head and shoulder pattern comprises of three parts namely; The right shoulder, The left shoulder and the head, the left shoulder of the pattern is formed when there is an uptrend in the price of an assets a possible cause can be at that instant a lot of people purchased the asset. After the traders have made their profit, the opt out and a the price begins to fall so the left shoulder will be formed when the price of the asset rises and falls to neckline.
The next part to be formed is the Head after the the price of the assets falls in the right shoulder, the price of the asset begins to rise again but this time it records a price which is higher than the price of the left shoulder.
The right shoulder is formed when the price of the assets rises and tries to be able to match up to the price of the the head but rather fails to reach that price. The price of the right should is almost at the level of the left shoulder.
Inverted Head and shoulders pattern
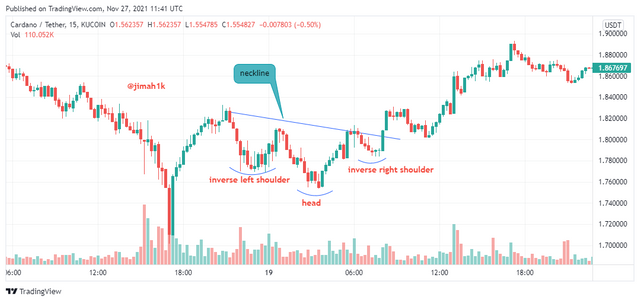
With this type of pattern it is just the opposite of everything I said about Head and shoulders pattern. Likewise this pattern is also made up of The right shoulder, The left shoulder and the head, the left shoulder of the pattern is formed when there is an downward trend in the price of an assets a possible cause can be at that instant a lot of people opted out of trade. After sometime the price of the asset begins to rise again. so the left shoulder will be formed when the price of the asset falls and rises above neckline.
The next part to be formed is the Head after the the price of the assets rises, it is followed by a fall which is lower than the previous low of the left shoulder.
The right shoulder is formed when the price of the assets rises and tries to be able to match up to the low price of the the head but rather fails to reach that price. The price of the right should is almost at the level of the left shoulder.

What is the importance of voulme in these patterns

Volume has a great deal in influencing patterns in general not only this pattern because they determine how the pattern would look like. Let’s talk about how volume influences the head and shoulder pattern.
In the head and shoulder pattern, it is observed that the left shoulder is on the rise this is as a result of high volume at that time let’s say when a lot of traders jump into buying of an asset, adding volume to that asset can cause the rise of it.
Normally after traders feel like they have made enough profit, they sell their asset thereby reducing the volume of the asset this has caused the left shoulder to fall to the neckline right after rising.
The head of the pattern is also formed when a lot of volume(the volume greater than the volume in the shoulder pattern) is added to the asset you can also say assuming 1million traders bought the asset in the shoulder pattern and after the decline 2million traders bought the asset again you should see the uptrend higher than the previous uptrend causing the head of the pattern.
So I hope you get the trend of how the volume affects these patterns, to wrap everything up when there is high volume the pattern tends to increase or be in an uptrend likewise when there is a lower volume the price of the asset will decrease creating a lower trend. This is mostly affected by how or the number of traders who decided to opt in and opt out of a trade.
When you look at how volume affects the inverse head and shoulder pattern it’s just the opposite of how the volume affects the head and shoulder pattern. The left shoulder downtrend is as a result of the low volume in trade, which is later followed by an upward trend which possibly is as a result of high volume. The head of the pattern is formed when the price of the asset falls even lower than before due to lower volume of trade. Which is later followed by an increase in volume resulting to an uptrend. The formation of the right shoulder is as a result of a decrease in volume.

Q2 : What is the psychology of market in Head and Shoulder pattern and in Inverse Head and Shoulder pattern (Screenshot needed)

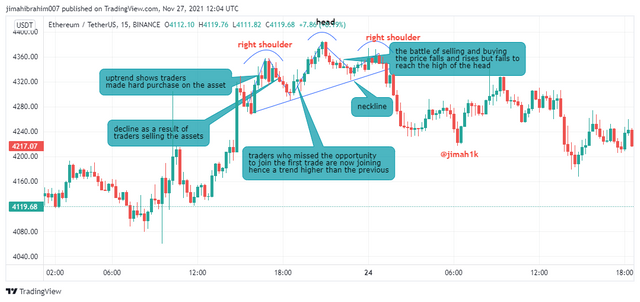
The psychology market in the head and shoulder pattern, as I have already made mention the left shoulder is on the rise as a result of a lot of traders buying the asset this increases the volume of the asset and as I have said the volume will determine the trend of which the pattern will take so we see from the screenshot the trend is rising, which is followed by a decline causes of this is that the traders who feel that they have made profits will start selling their asset reducing the volume which will also result in a downtrend. This is where the left shoulder is formed.
Traders after realizing that the potential of the asset, start to invest in the asset again now in this phase traders who didn’t know about it from the start will also join in buying the asset greatly increasing the volume of the asset which will result in an uptrend which will be higher than the previous high seen in the left shoulder. This pattern forms the head traders again will feel that they have made profit and will decide to opt out of the trade which will cause a reduction in the volume creating a downtrend.
New traders who missed out on the previous opportunity will join the trade in hope to create a new high but is new high that will be attained will not reach the high of the head this will form the right shoulder.
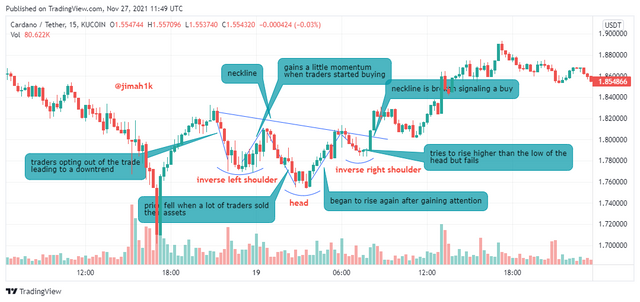
Let’s talk about the psychology market of the inverse Head and shoulder pattern, unlike the head and shoulder pattern. It starts with a decline or a downtrend because traders will be trying to cut their losses by selling the assets. Traders will also be joining the buying so its a battle of buying and selling when the buyers overpower those selling it increases the volume of the asset thereby making it to rise this will create the left shoulder.
With the same mindset, the traders opt out after making some profit and fear that the price of the asset will sink the rapid movement of the traders out of the trade will cause the reduction of the volume. This is where a lot of traders will panic and fear that if they don’t sell, they would lose everything. After that sharp decline, the head is formed when the price begins to rise after the heavy fall when traders start entering the trade and it begins to rise, more traders join in increasing the volume, from the screenshot you will see that the price is in an uptrend. The right shoulder is formed when the price starts declining because the will be a battle between the sellers and the buyers the price is not able to fall to the low that was recorded around the head but instead falls at its own low.

Q3 : Explain 1 demo trade for Head and Shoulder and 1 demo trade for Inverse Head and shoulder pattern. Explain proper trading strategy in both patterns seperately. Explain how you identified different levels in the trades in each pattern(Screenshot needed and you can use previous price charts in this question)

I will be explaining a demo trade for the head and shoulder pattern, I will try to make it very simple and understandable below are the steps.
1 - To be able to perform the trade on any cryptocurrency of your choice you will need to identify the pattern which is the head and shoulder pattern
2 - It is mostly advised by expert traders to set smaller time frames I will demonstrate using 15minutes.
3 - I will be using ETH/TETHER pair as you can see I have indicated the formation of the left shoulder, the head and the right shoulder
4 - I will draw my neckline, when the neckline is broken you can enter a sell entry
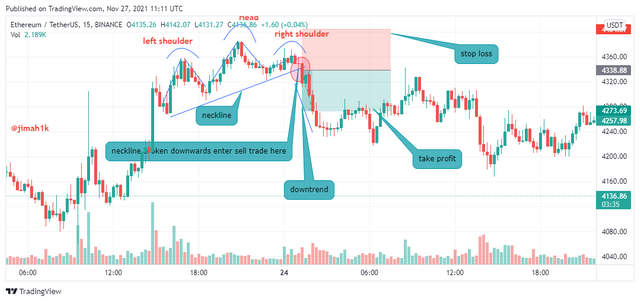
From the screenshot above, it can be clearly seen that the neckline is broken downwards this is a clear sign of a sell entry so I placed a stop loss at a risk to reward ratio of 1:1 right after the broken neckline in other to set the take profit, you will have to subtract or find the difference of the price at the head and the low of the right shoulder. The price you get will be subtracted from the price at the neckline.

Trade for inverse head and shoulder pattern

1 - To be able to perform the trade on any cryptocurrency of your choice you will need to identify the pattern which is the inverse head and shoulder pattern
2 - It is mostly advised by expert traders to set smaller time frames I will demonstrate using 15minutes.
3 - I will be using CARDANO/TETHER pair as you can see I have indicated the formation of the left shoulder, the head and the right shoulder
4 - I will draw my neckline, when the neckline is broken you can enter a buy entry
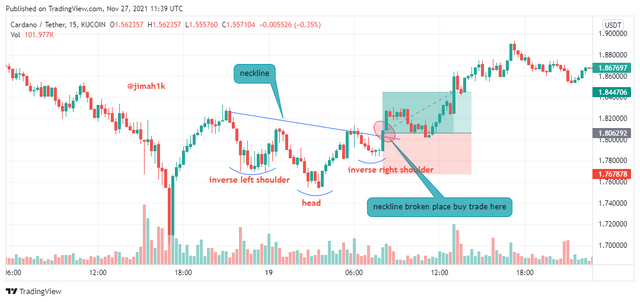
From the screenshot above, it can be clearly seen that the neckline is broken up this is a clear sign of a buy entry so I placed a stop loss at a risk to reward ratio of 1:1 right after the broken neckline in other to set the take profit, you will have to subtract or find the difference of the price at the head and the low of the right shoulder. The price you get will be subtracted from the price at the neckline.

Q4 : Place 1 real trade for Head and Shoulder(at least $10) OR 1 trade for Inverse Head and Shoulder pattern(at least $10) in your verified exchange account. Explain proper trading strategy and provide screenshots of price chart at the entry and at the end of trade also provide a screenshot of trade details. (Screenshot needed.)

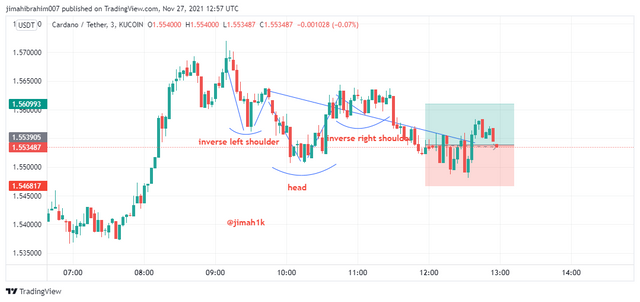
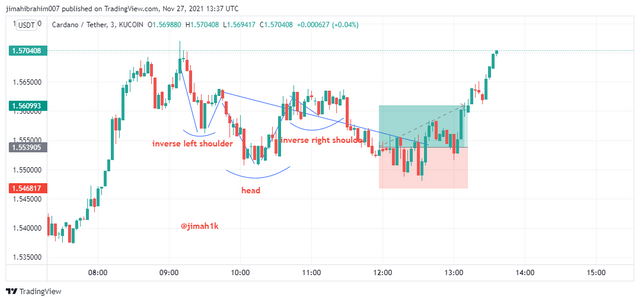
I will be performing a real trade of CARDANO/USDT set time frame to 3mins I will be using the inverse head and shoulder pattern strategy.
From the chart, we observed and spotted the formation of the inverse head and shoulder pattern as seen below. My neckline was then drawn so as to wait for the break of the neckline and then execute my trade.
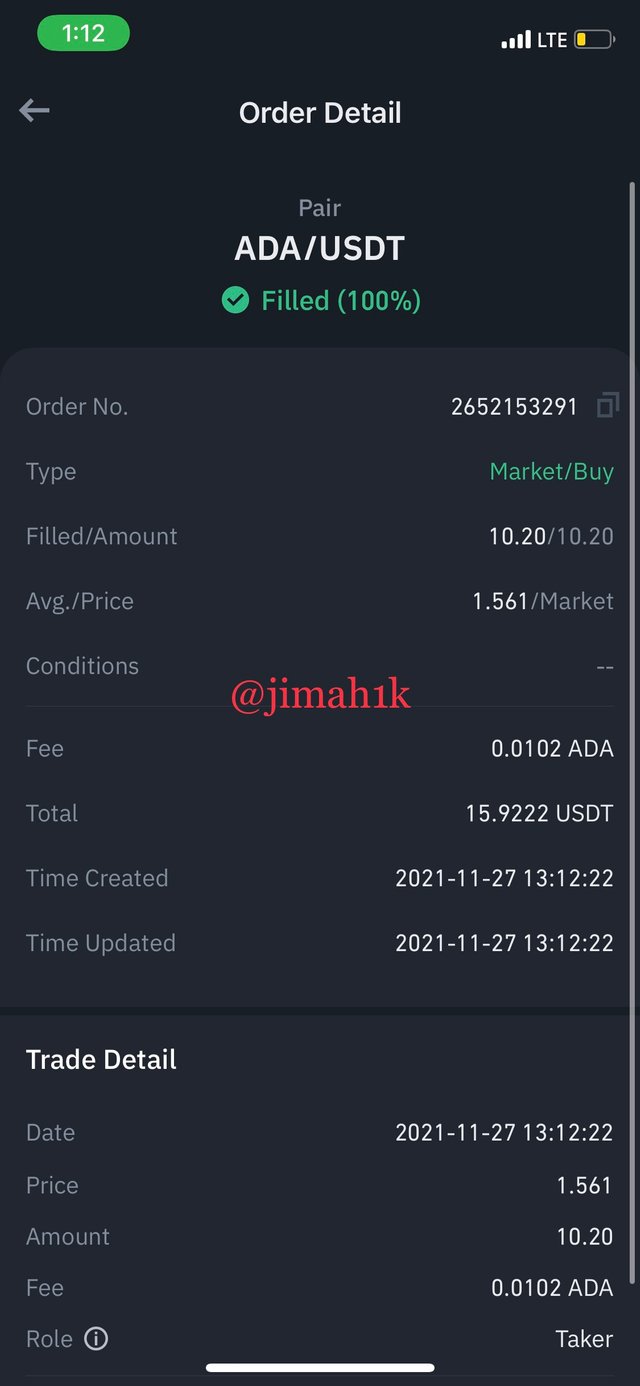
the price of the asset broke the neckline up, I carried out a buy order of 10cardano I placed my stop-loss at where the neckline was broken. The stop-loss was placed at $1.54 and the take-profit was calculated to be $1.56.
I used my phone to perform the buy trade, sorry for not providing the first screenshot I missed it this is the transaction details which contains everything you need.
After a while, the price the asset dipped a little bit as a result of some traders exiting trade maybe as a result of fear or so just after the dip the price of began to increase breaking the neckline completely triggering the take profit of 1.56 this is also as a result of many traders joining in buying of the asset. See screenshot below

Conclusion

In other to successfully trade without making significant losses you need to study the patterns very well because if you don’t pay attention to some petty petty things you will end up trading at a loss. The head and shoulder pattern is made up of three parts as our professor right mentioned the left shoulder after the rise of asset fails back when traders exit trade. After falling rises back but this time even higher than the previous high of the left shoulder forming the head of the pattern, which is followed the formation of the right shoulder which tries to reach the same high of the head but fails at some point.
The inverse head and shoulder pattern is just the opposite of what is said. Thank you professor for this wonderful lecture

please note that all unsourced images are from TradingView
