Introduction
Hello steemian,am very happy to be part of this wonderful lecture about analysis and trading indicator I hope to pit my very best and I also thank prof @lenonmc21 for the wonderful lecture.

Question 1
Define in your own words what is the Stochastic Oscillator?
Answer
Stochastic oscillator is an analysis tool used in cryptocurrency trading,it was being developed by George Lane first in 1950s.
It is always between the range of 0 to 100.it is also made up of 2 lines in which one of the lines shows the actual volume of the oscillator for each session while the second line shows the three days moving average.
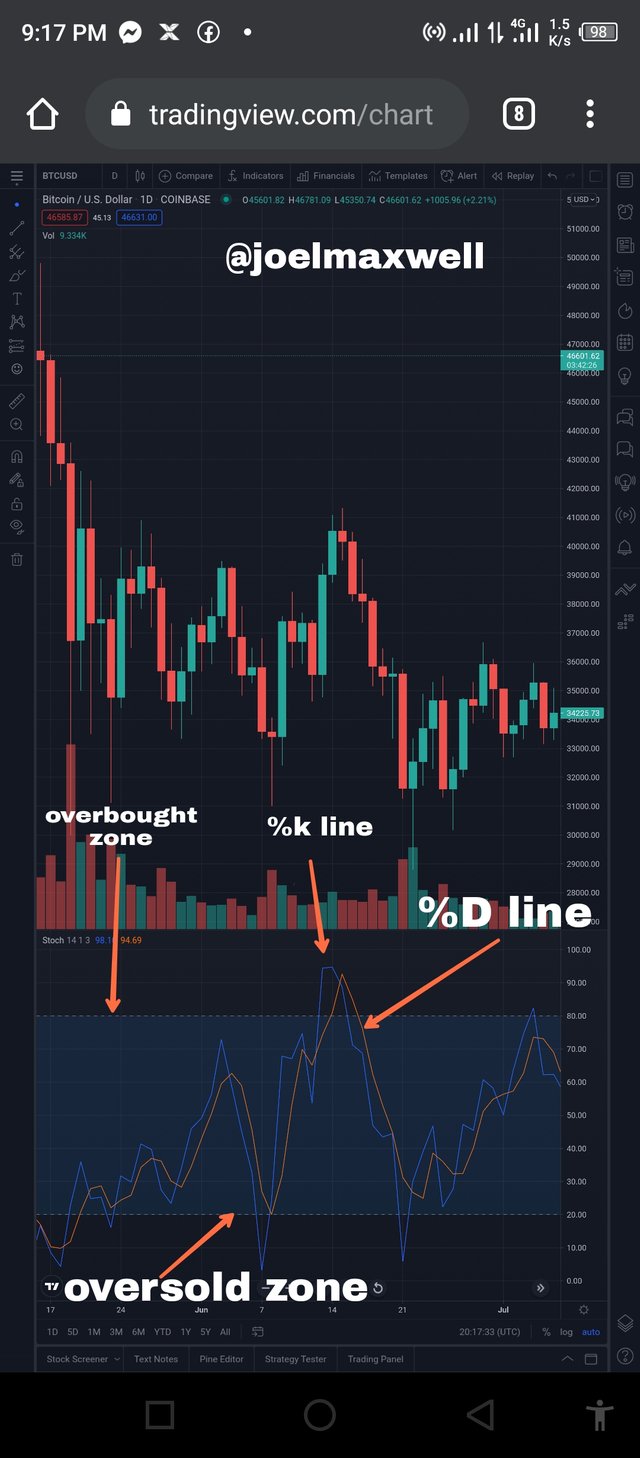
The stochastic oscillator is also called after the developer Lane's oscillator,and it is a tool used also in the determination of overbought(this is when the line is above 80 and this is the best time for traders to sell their assets) and oversold(when the line is below 20 and this is the favourable time for traders to buy assets).
The tool help trader in minimizing lost in the market and maximizing profits because it will enlightened them when is the best time to enter and exit the market.
The tool is very easy for traders to understand with a very good degree of accuracy,it also shows trader a change in momentum on a daily basis.

Question 2
Explain and define all components of the stochastic oscillator (% k line,% D line + overbought and oversold limits).
Answer
% k line
This is a component of stochastic oscillator and is known to be very faster than the D line,it is normally display in a solid line and also the main line.it is also used in the measurement of the closing price for the day and compared to a specified look back period.we also use this line to create the second line which is D line.it can also cross and mover to the second line(D line) meaning that they market is profitable at a very fast rate.
It also has a formula
           (CP-LP of N periods)
    100 ×   -----------
          (HP of N period -LP of N periods)
Where CP = closing price
LP = lowest price
HP=Highest price
100= constant
%D line
This is another components of the stochastic oscillator,it was created from the first line which is the k line,this line is not as fast as K line it is a dull line,and is being represented by dotted line.it is the moving average of %k line.ut can also be known as stochastic slow.it is here major signals are being generated.
Formula for % D line below
%D =3 - period moving average of % k

Question 3
Briefly describe at least 2 ways to use the Stochastic Oscillator in a trade.
Answer
Entry signal in the market
The stochastic oscillator is being used in trading by traders to know when it is favourable for them to enter the market and avoid lost of assets.
Here the trader must watch the price chart when he sees the %k line cross the dull stochastic(% D line)and keep moving up it is a signal that the market is cheap and traders can enter.
Exist signal in the market
It is used here by traders to know when it is favourable for them to sell their assets and exist the market with profit.
Here the trader must watch out for when the %k line is moving across the %D line and keep moving downward.it us a signal that the trader should leave.

Question 4
Define in your own words what is Parabolic Sar?
Answer
Parabolic sar is a very useful technical indicator that was developed by J.Welles. Wilder, jnr.it helps trader to know about short term momentum of price assets.
It can also be called PSAR meaning parabolic stop and reverse.
It is represented in dot on the price chart,it also helps the traders to know if he or she have to start trading or quit trading and seek for an alternative direction and by this will enable the trader minimize loss.(entry and exits point in the market.)
It is best used in market that are trending.it also shows trader that the can be a possible reversal in the price of assets.

Question 5
Explain in detail what the price must do for the Parabolic Sar to change from bullish to bearish direction and vice versa.
Answer
from bullish to bearish direction
The parabolic sar has I explained is a tool that is being represented by dotted line in the chart and for it to move from the bullish to bearish direction.
This mean the dotted line appears below the candlestick meaning the trader at this point can buy assets(bullish trend) and when it change from it current position from below the candlestick to above the next candlestick,it shows that the trader can sell assets(bearish trend).
From the explanation,it means for it to move from bullish to bearish direction the parabolic sar must move from below the candlestick to above the next candlestick.
from bearish to bullish direction
As explained earlier in the movement from the first movement.The bearish to bullish direction is an inverse of that meaning This mean the dotted line appears above the candlestick meaning the trader at this point can buy assets(bearish trend) and when it change from it current position from above the candlestick to below the next candlestick,it shows that the trader can sell assets(bullish trend).
From the explanation,it means for it to move from bullish to bearish direction the parabolic sar must move from above the candlestick to below the next candlestick.

Question 6
Briefly describe at least 2 ways to use Parabolic Sar in a trade?
Answer
Buying and selling signal
We make use of the parabolic sar in knowing when we can buy and sell asset,as I explained earlier that the Psar is represented in dot.for buying signal it is when the dotted line are below the candlestick and we are signal to sell when it is above the candlestick.for the identification of bullish and bearish trend
We use the parabolic sar in identifying the two types of trends(bullish and bearish trend).
We identify the bearish when the psar (dotted line ) is above the price of assets and identify the bullish trend when it is below the price of assets.
PRACTICAL(make use of your own image)
Question 1
show a step by step on how to add the Stochastic Oscillator to the chart (Indicating the% k Line and the% D Line, the overbought and oversold zone.
Answer
In order to add stochastic oscillator to the chart,I will make use of my tradingview application
Step 2
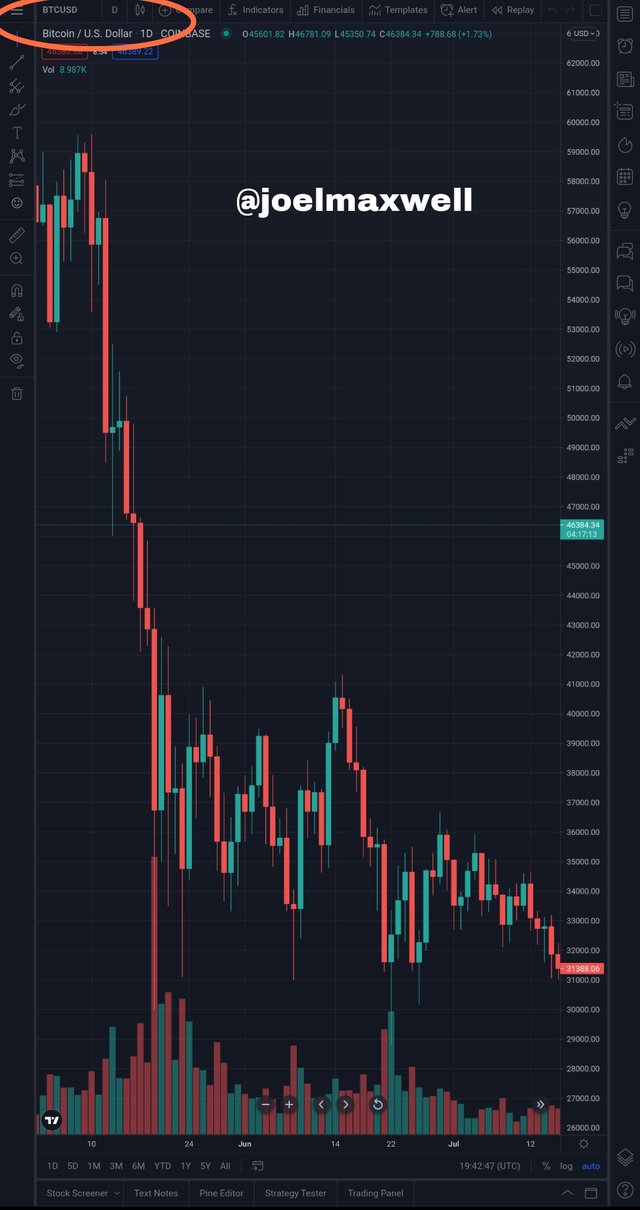
After opening my tradingview application I will click on chart and select the cryptocurrency, I will use BTCUSD.
Step 3
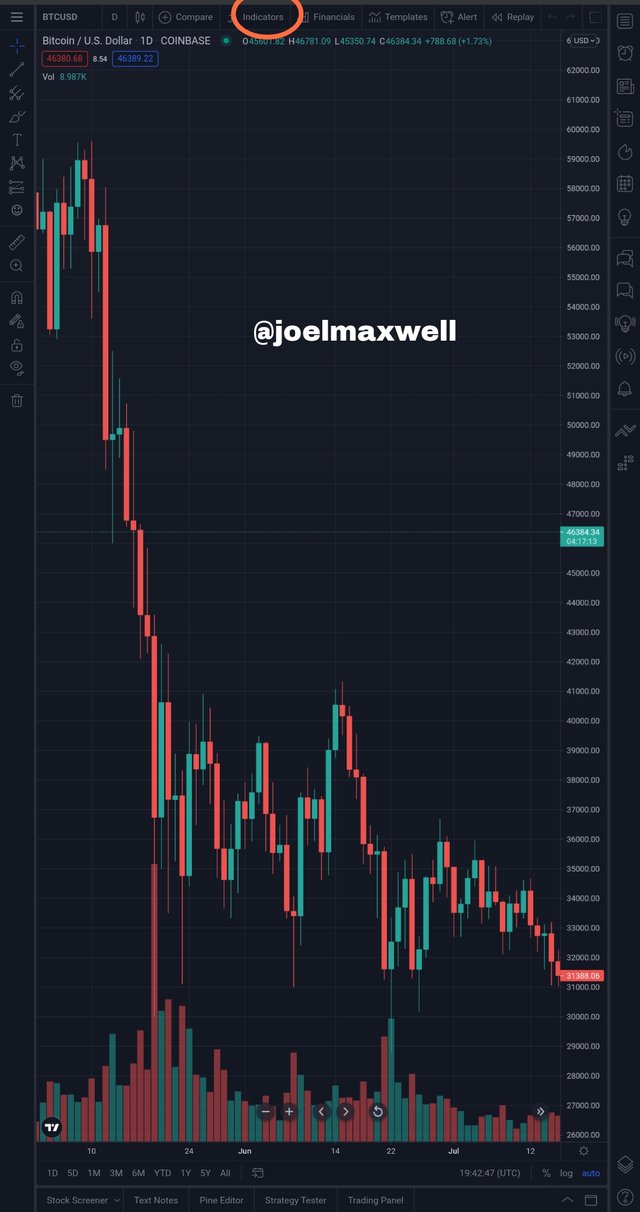
You click on the indicator icon
Step 4
You type in the search place stochastic,it will pop up you click on it
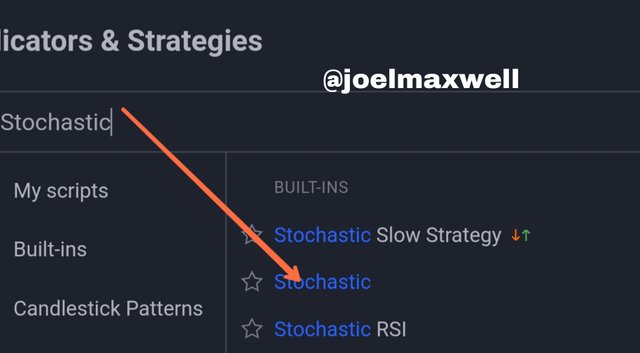
Step 5
The indicators will display
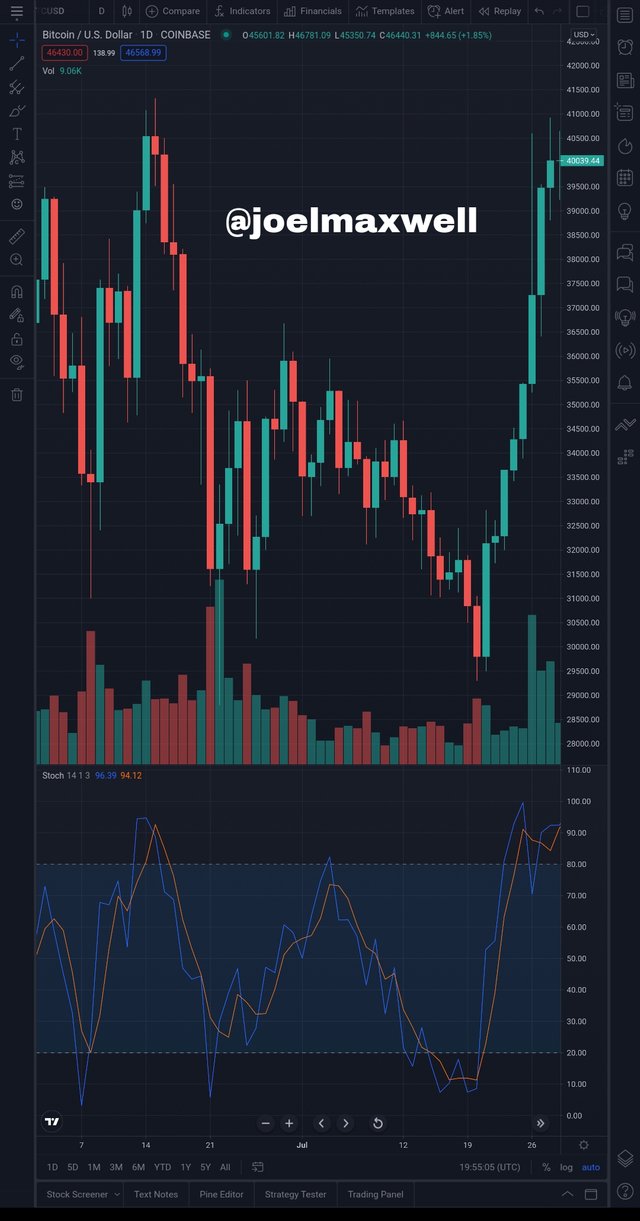
Step 6
I will have to click on the setting to set up the chart
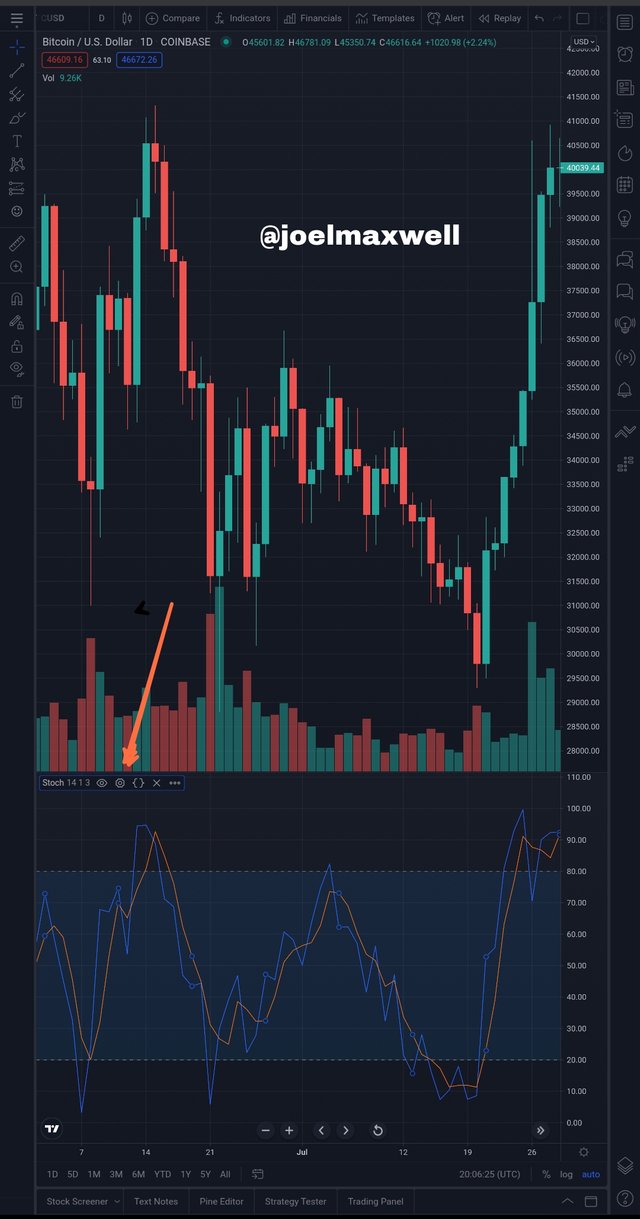
Step 7
I successfully set up
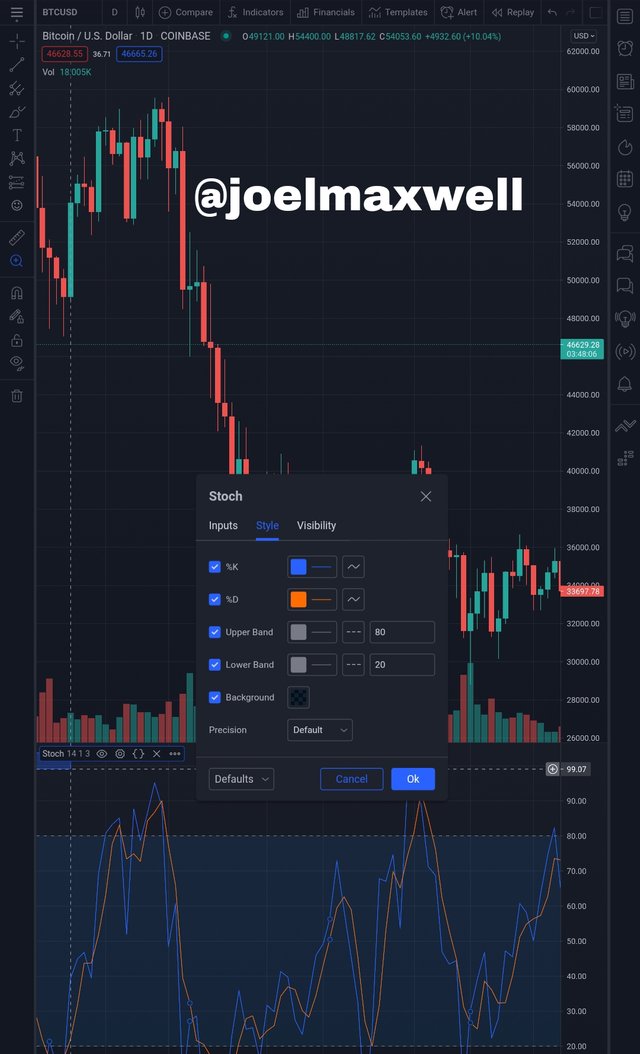
Step 8
I have successfully added stochastic oscillator to the chart,and have shown the %k line,%D line,the overbought and the oversold.below is the chart

Question 2
Show step by step how to add Parabolic Sar to the chart and how it looks in an uptrend and in a downtrend.
Answer
Step 1
I will still be using tradingview application andI will click on chart and select the cryptocurrency.
I will be using Btcusd

Step 2
Click on the indicator icon

Step 3
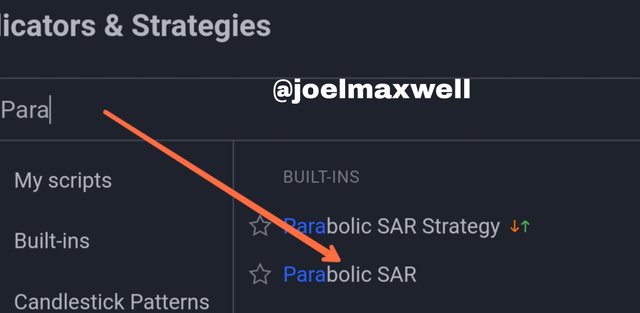
After clicking on the search icon you type in the search space" parabolic sar" it will pop up and you click on it.
Step 4
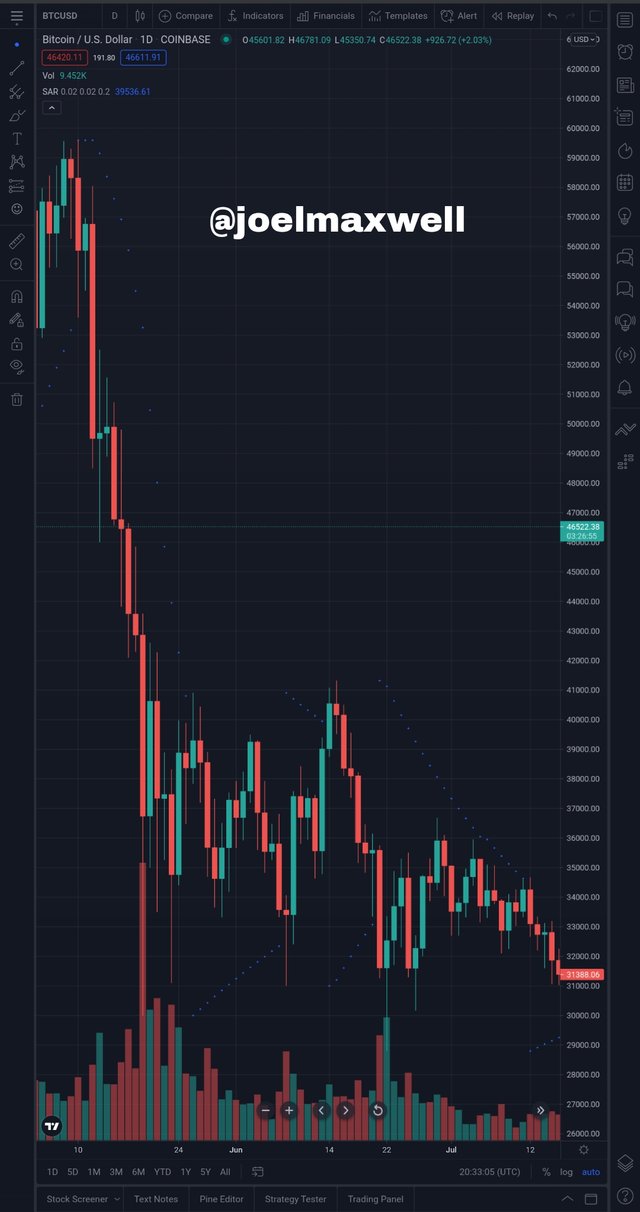
Our parabolic sar has been display on the chart in the form of dotted lines
Step 5
I will be increasing thr the thickness of the lines
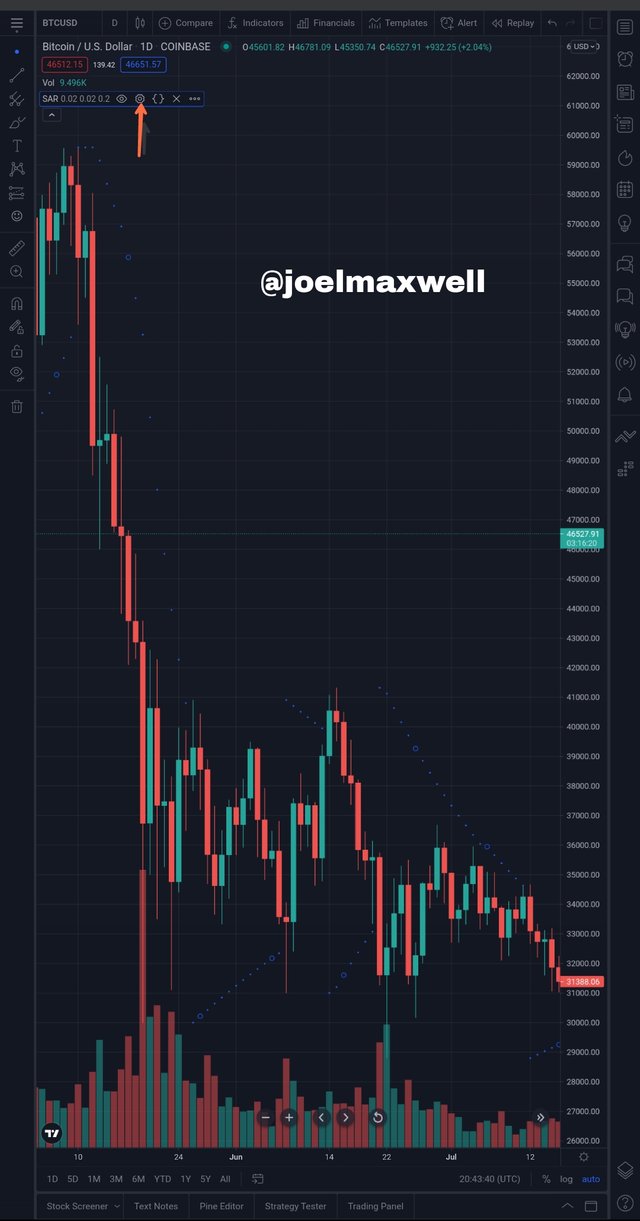
So I will have to reset it by going to setting
Step 6
I started doing the setting to make the parabolic sar thick
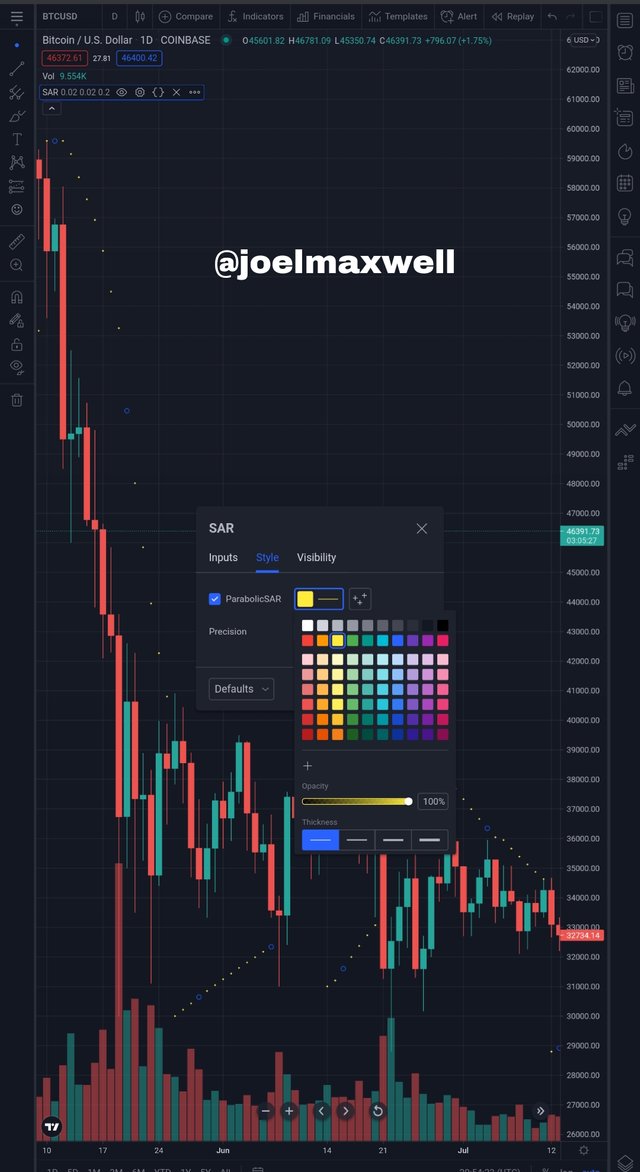
Step 7
I made the parabolic sar thick for easy identification
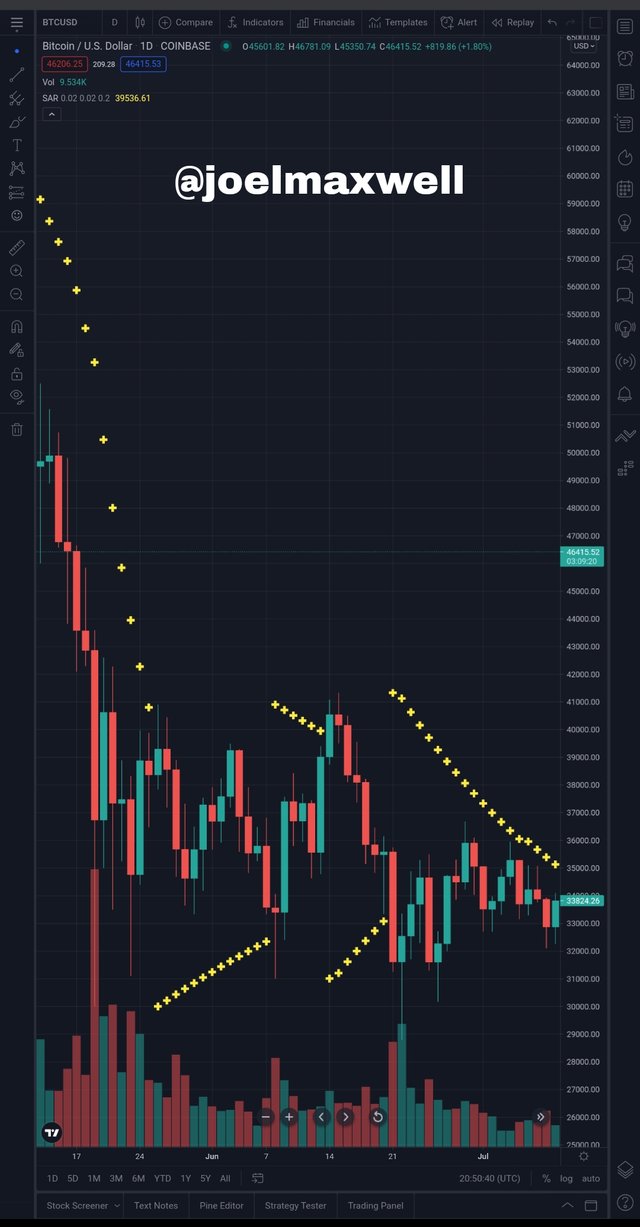
Step 8
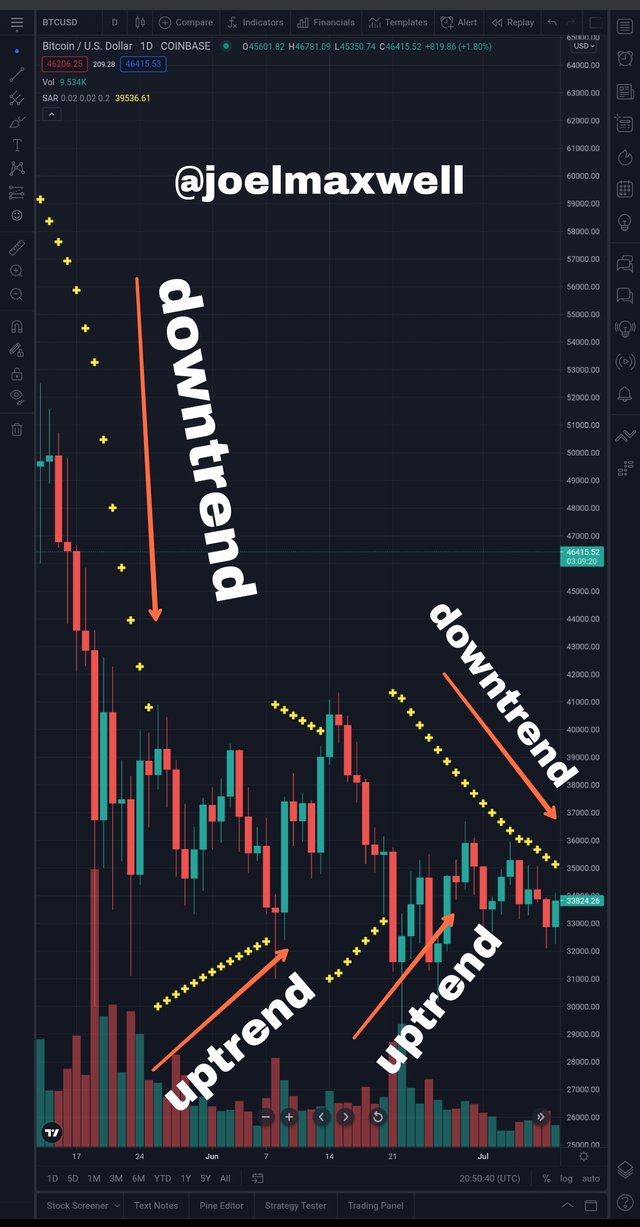
I have successfully made the chart thick and identify both the uptrend and downtrend
The uptrend is when the dotted line is below the price of assets and the downtrend is when the price is above the price of assets .
Chart below

Question 3
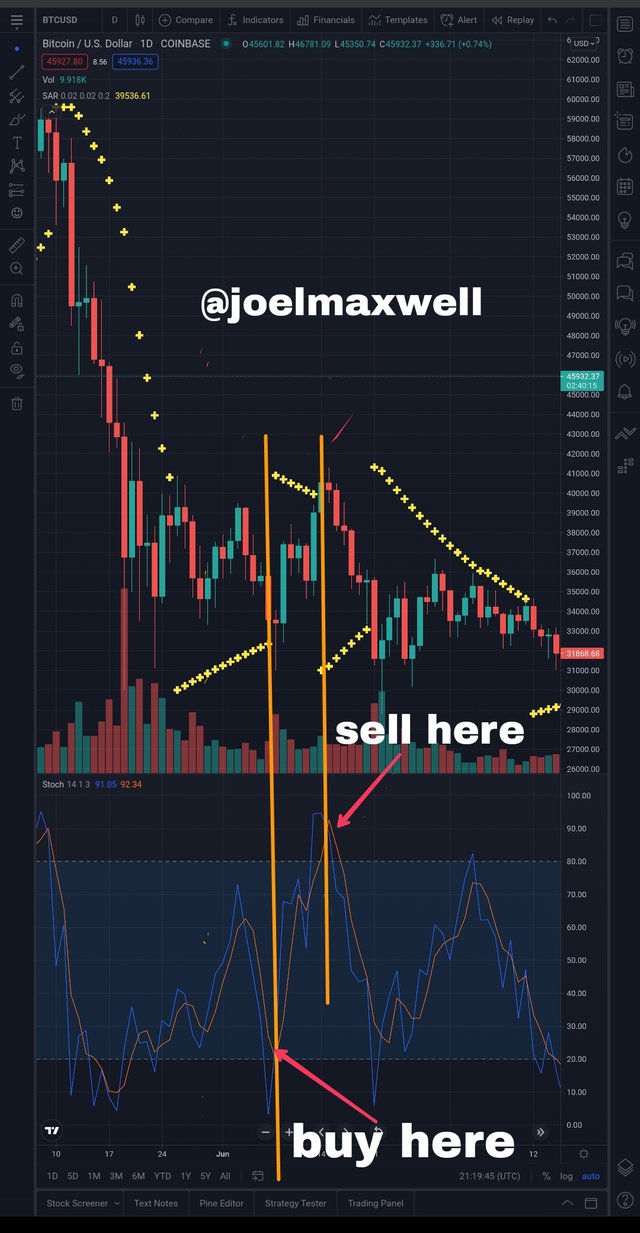
Add the two indicators (Stochastic Oscillator + Parabolic SAR) and simulate a trade in the same trading view, on how a trade would be taken
Answer
Step 1
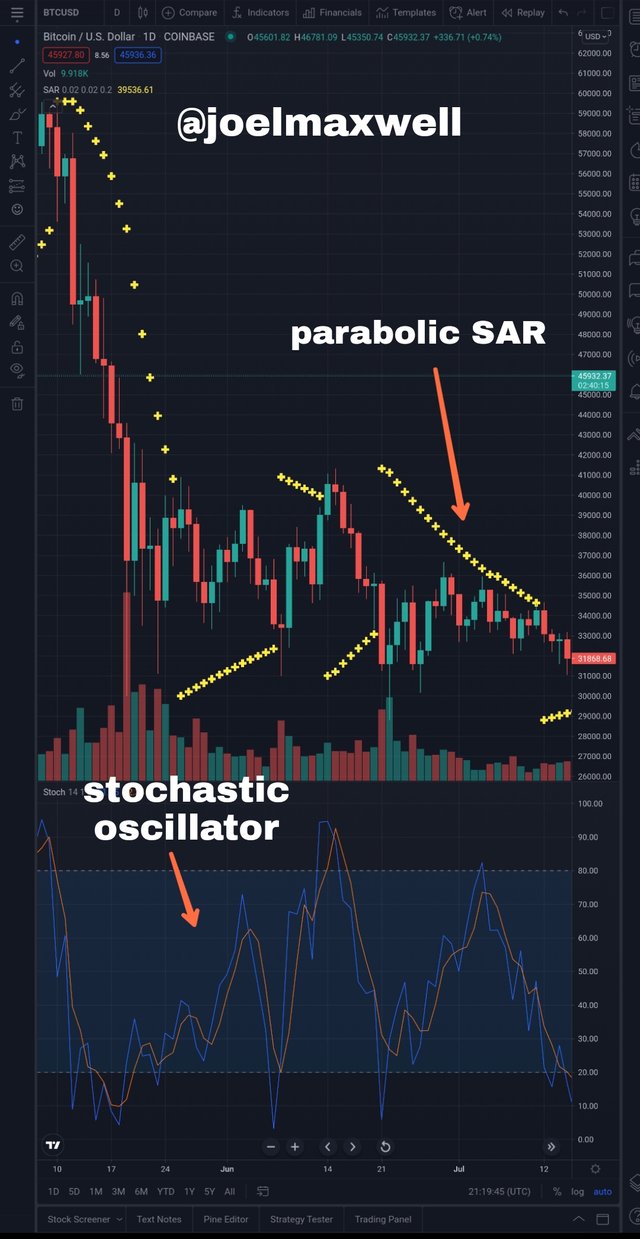
I followed the previous way by clicking on chart and selecting the cryptocurrency (BtcUsd) that I will be using then add the two indicators
Chart below
Step 2
After simulating ,have selected. Where it is favourable for the trader to buy and sell assets making use of the 2 indicators.
When I notice the %k line cross the %D line and move up in the stochastic oscillator and also notice a dotted line shown below the price.I advice the trader to buy because the market is cheap.
I have also indicated when the price rise and is the best moments to start selling assets and maximize profit in the market.
Chart below.

Conclusion
Wow, the lecture was really an impactful one learning about some important technical indicators in trading was really wonderful,Inalso learn about the fast moving stochastic and slow moving stochastic.
I also learn that combining the two indicators in a chart during trading will go a long way to assist traders in making decisions and maximize profits.
Thank you prof. @lenonmc21. And I hope I improved this week.
Downvoting a post can decrease pending rewards and make it less visible. Common reasons:
Submit